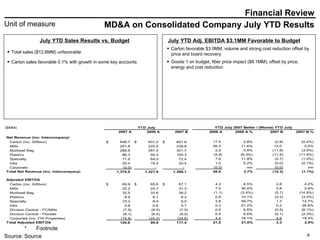
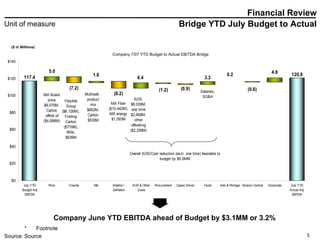
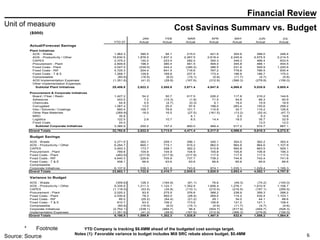
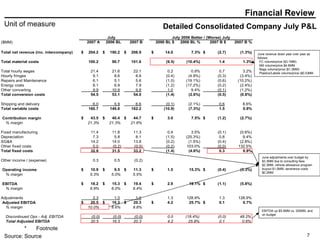
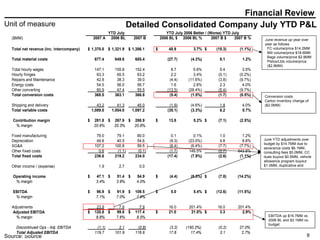
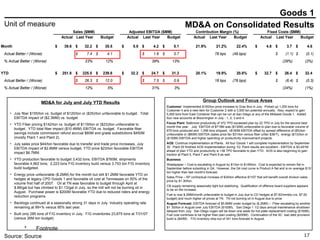
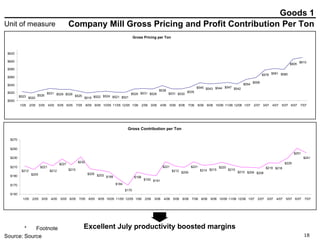
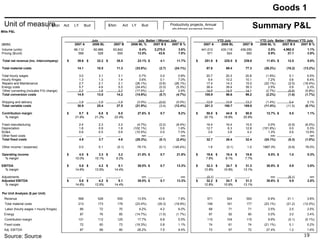
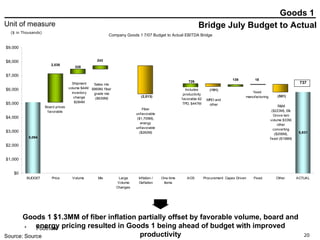
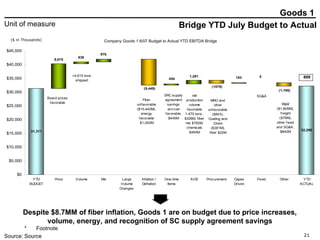
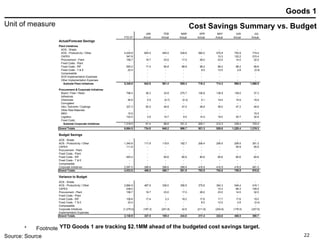
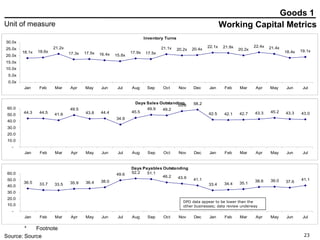
Company, LLC July and July YTD Financial August 23, 2007 Privileged and Confidential:  The following material has been Your Company, LLC
July and July YTD Financial Product A Consolidated Company MD&A and Results Company P&L Balance Sheet and Cash Flow Safety LTM Bank EBITDA Company Business Unit MD&A and Results Summary Goods 1 Goods 2 Goods 3 Goods 4 Labels Financial Product A Index
Financial Review MD&A on Consolidated Company July Results July Sales Results vs. Budget July Adj. EBITDA ($0.0MM) to Budget Overall sales unfavorable to budget ($8.3MM), primarily Goods 1, Goods 2, and Goods 3  Goods 1 shipments continue strong, backlogs have fallen to 29 days, but seasonally strong, board pricing favorable $1.1MM  June adj EBITDA on budget  Mill results on budget, fiber impact ($1.5MM), offset by board prices, $2.4MM, volume unfavorable
Financial Review MD&A on Consolidated Company July YTD Results July YTD Sales Results vs. Budget July YTD Adj. EBITDA $3.1MM Favorable to Budget Total sales ($12.6MM) unfavorable  Carton sales favorable 0.1% with growth in some key accounts  Carton favorable $3.0MM, volume and strong cost reduction offset by price and board recovery  Goods 1 on budget, fiber price impact ($8.1MM); offset by price, energy and cost reduction
Bridge YTD July Budget to Actual Financial Review ($ in Millions) Company June YTD EBITDA ahead of Budget by $3.1MM or 3.2% Company 7/07 YTD Budget to Actual EBITDA Bridge
Financial Review Cost Savings Summary vs. Budget YTD Company is tracking $6.6MM ahead of the budgeted cost savings target.  Notes (1): Favorable variance to budget includes Mill SRC rebate above budget, $0.4MM
Detailed Consolidated Company July P&L Financial Review June revenue down year over year as follows:    FC volume/price ($3.1MM)    Mill volume/price $4.6MM    Bags volume/price ($1.3MM)    Plastics/Labels volume/price ($0.5)MM  June adjustments over budget by $3.3MM due to consulting fees $2.3MM, vehicle allowance program buyout $1.0MM, severance costs $0.2MM EBITDA up $5.5MM vs. 2006BL and on budget
Detailed Consolidated Company July YTD P&L Financial Review June revenue up year over year as follows    FC volume/price $14.2MM    Mill volume/price $18.6MM    Bags volume/price $2.8MM    Plstcs/Lbls volume/price  ($2.8MM) Conversion costs   Carton inventory change of ($2.0MM)  June YTD adjustments over budget by $14.7MM due to  severance costs $6.1MM, consulting fees $5.0MM, CC dues buyout $0.5MM, vehicle allowance program buyout $1.0MM, duplicative and EBITDA up $16.7MM vs. 2006 BL and $3.1MM vs. budget
Company Balance Sheet Summary Financial Review Generally cash generating working capital movements since year end 2006
Company Cash Flow Summary Financial Review Despite puts and takes, cash generation $0.8MM above budget June YTD ($MM) ($MM) ($14.7MM) unfavorable variance to budget in Cash EBITDA Capital expenses lower than budget by $5.2MM Interest paid unfavorable to budget by ($2.9MM) $27.8MM favorable working capital savings Mandatory Debt Amortization in-line with budget $0.7MM unfavorable. $7.6MM favorable vs. budget due to pension and timing, ($6.3MM) unfavorable due to Field acquisition payments (taxes)
LTM Bank EBITDA and Net Debt / Bank EBITDA Financial Review Ended June with $233.5MM of Bank EBITDA, $1,071.4MM of Net Debt 4.6x Net Debt / Bank EBITDA vs. covenant of 6.5x ($68.7MM or 29.4% cushion) ($MM) Company LTM Bank EBITDA and Net Debt / Bank EBITDA 5.0x 4.7x 4.6x 4.5x 4.6x 4.6x 4.6x 4.6x 4.5x nm nm $211.7 $215.1 $215.9 $228.0 $228.3 $230.2 $232.0 $231.5 $231.4 $232.9 $235.6 $- $50.0 $100.0 $150.0 $200.0 $250.0 3/31/06 6/30/06 9/30/06 12/31/06 1/31/07 2/28/07 3/31/07 4/30/07 5/31/07 6/30/07 7/31/07 0.0x 1.0x 2.0x 3.0x 4.0x 5.0x 6.0x 7.0x
Company Detailed Consolidated Balance Sheet Financial Review Cash position of $87.7MM, down $7.2MM from May
Company Detailed Consolidated Cash Flow Financial Review Used $7.2MM in June with an ending cash balance of $87.7MM vs. June budget ending cash of $86.9MM
OSHA Recordable Accident Summary Safety Review June was a disappointing month overall, with tremendous performance in Bag. First half results are outstanding.
Financial Review Salaried Headcount Review 94 fewer salaried headcount at 6/30/07 than at 12/31/06 and 170 fewer at 6/30/07 than in the 2007 budget
July and July YTD Financial Product A Consolidated Company MD&A and Results Company P&L Balance Sheet and Cash Flow Safety LTM Bank EBITDA Company Business Unit MD&A and Results Summary Goods 1 Goods 2 Goods 3 Goods 4 Labels Financial Product A Index
Goods 1 MD&A on Consolidated Results Group Outlook and Focus Areas MD&A for July and July YTD Results July fiber $155/ton vs. budget of $120/ton or ($35)/ton unfavorable to budget.  Total EBITDA impact of ($2.3MM) vs. budget. YTD Fiber pricing $142/ton vs. budget of $119/ton or ($23)/ton unfavorable to budget.  YTD total fiber impact ($10.4MM) EBITDA vs. budget.  Favorable fiber savings include commission refund accrual $80M and grade substitutions $450M (mostly Plant 1 and Plant 2). July sales price $44/ton favorable due to transfer and trade price increases, July EBITDA impact of $2.8MM versus budget, YTD price $23/ton favorable EBITDA impact $6.7MM  YTD production favorable to budget 3,432 tons, EBITDA $760M, shipments favorable 4,962 tons;  2,223 tons F/G inventory build versus 3,753 ton F/G inventory build budgeted.  Energy price unfavorable ($.2MM) for the month but still $1.2MM favorable YTD on hedges at legacy CPD Goods 1 and favorable oil cost at Tennessee on 50% of the volume first half of 2007.  Oil at TN was favorable to budget through April at $.88/gal but has climbed to $1.13/gal in July, so the mill will not be burning oil in August.  Purchase power is $200M favorable YTD due to reduced riders and energy reduction programs. Backlogs continued at a seasonally strong 31 days in July  Industry operating rate remaining at 99+% versus 95% last year. Built only 285 tons of F/G inventory in July.  F/G inventories 23,675 tons at 7/31/07 (versus 26M ton budget) Customer : Implemented $100/ton price increase to Gray Box in July.  Picked up 1,200 tons for Customer 4 and a new item for Customer 2 with a 3,000 ton potential annually.  Also, expect to gain 5,000 tons from East Container that can be run at San Diego or any of the Midwest Goods 1.  Added four new accounts at Bloomington in July - 1, 2, 3 and 4. Focus Plant : Baltimore productivity of 372 TPD exceeded plan by 22 TPD in July for the second best month this year.  July  EBITDA of $719M was ($130M) unfavorable to plan due to favorable volume of 679 tons produced and  1,056 tons shipped, +$160M EBITDA offset by spread difference of ($5)/ton unfavorable or ($60M) EBITDA (sales price fav $31/ton versus fiber unfav $36/T),  energy ($13)/ton or ($150M) EBITDA and higher spending on productivity improvement projects. AOS : Continue implementation at Plants.  All four Goods 1 will complete implementation by September 30.  Plant 20 finished AOS implementation during 1Q. Plant results are excellent - EBITDA is $3,491M ahead of plan YTD and productivity is +38 TPD favorable to plan YTD.  AOS is also beginning to gain traction at Plant 5, Plant 7 and Plant 9 as well. Business :  Wastepaper – Cost is escalating in August by $1/ton to $149/ton.  Cost is expected to remain flat in September before subsiding in Q4.  However, the Q4 cost curve is Product A flat and is on average $13/ton higher than last month's forecast. Sales Price – SP contractual increase of $34/ton effective 8/1/07 that will benefit overall division sales price by $1.30/ton.  CB supply remaining seasonally tight but stabilizing.  Qualification of offshore board suppliers appears to be on the increase. Fuel is now $.2MM/month unfavorable to budget in July due to CD hedges at $7.83/mmbtu (vs. $7.50 budget) and much higher oil prices at TN.  TN not burning oil in August due to price. August Forecast : EBITDA forecast of $5.8MM under budget by ($.2MM) –  Fiber escalating by another $1 .50/ton in August over July EBITDA ($100M).  San Diego 1 1/2 days annual maintenance shutdown delayed from July.  San Diego cogen will be down one week for hot plate replacement costing ($150M).  Fuel cost continues to be higher than plan costing ($200M).  Continuation of the SC  bad debt provision build is ($40M) .  F/G inventory ship-out of 341 tons forecast in August.
Company Mill Gross Pricing and Profit Contribution Per Ton Goods 1 Excellent July productivity boosted margins Pricing has increased due to the recent industry-wide price increases. Improved operations and the March price increase are restoring margins March SRC refund accrual added $10/ton Gross Pricing per Ton $523 $520 $526 $531 $529 $529 $525 $519 $522 $524 $521 $521 $529 $531 $529 $538 $531 $530 $535 $545 $543 $544 $547 $542 $558 $578 $581 $580 $605 $610 $554 $500 $520 $540 $560 $580 $600 $620 1/05 2/05 3/05 4/05 5/05 6/05 7/05 8/05 9/05 10/05 11/05 12/05 1/06 2/06 3/06 4/06 5/06 6/06 7/06 8/06 9/06 10/06 11/06 12/06 1/07 2/07 3/07 4/07 5/07 6/07 7/07 Gross Contribution per Ton $212 $205 $221 $212 $227 $215 $232 $205 $203 $199 $184 $170 $198 $193 $191 $221 $212 $209 $221 $214 $215 $220 $215 $210 $209 $208 $219 $218 $229 $251 $241 $150 $170 $190 $210 $230 $250 $270 1/05 2/05 3/05 4/05 5/05 6/05 7/05 8/05 9/05 10/05 11/05 12/05 1/06 2/06 3/06 4/06 5/06 6/06 7/06 8/06 9/06 10/06 11/06 12/06 1/07 2/07 3/07 4/07 5/07 6/07 7/07
Summary P&L Goods 1 $/ton  Act  LY  Bud Price $593  $526  $556 $/ton  Act  LY  Bud Fiber  $155  $115  $120 Productivity projects, Annual shutdown expense timing. vs. budget F/G fluc .3 Supply timing ( .1) Mills P&L July July  Better / (Worse) July YTD July YTD July  Better / (Worse) YTD July ($MM) 2007 A 2006 BL 2007 B 2006 BL % 2007 B $ 2007 B % 2007 A 2006 BL 2007 B 2006 BL % 2007 B $ 2007 B % Volume (units) 66,112 60,986 63,842 8.4% 2,270.0 3.6% 441,012 430,118 436,050 2.5% 4,962.0 1.1% Pricing ($/unit) 599 528 555 13.5% 43.6 7.8% 571 524 550 8.9% 21.1 3.8% Total net revenue (inc. intercompany) 39.6 $  32.2 $  35.5 $  23.1% 4.1 $  11.7% 251.8 $  225.5 $  239.8 $  11.6% 12.0 $  5.0% Total material costs 14.1 10.5 11.3 (33.8%) (2.7) (24.1%) 87.6 69.4 77.3 (26.2%) (10.2) (13.2%) Total hourly wages 3.0 3.1 3.1 0.7% 0.0 0.8% 20.7 20.3 20.8 (1.9%) 0.1 0.5% Hourly fringes 1.3 1.3 1.4 3.6% 0.1 7.0% 9.4 10.2 10.1 7.2% 0.6 6.4% Repairs and Maintenance 2.7 2.1 2.1 (26.1%) (0.6) (26.1%) 17.4 14.3 15.0 (22.1%) (2.5) (16.4%) Energy costs 5.7 4.6 5.5 (24.4%) (0.3) (5.3%) 38.4 39.4 39.3 2.5% 0.9 2.3% Other converting (includes F/G change) 2.2 1.8 2.2 (17.5%) 0.1 2.6% 14.9 14.5 14.1 (2.7%) (0.8) (5.8%) Total conversion costs 14.9 13.0 14.2 (14.9%) (0.7) (4.7%) 100.9 98.6 99.2 (2.2%) (1.6) (1.7%) Shipping and delivery 1.9 1.9 1.9 (3.0%) (0.0) (0.0%) 12.8 12.6 13.2 (1.4%) 0.4 3.1% Total variable costs 30.9 25.4 27.5 (21.9%) (3.4) (12.4%) 201.3 180.7 189.8 (11.4%) (11.5) (6.1%) Contribution margin 8.7 $  6.8 $  8.0 $  27.6% 0.7 $  9.2% 50.5 $  44.8 $  50.0 $  12.7% 0.5 $  1.1% % margin 21.9% 21.2% 22.4% 20.1% 19.9% 20.8% Fixed manufacturing  2.4 2.3 2.2 (4.7%) (0.2) (8.4%) 16.4 16.4 15.5 0.0% (0.9) (6.0%) Depreciation 1.8 0.9 1.8 (102.1%) 0.0 1.6% 12.7 6.3 12.8 (101.8%) 0.0 0.3% SG&A 0.6 0.5 0.6 (10.5%) 0.0 7.0% 3.6 3.6 4.2 1.3% 0.6 13.8% Other fixed costs  - - - nm - nm - - - nm - nm Total fixed costs 4.8 3.7 4.6 (29.3%) (0.1) (2.4%) 32.7 26.4 32.4 (24.1%) (0.3) (1.0%) Other income / (expense) 0.0 0.1 (0.1) 79.1% (0.1) (145.4%) 1.8 (0.1) 1.0 1887.3% (0.8) 76.0% Operating income 4.0 $  3.3 $  3.2 $  21.5% 0.7 $  21.8% 19.6 $  18.4 $  18.6 $  6.5% 1.0 $  5.3% % margin 10.0% 10.1% 9.2% 7.8% 8.1% 7.7% EBITDA 5.8 $  4.2 $  5.1 $  39.0% 0.7 $  13.3% 32.3 $  24.7 $  31.3 $  30.9% 0.9 $  3.0% % margin 14.6% 12.9% 14.4% 12.8% 10.9% 13.1% Adjustments - - - nm - nm (0.1) - - nm (0.1) nm Adjusted EBITDA 5.8 $  4.2 $  5.1 $  39.0% 0.7 $  13.3% 32.2 $  24.7 $  31.3 $  30.6% 0.9 $  2.8% % margin 14.6% 12.9% 14.4% 12.8% 10.9% 13.1% Per Unit Analysis ($ per Unit) Revenue 599 528 555 13.5% 43.6 7.8% 571 524 550 8.9% 21.1 3.8% Total material costs 213 173 178 (23.4%) (35.3) (19.9%) 199 161 177 (23.1%) (21.2) (12.0%) Labor (hourly wages + hourly fringes) 66 72 70 9.2% 4.2 6.0% 68 71 71 3.5% 2.5 3.5% Energy 87 76 85 (14.7%) (1.5) (1.7%) 87 92 90 5.0% 3.0 3.4% Contribution margin 131 112 125 17.7% 6.8 5.5% 115 104 115 9.9% (0.1) (0.1%) Fixed costs 72 60 73 (19.3%) 0.8 1.1% 74 61 74 (21.1%) 0.1 0.2% Adj. EBITDA 87 68 80 28.2% 7.5 9.4% 73 57 72 27.4% 1.2 1.6%
Bridge July Budget to Actual Goods 1 ($ in Thousands) Goods 1 $1.3MM of fiber inflation partially offset by favorable volume, board and energy pricing resulted in Goods 1 being ahead of budget with improved productivity Company Goods 1 7/07 Budget to Actual EBITDA Bridge
Bridge YTD July Budget to Actual Goods 1 ($ in Thousands) Despite $8.7MM of fiber inflation, Goods 1 are on budget due to price increases, volume, energy, and recognition of SC supply agreement savings Company Goods 1 6/07 Budget to Actual YTD EBITDA Bridge
Goods 1 Cost Savings Summary vs. Budget YTD Goods 1 are tracking $2.1MM ahead of the budgeted cost savings target.
Working Capital Metrics Goods 1 DPO data appear to be lower than the other businesses; data review underway

M,D, & A Sample

  • 1.
    Company, LLC Julyand July YTD Financial August 23, 2007 Privileged and Confidential: The following material has been Your Company, LLC
  • 2.
    July and JulyYTD Financial Product A Consolidated Company MD&A and Results Company P&L Balance Sheet and Cash Flow Safety LTM Bank EBITDA Company Business Unit MD&A and Results Summary Goods 1 Goods 2 Goods 3 Goods 4 Labels Financial Product A Index
  • 3.
    Financial Review MD&Aon Consolidated Company July Results July Sales Results vs. Budget July Adj. EBITDA ($0.0MM) to Budget Overall sales unfavorable to budget ($8.3MM), primarily Goods 1, Goods 2, and Goods 3 Goods 1 shipments continue strong, backlogs have fallen to 29 days, but seasonally strong, board pricing favorable $1.1MM June adj EBITDA on budget Mill results on budget, fiber impact ($1.5MM), offset by board prices, $2.4MM, volume unfavorable
  • 4.
    Financial Review MD&Aon Consolidated Company July YTD Results July YTD Sales Results vs. Budget July YTD Adj. EBITDA $3.1MM Favorable to Budget Total sales ($12.6MM) unfavorable Carton sales favorable 0.1% with growth in some key accounts Carton favorable $3.0MM, volume and strong cost reduction offset by price and board recovery Goods 1 on budget, fiber price impact ($8.1MM); offset by price, energy and cost reduction
  • 5.
    Bridge YTD JulyBudget to Actual Financial Review ($ in Millions) Company June YTD EBITDA ahead of Budget by $3.1MM or 3.2% Company 7/07 YTD Budget to Actual EBITDA Bridge
  • 6.
    Financial Review CostSavings Summary vs. Budget YTD Company is tracking $6.6MM ahead of the budgeted cost savings target. Notes (1): Favorable variance to budget includes Mill SRC rebate above budget, $0.4MM
  • 7.
    Detailed Consolidated CompanyJuly P&L Financial Review June revenue down year over year as follows: FC volume/price ($3.1MM) Mill volume/price $4.6MM Bags volume/price ($1.3MM) Plastics/Labels volume/price ($0.5)MM June adjustments over budget by $3.3MM due to consulting fees $2.3MM, vehicle allowance program buyout $1.0MM, severance costs $0.2MM EBITDA up $5.5MM vs. 2006BL and on budget
  • 8.
    Detailed Consolidated CompanyJuly YTD P&L Financial Review June revenue up year over year as follows FC volume/price $14.2MM Mill volume/price $18.6MM Bags volume/price $2.8MM Plstcs/Lbls volume/price ($2.8MM) Conversion costs  Carton inventory change of ($2.0MM) June YTD adjustments over budget by $14.7MM due to severance costs $6.1MM, consulting fees $5.0MM, CC dues buyout $0.5MM, vehicle allowance program buyout $1.0MM, duplicative and EBITDA up $16.7MM vs. 2006 BL and $3.1MM vs. budget
  • 9.
    Company Balance SheetSummary Financial Review Generally cash generating working capital movements since year end 2006
  • 10.
    Company Cash FlowSummary Financial Review Despite puts and takes, cash generation $0.8MM above budget June YTD ($MM) ($MM) ($14.7MM) unfavorable variance to budget in Cash EBITDA Capital expenses lower than budget by $5.2MM Interest paid unfavorable to budget by ($2.9MM) $27.8MM favorable working capital savings Mandatory Debt Amortization in-line with budget $0.7MM unfavorable. $7.6MM favorable vs. budget due to pension and timing, ($6.3MM) unfavorable due to Field acquisition payments (taxes)
  • 11.
    LTM Bank EBITDAand Net Debt / Bank EBITDA Financial Review Ended June with $233.5MM of Bank EBITDA, $1,071.4MM of Net Debt 4.6x Net Debt / Bank EBITDA vs. covenant of 6.5x ($68.7MM or 29.4% cushion) ($MM) Company LTM Bank EBITDA and Net Debt / Bank EBITDA 5.0x 4.7x 4.6x 4.5x 4.6x 4.6x 4.6x 4.6x 4.5x nm nm $211.7 $215.1 $215.9 $228.0 $228.3 $230.2 $232.0 $231.5 $231.4 $232.9 $235.6 $- $50.0 $100.0 $150.0 $200.0 $250.0 3/31/06 6/30/06 9/30/06 12/31/06 1/31/07 2/28/07 3/31/07 4/30/07 5/31/07 6/30/07 7/31/07 0.0x 1.0x 2.0x 3.0x 4.0x 5.0x 6.0x 7.0x
  • 12.
    Company Detailed ConsolidatedBalance Sheet Financial Review Cash position of $87.7MM, down $7.2MM from May
  • 13.
    Company Detailed ConsolidatedCash Flow Financial Review Used $7.2MM in June with an ending cash balance of $87.7MM vs. June budget ending cash of $86.9MM
  • 14.
    OSHA Recordable AccidentSummary Safety Review June was a disappointing month overall, with tremendous performance in Bag. First half results are outstanding.
  • 15.
    Financial Review SalariedHeadcount Review 94 fewer salaried headcount at 6/30/07 than at 12/31/06 and 170 fewer at 6/30/07 than in the 2007 budget
  • 16.
    July and JulyYTD Financial Product A Consolidated Company MD&A and Results Company P&L Balance Sheet and Cash Flow Safety LTM Bank EBITDA Company Business Unit MD&A and Results Summary Goods 1 Goods 2 Goods 3 Goods 4 Labels Financial Product A Index
  • 17.
    Goods 1 MD&Aon Consolidated Results Group Outlook and Focus Areas MD&A for July and July YTD Results July fiber $155/ton vs. budget of $120/ton or ($35)/ton unfavorable to budget. Total EBITDA impact of ($2.3MM) vs. budget. YTD Fiber pricing $142/ton vs. budget of $119/ton or ($23)/ton unfavorable to budget. YTD total fiber impact ($10.4MM) EBITDA vs. budget. Favorable fiber savings include commission refund accrual $80M and grade substitutions $450M (mostly Plant 1 and Plant 2). July sales price $44/ton favorable due to transfer and trade price increases, July EBITDA impact of $2.8MM versus budget, YTD price $23/ton favorable EBITDA impact $6.7MM YTD production favorable to budget 3,432 tons, EBITDA $760M, shipments favorable 4,962 tons; 2,223 tons F/G inventory build versus 3,753 ton F/G inventory build budgeted. Energy price unfavorable ($.2MM) for the month but still $1.2MM favorable YTD on hedges at legacy CPD Goods 1 and favorable oil cost at Tennessee on 50% of the volume first half of 2007. Oil at TN was favorable to budget through April at $.88/gal but has climbed to $1.13/gal in July, so the mill will not be burning oil in August. Purchase power is $200M favorable YTD due to reduced riders and energy reduction programs. Backlogs continued at a seasonally strong 31 days in July Industry operating rate remaining at 99+% versus 95% last year. Built only 285 tons of F/G inventory in July. F/G inventories 23,675 tons at 7/31/07 (versus 26M ton budget) Customer : Implemented $100/ton price increase to Gray Box in July. Picked up 1,200 tons for Customer 4 and a new item for Customer 2 with a 3,000 ton potential annually. Also, expect to gain 5,000 tons from East Container that can be run at San Diego or any of the Midwest Goods 1. Added four new accounts at Bloomington in July - 1, 2, 3 and 4. Focus Plant : Baltimore productivity of 372 TPD exceeded plan by 22 TPD in July for the second best month this year. July EBITDA of $719M was ($130M) unfavorable to plan due to favorable volume of 679 tons produced and 1,056 tons shipped, +$160M EBITDA offset by spread difference of ($5)/ton unfavorable or ($60M) EBITDA (sales price fav $31/ton versus fiber unfav $36/T), energy ($13)/ton or ($150M) EBITDA and higher spending on productivity improvement projects. AOS : Continue implementation at Plants. All four Goods 1 will complete implementation by September 30. Plant 20 finished AOS implementation during 1Q. Plant results are excellent - EBITDA is $3,491M ahead of plan YTD and productivity is +38 TPD favorable to plan YTD. AOS is also beginning to gain traction at Plant 5, Plant 7 and Plant 9 as well. Business : Wastepaper – Cost is escalating in August by $1/ton to $149/ton. Cost is expected to remain flat in September before subsiding in Q4. However, the Q4 cost curve is Product A flat and is on average $13/ton higher than last month's forecast. Sales Price – SP contractual increase of $34/ton effective 8/1/07 that will benefit overall division sales price by $1.30/ton. CB supply remaining seasonally tight but stabilizing. Qualification of offshore board suppliers appears to be on the increase. Fuel is now $.2MM/month unfavorable to budget in July due to CD hedges at $7.83/mmbtu (vs. $7.50 budget) and much higher oil prices at TN. TN not burning oil in August due to price. August Forecast : EBITDA forecast of $5.8MM under budget by ($.2MM) – Fiber escalating by another $1 .50/ton in August over July EBITDA ($100M). San Diego 1 1/2 days annual maintenance shutdown delayed from July. San Diego cogen will be down one week for hot plate replacement costing ($150M). Fuel cost continues to be higher than plan costing ($200M). Continuation of the SC bad debt provision build is ($40M) . F/G inventory ship-out of 341 tons forecast in August.
  • 18.
    Company Mill GrossPricing and Profit Contribution Per Ton Goods 1 Excellent July productivity boosted margins Pricing has increased due to the recent industry-wide price increases. Improved operations and the March price increase are restoring margins March SRC refund accrual added $10/ton Gross Pricing per Ton $523 $520 $526 $531 $529 $529 $525 $519 $522 $524 $521 $521 $529 $531 $529 $538 $531 $530 $535 $545 $543 $544 $547 $542 $558 $578 $581 $580 $605 $610 $554 $500 $520 $540 $560 $580 $600 $620 1/05 2/05 3/05 4/05 5/05 6/05 7/05 8/05 9/05 10/05 11/05 12/05 1/06 2/06 3/06 4/06 5/06 6/06 7/06 8/06 9/06 10/06 11/06 12/06 1/07 2/07 3/07 4/07 5/07 6/07 7/07 Gross Contribution per Ton $212 $205 $221 $212 $227 $215 $232 $205 $203 $199 $184 $170 $198 $193 $191 $221 $212 $209 $221 $214 $215 $220 $215 $210 $209 $208 $219 $218 $229 $251 $241 $150 $170 $190 $210 $230 $250 $270 1/05 2/05 3/05 4/05 5/05 6/05 7/05 8/05 9/05 10/05 11/05 12/05 1/06 2/06 3/06 4/06 5/06 6/06 7/06 8/06 9/06 10/06 11/06 12/06 1/07 2/07 3/07 4/07 5/07 6/07 7/07
  • 19.
    Summary P&L Goods1 $/ton Act LY Bud Price $593 $526 $556 $/ton Act LY Bud Fiber $155 $115 $120 Productivity projects, Annual shutdown expense timing. vs. budget F/G fluc .3 Supply timing ( .1) Mills P&L July July Better / (Worse) July YTD July YTD July Better / (Worse) YTD July ($MM) 2007 A 2006 BL 2007 B 2006 BL % 2007 B $ 2007 B % 2007 A 2006 BL 2007 B 2006 BL % 2007 B $ 2007 B % Volume (units) 66,112 60,986 63,842 8.4% 2,270.0 3.6% 441,012 430,118 436,050 2.5% 4,962.0 1.1% Pricing ($/unit) 599 528 555 13.5% 43.6 7.8% 571 524 550 8.9% 21.1 3.8% Total net revenue (inc. intercompany) 39.6 $ 32.2 $ 35.5 $ 23.1% 4.1 $ 11.7% 251.8 $ 225.5 $ 239.8 $ 11.6% 12.0 $ 5.0% Total material costs 14.1 10.5 11.3 (33.8%) (2.7) (24.1%) 87.6 69.4 77.3 (26.2%) (10.2) (13.2%) Total hourly wages 3.0 3.1 3.1 0.7% 0.0 0.8% 20.7 20.3 20.8 (1.9%) 0.1 0.5% Hourly fringes 1.3 1.3 1.4 3.6% 0.1 7.0% 9.4 10.2 10.1 7.2% 0.6 6.4% Repairs and Maintenance 2.7 2.1 2.1 (26.1%) (0.6) (26.1%) 17.4 14.3 15.0 (22.1%) (2.5) (16.4%) Energy costs 5.7 4.6 5.5 (24.4%) (0.3) (5.3%) 38.4 39.4 39.3 2.5% 0.9 2.3% Other converting (includes F/G change) 2.2 1.8 2.2 (17.5%) 0.1 2.6% 14.9 14.5 14.1 (2.7%) (0.8) (5.8%) Total conversion costs 14.9 13.0 14.2 (14.9%) (0.7) (4.7%) 100.9 98.6 99.2 (2.2%) (1.6) (1.7%) Shipping and delivery 1.9 1.9 1.9 (3.0%) (0.0) (0.0%) 12.8 12.6 13.2 (1.4%) 0.4 3.1% Total variable costs 30.9 25.4 27.5 (21.9%) (3.4) (12.4%) 201.3 180.7 189.8 (11.4%) (11.5) (6.1%) Contribution margin 8.7 $ 6.8 $ 8.0 $ 27.6% 0.7 $ 9.2% 50.5 $ 44.8 $ 50.0 $ 12.7% 0.5 $ 1.1% % margin 21.9% 21.2% 22.4% 20.1% 19.9% 20.8% Fixed manufacturing 2.4 2.3 2.2 (4.7%) (0.2) (8.4%) 16.4 16.4 15.5 0.0% (0.9) (6.0%) Depreciation 1.8 0.9 1.8 (102.1%) 0.0 1.6% 12.7 6.3 12.8 (101.8%) 0.0 0.3% SG&A 0.6 0.5 0.6 (10.5%) 0.0 7.0% 3.6 3.6 4.2 1.3% 0.6 13.8% Other fixed costs - - - nm - nm - - - nm - nm Total fixed costs 4.8 3.7 4.6 (29.3%) (0.1) (2.4%) 32.7 26.4 32.4 (24.1%) (0.3) (1.0%) Other income / (expense) 0.0 0.1 (0.1) 79.1% (0.1) (145.4%) 1.8 (0.1) 1.0 1887.3% (0.8) 76.0% Operating income 4.0 $ 3.3 $ 3.2 $ 21.5% 0.7 $ 21.8% 19.6 $ 18.4 $ 18.6 $ 6.5% 1.0 $ 5.3% % margin 10.0% 10.1% 9.2% 7.8% 8.1% 7.7% EBITDA 5.8 $ 4.2 $ 5.1 $ 39.0% 0.7 $ 13.3% 32.3 $ 24.7 $ 31.3 $ 30.9% 0.9 $ 3.0% % margin 14.6% 12.9% 14.4% 12.8% 10.9% 13.1% Adjustments - - - nm - nm (0.1) - - nm (0.1) nm Adjusted EBITDA 5.8 $ 4.2 $ 5.1 $ 39.0% 0.7 $ 13.3% 32.2 $ 24.7 $ 31.3 $ 30.6% 0.9 $ 2.8% % margin 14.6% 12.9% 14.4% 12.8% 10.9% 13.1% Per Unit Analysis ($ per Unit) Revenue 599 528 555 13.5% 43.6 7.8% 571 524 550 8.9% 21.1 3.8% Total material costs 213 173 178 (23.4%) (35.3) (19.9%) 199 161 177 (23.1%) (21.2) (12.0%) Labor (hourly wages + hourly fringes) 66 72 70 9.2% 4.2 6.0% 68 71 71 3.5% 2.5 3.5% Energy 87 76 85 (14.7%) (1.5) (1.7%) 87 92 90 5.0% 3.0 3.4% Contribution margin 131 112 125 17.7% 6.8 5.5% 115 104 115 9.9% (0.1) (0.1%) Fixed costs 72 60 73 (19.3%) 0.8 1.1% 74 61 74 (21.1%) 0.1 0.2% Adj. EBITDA 87 68 80 28.2% 7.5 9.4% 73 57 72 27.4% 1.2 1.6%
  • 20.
    Bridge July Budgetto Actual Goods 1 ($ in Thousands) Goods 1 $1.3MM of fiber inflation partially offset by favorable volume, board and energy pricing resulted in Goods 1 being ahead of budget with improved productivity Company Goods 1 7/07 Budget to Actual EBITDA Bridge
  • 21.
    Bridge YTD JulyBudget to Actual Goods 1 ($ in Thousands) Despite $8.7MM of fiber inflation, Goods 1 are on budget due to price increases, volume, energy, and recognition of SC supply agreement savings Company Goods 1 6/07 Budget to Actual YTD EBITDA Bridge
  • 22.
    Goods 1 CostSavings Summary vs. Budget YTD Goods 1 are tracking $2.1MM ahead of the budgeted cost savings target.
  • 23.
    Working Capital MetricsGoods 1 DPO data appear to be lower than the other businesses; data review underway

Editor's Notes