MatPlotLib
Prerequiste:-
Python
To install Matplotlibwe use pip install matplotlib
Import numpy as np
Import matplotlib.pyplot as plt
https://matplotlib.org/
https://vegibit.com/matplotlib-in-jupyter-notebook/
https://www.youtube.com/watch?v=OZOOLe2imFo
2.
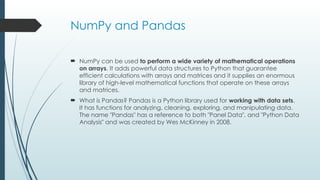
NumPy and Pandas
NumPy can be used to perform a wide variety of mathematical operations
on arrays. It adds powerful data structures to Python that guarantee
efficient calculations with arrays and matrices and it supplies an enormous
library of high-level mathematical functions that operate on these arrays
and matrices.
What is Pandas? Pandas is a Python library used for working with data sets.
It has functions for analyzing, cleaning, exploring, and manipulating data.
The name "Pandas" has a reference to both "Panel Data", and "Python Data
Analysis" and was created by Wes McKinney in 2008.
Line Plot
ForThis let us take an example of stock prices to understand it better
to plot the graph we use plt.plot(xdata,ydata,c=‘’,lw=‘’,linestyle=‘’)
To display the plot we use plt.show()
C is used to change color of the line
Lw is used to set line width
Linestyle is used to set style of aline for example dotted line
,”r—”
5.
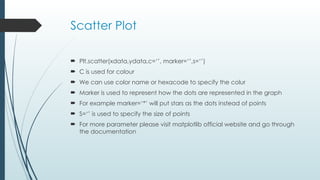
Scatter Plot
Plt.scatter(xdata,ydata,c=‘’,marker=‘’,s=‘’)
C is used for colour
We can use color name or hexacode to specify the colur
Marker is used to represent how the dots are represented in the graph
For example marker=‘*’ will put stars as the dots instead of points
S=‘’ is used to specify the size of points
For more parameter please visit matplotlib official website and go through
the documentation
Pie Chart
Letsus take the example of the various programming language people
prefer
Plt.pie(data ,label=‘’ explode=‘’ autopct=“%.2f%%
”,pctdistance=‘’,startangle=)
Explodes need to be another set of array
Ex explodes=[0,0.3,0.2….]
9.
Box Plot
Exampleto understand box plot is heights of n no of people
Heights=np.random.normal(172,8,300)
Plt.boxplot(heights)
Plt.show()
10.
Plot Customization
Exampleincome through various years
Plt.plot(xdata,ydata)
Plt.title(“Income of john(in RS)”)#generates title of the plot
Plt.xlabel(“year”)#generates x axis title
Plt.ylabel(“yearly income in usd”)
plt.show
We can also set fontsize= fontname=“” for all the above functions


![Pie Chart
Lets us take the example of the various programming language people
prefer
Plt.pie(data ,label=‘’ explode=‘’ autopct=“%.2f%%
”,pctdistance=‘’,startangle=)
Explodes need to be another set of array
Ex explodes=[0,0.3,0.2….]](https://image.slidesharecdn.com/matplotlibds-251231055826-5f2244f1/85/MatPlotLib-data-Science-tools-and-techniques-8-320.jpg)