Download to read offline

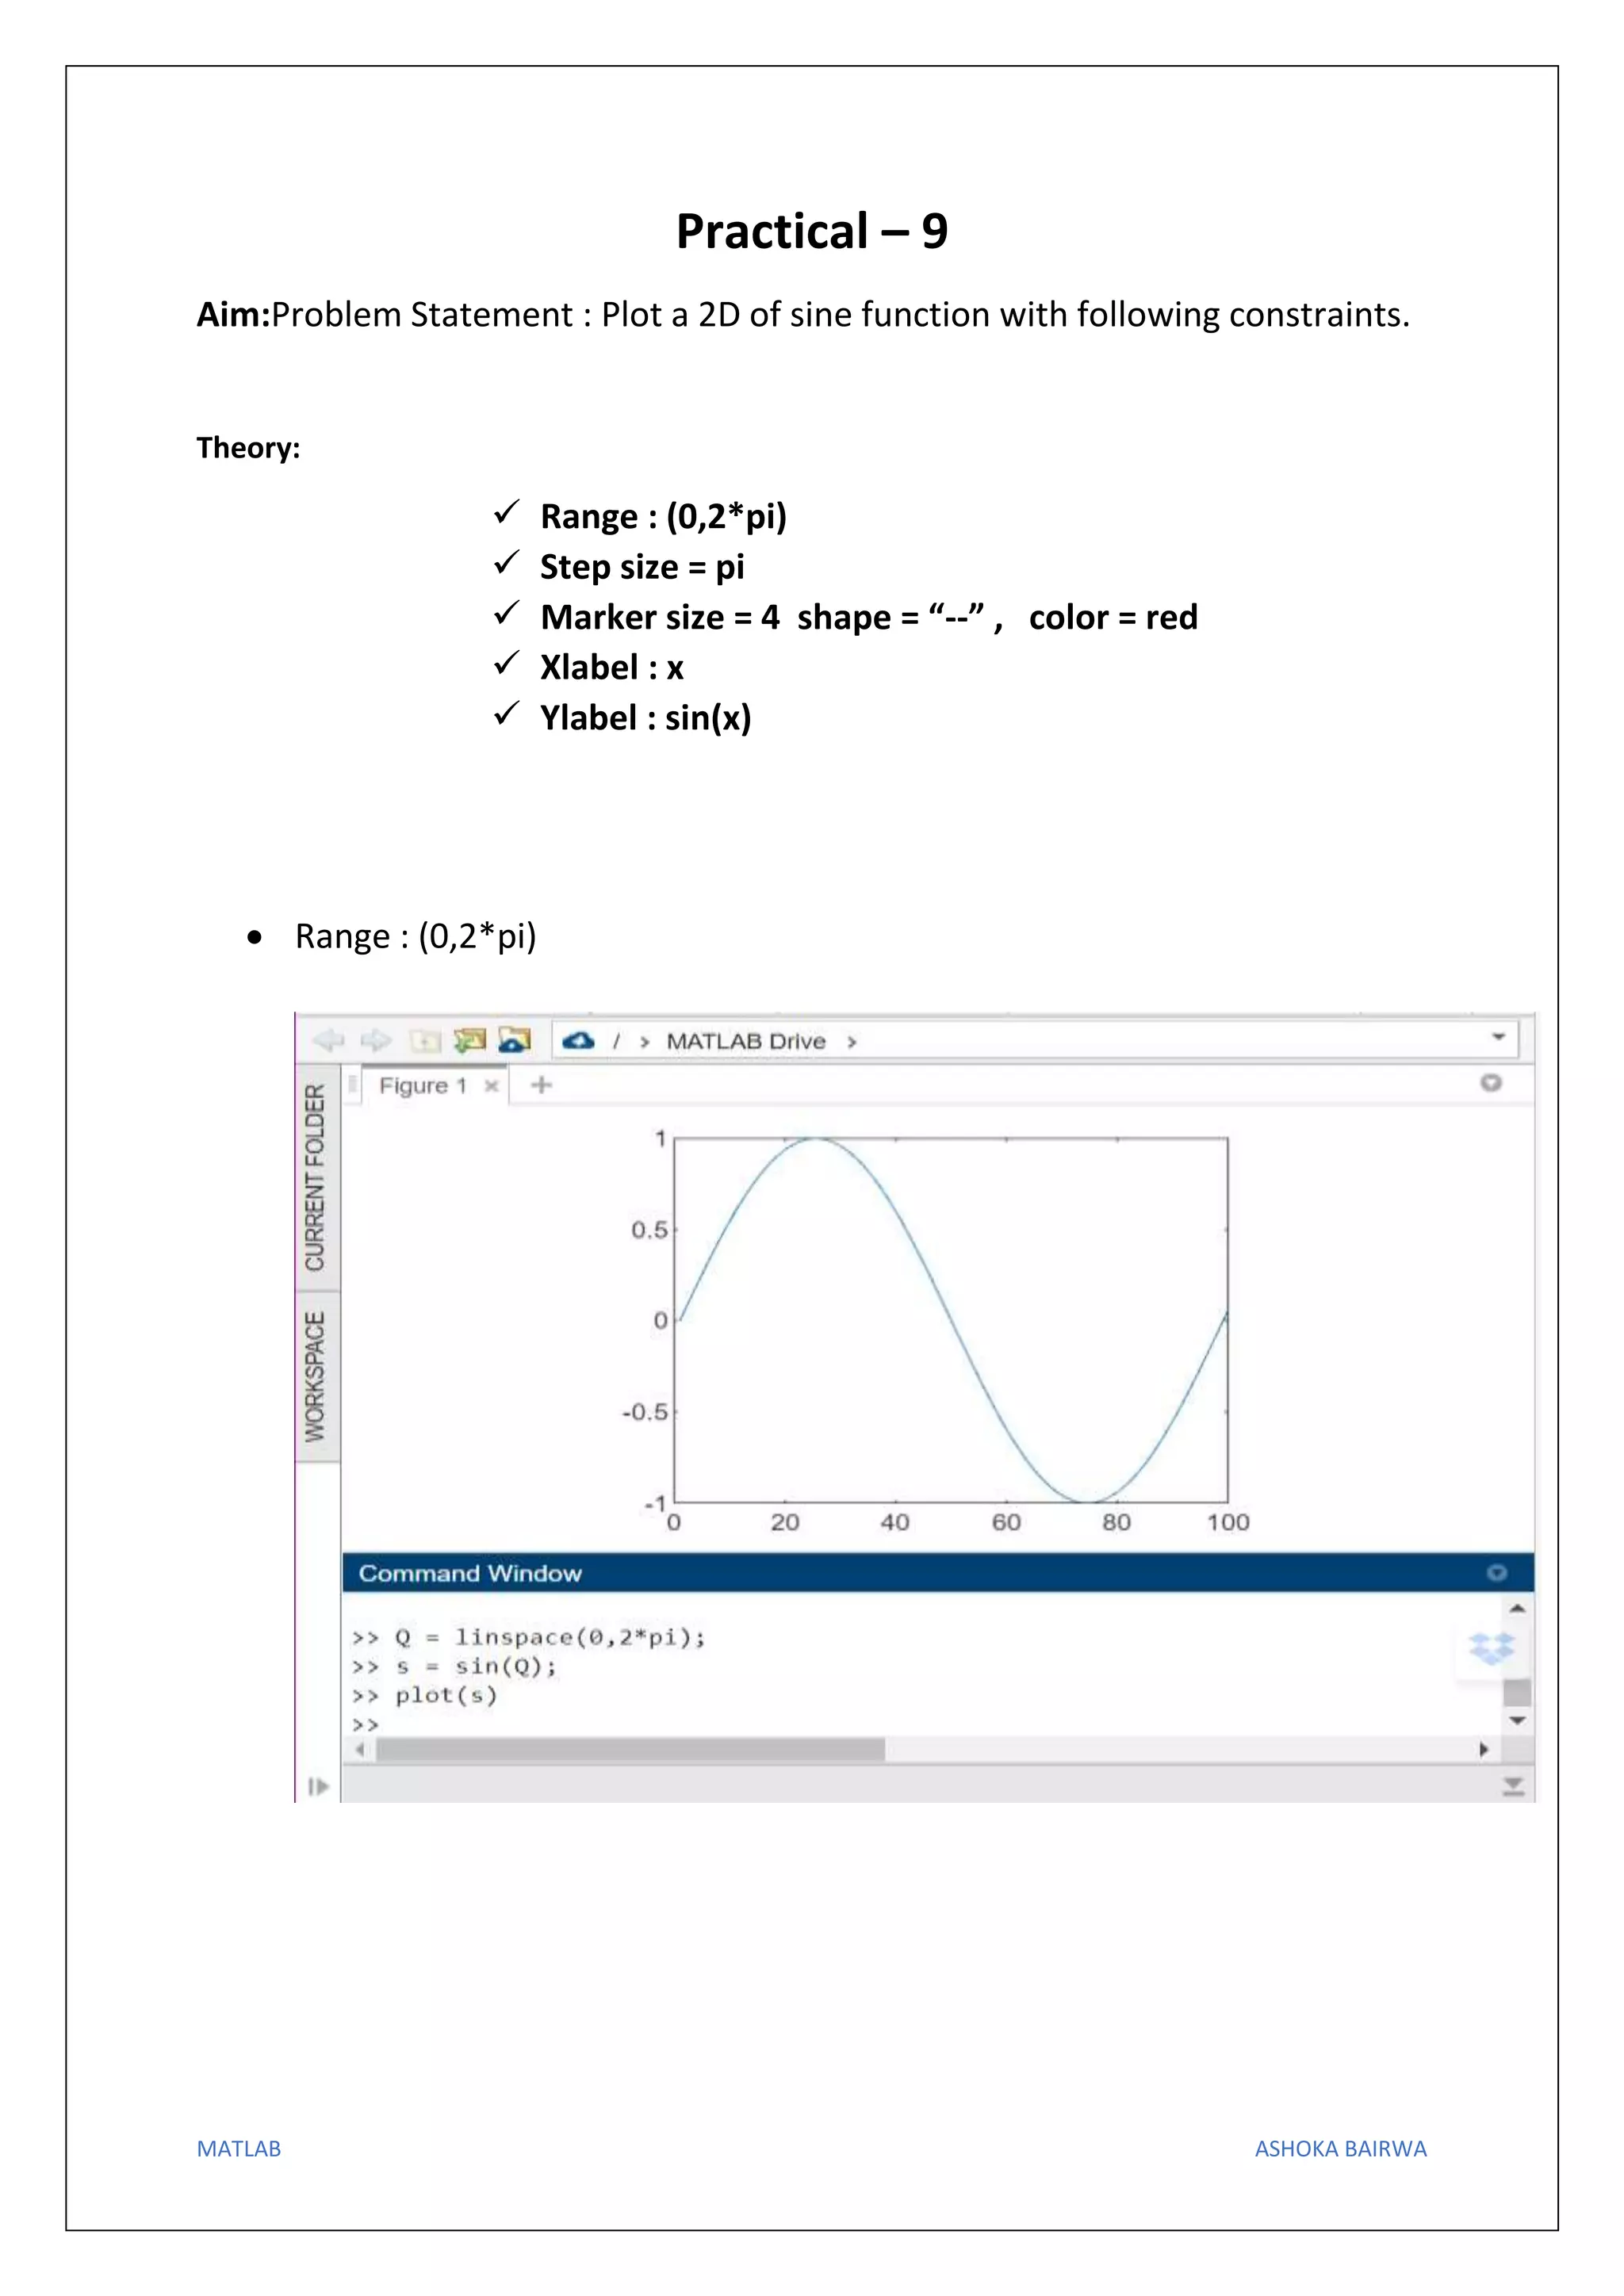

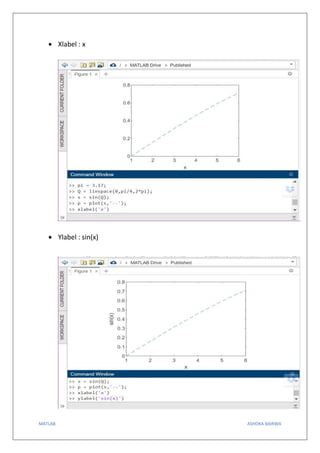

The document provides instructions for plotting a 2D sine function in MATLAB with the following constraints: the x-range is from 0 to 2π with a step size of π, the marker size is 4 with a dashed line style and red color, the x-axis label is 'x' and the y-axis label is 'sin(x)'.