This document outlines the Ontario curriculum for mathematics courses in grades 11 and 12. It discusses the importance of mathematics in secondary school programs and the goals of preparing students for their future roles in society. The curriculum is designed to engage students in meaningful learning and acquisition of mathematical concepts, skills, and processes. It emphasizes understanding mathematical ideas and developing skills in problem solving, reasoning, communication and independent learning.


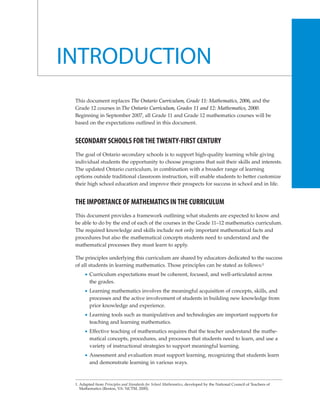
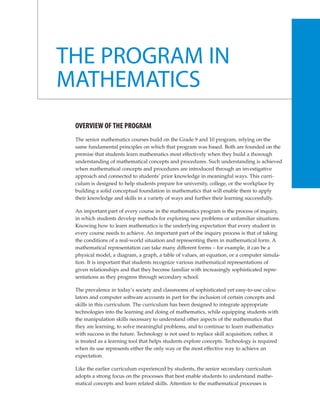

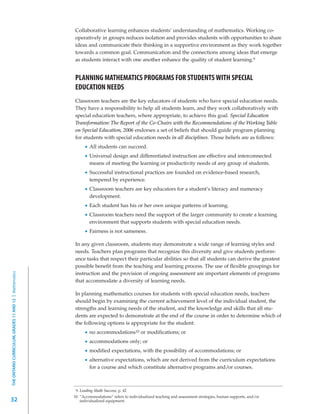
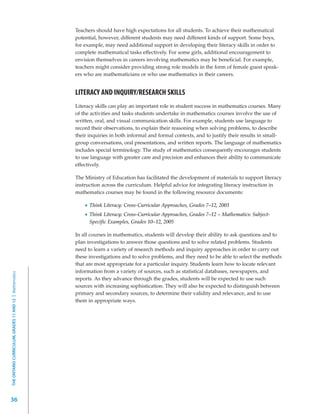


![A. CHARACTERISTICS OF FUNCTIONS
OVERALL EXPECTATIONS
By the end of this course, students will:
1.
Functions
demonstrate an understanding of functions, their representations, and their inverses, and make
connections between the algebraic and graphical representations of functions using transformations;
2. determine the zeros and the maximum or minimum of a quadratic function, and solve problems
involving quadratic functions, including problems arising from real-world applications;
3. demonstrate an understanding of equivalence as it relates to simplifying polynomial, radical, and
rational expressions.
SPECIFIC EXPECTATIONS
Sample problem: A quadratic function repre-
1. Representing Functions sents the relationship between the height
of a ball and the time elapsed since the ball
By the end of this course, students will: was thrown. What physical factors will MCR3U
1.1 explain the meaning of the term function, and restrict the domain and range of the quad-
distinguish a function from a relation that is ratic function?
not a function, through investigation of linear 1.4 relate the process of determining the inverse
and quadratic relations using a variety of repre- of a function to their understanding of
sentations (i.e., tables of values, mapping dia- reverse processes (e.g., applying inverse
grams, graphs, function machines, equations) operations)
and strategies (e.g., identifying a one-to-one
or many-to-one mapping; using the vertical- 1.5 determine the numeric or graphical represen-
line test) tation of the inverse of a linear or quadratic
function, given the numeric, graphical, or
Sample problem: Investigate, using numeric
algebraic representation of the function, and
and graphical representations, whether the
make connections, through investigation
relation x = y 2 is a function, and justify your
using a variety of tools (e.g., graphing tech-
reasoning.
nology, Mira, tracing paper), between the
1.2 represent linear and quadratic functions using graph of a function and the graph of its
function notation, given their equations, tables inverse (e.g., the graph of the inverse is the
of values, or graphs, and substitute into and reflection of the graph of the function in the
evaluate functions [e.g., evaluate f 1 , given line y = x)
2()
f(x) = 2x 2 + 3x – 1] Sample problem: Given a graph and a table of
values representing population over time,
1.3 explain the meanings of the terms domain
produce a table of values for the inverse and
and range, through investigation using numer-
graph the inverse on a new set of axes.
CHARACTERISTICS OF FUNCTIONS
ic, graphical, and algebraic representations of
the functions f(x) = x, f(x) = x 2, f(x) = √ x, 1.6 determine, through investigation, the relation-
1 ship between the domain and range of a func-
and f(x) = ; describe the domain and range of
x tion and the domain and range of the inverse
a function appropriately (e.g., for y = x 2 + 1,
relation, and determine whether or not the
the domain is the set of real numbers, and the
Sample problem: A quadratic function repre- inverse relation is a function
range is y ≥ 1); and explain any restrictions on
sents the relationship between the height
the domain and range in contexts arising from Sample problem: Given the graph of f(x) = x 2,
of a ball and the time elapsed since the ball
real-world applications graph the inverse relation. Compare the domain
was thrown. What physical factors will
and range of the function with the domain
45](https://image.slidesharecdn.com/math1112currb-100910221608-phpapp02/85/Math1112currb-47-320.jpg)
![and range of the inverse relation, and investi-
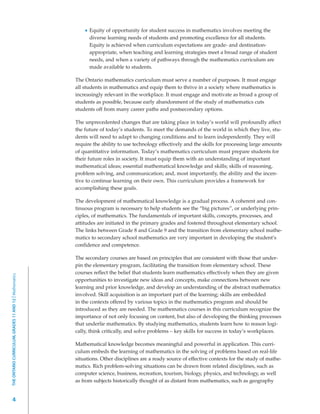
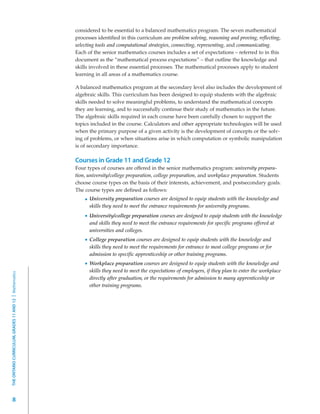
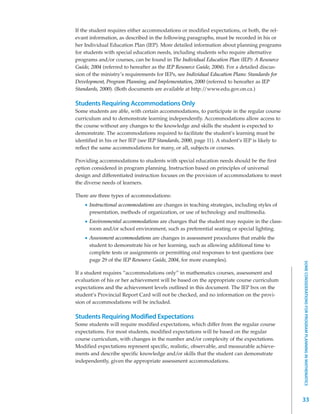
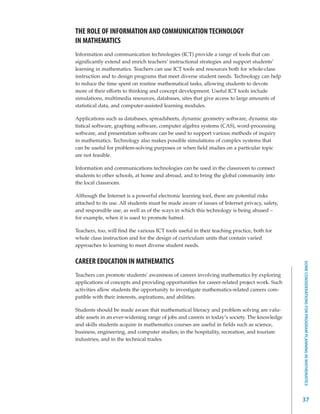
gate connections to the domain and range of 2. Solving Problems Involving
Quadratic Functions
the functions g(x) = √ x and h(x) = – √ x.
Grade 11, University Preparation
Grade 11, University Preparation
1.7 determine, using function notation when By the end of this course, students will:
appropriate, the algebraic representation of
the inverse of a linear or quadratic function, 2.1 determine the number of zeros (i.e.,
given the algebraic representation of the x-intercepts) of a quadratic function, using
function [e.g., f(x) = (x – 2)2 – 5], and make a variety of strategies (e.g., inspecting graphs;
connections, through investigation using a factoring; calculating the discriminant)
variety of tools (e.g., graphing technology, Sample problem: Investigate, using graphing
Mira, tracing paper), between the algebraic technology and algebraic techniques, the
representations of a function and its inverse transformations that affect the number of
(e.g., the inverse of a linear function involves zeros for a given quadratic function.
applying the inverse operations in the reverse
order) 2.2 determine the maximum or minimum value
of a quadratic function whose equation is
Sample problem: Given the equations of given in the form f(x) = ax 2 + bx + c, using
several linear functions, graph the functions an algebraic method (e.g., completing the
and their inverses, determine the equations square; factoring to determine the zeros and
of the inverses, and look for patterns that averaging the zeros)
connect the equation of each linear function
Sample problem: Explain how partially
with the equation of the inverse.
factoring f(x) = 3x 2 – 6x + 5 into the form
1.8 determine, through investigation using f(x) = 3x(x – 2) + 5 helps you determine the
technology, the roles of the parameters minimum of the function.
a, k, d, and c in functions of the form
2.3 solve problems involving quadratic functions
y = af (k(x – d)) + c, and describe these roles
arising from real-world applications and
in terms of transformations on the graphs
represented using function notation
of f(x) = x, f(x) = x 2 , f(x) = √ x, and
1 Sample problem: The profit, P(x), of a video
f(x) = (i.e., translations; reflections in the
x company, in thousands of dollars, is given by
axes; vertical and horizontal stretches and P(x) = – 5x 2 + 550x – 5000, where x is the
compressions to and from the x- and y-axes) amount spent on advertising, in thousands
of dollars. Determine the maximum profit
Sample problem: Investigate the graph
that the company can make, and the amounts
f(x) = 3(x – d)2 + 5 for various values of d,
spent on advertising that will result in a
using technology, and describe the effects of
profit and that will result in a profit of at
changing d in terms of a transformation.
least $4 000 000.
1.9 sketch graphs of y = af (k(x – d)) + c
2.4 determine, through investigation, the trans-
THE ONTARIO CURRICULUM, GRADES 11 AND 12 | Mathematics
by applying one or more transformations
formational relationship among the family of
to the graphs of f(x) = x, f(x) = x 2 , f(x) = √ x, quadratic functions that have the same zeros,
1
and f(x) = , and state the domain and and determine the algebraic representation of
x
range of the transformed functions a quadratic function, given the real roots of
the corresponding quadratic equation and a
Sample problem: Transform the graph of f(x)
point on the function
to sketch g(x), and state the domain and
range of each function, for the following: Sample problem: Determine the equation of
1 the quadratic function that passes through
f(x) = √ x, g(x) = √ x – 4; f(x) = ,
x (2, 5) if the roots of the corresponding
1
g(x) = – . quadratic equation are 1 + √ 5 and 1 – √ 5.
x+1
46](https://image.slidesharecdn.com/math1112currb-100910221608-phpapp02/85/Math1112currb-48-320.jpg)
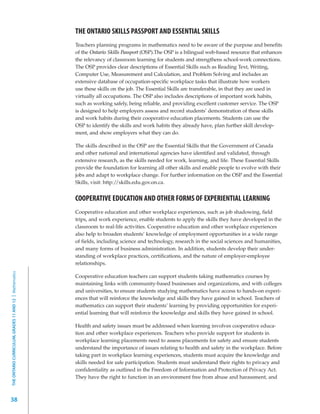
![2.5 solve problems involving the intersection of 3.2 verify, through investigation with and
a linear function and a quadratic function without technology, that √ ab = √ a x √ b,
graphically and algebraically (e.g., determine a ≥ 0, b ≥ 0, and use this relationship to
the time when two identical cylindrical water simplify radicals (e.g., √ 24) and radical
tanks contain equal volumes of water, if one expressions obtained by adding, subtracting,
tank is being filled at a constant rate and the
and multiplying [e.g., (2 + √ 6)(3 – √ 12)]
other is being emptied through a hole in the
bottom) 3.3 simplify rational expressions by adding,
Sample problem: Determine, through investi- subtracting, multiplying, and dividing, and
Functions
gation, the equations of the lines that have a state the restrictions on the variable values
slope of 2 and that intersect the quadratic Sample problem: Simplify
function f(x) = x(6 – x) once; twice; never. 2x 3
2
– , and state the
4x + 6x 2x + 3
restrictions on the variable.
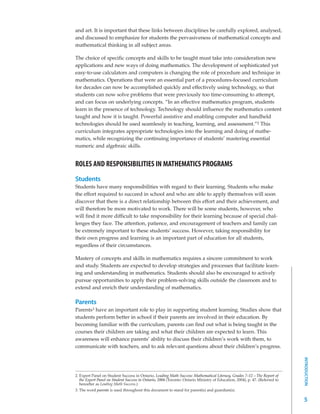
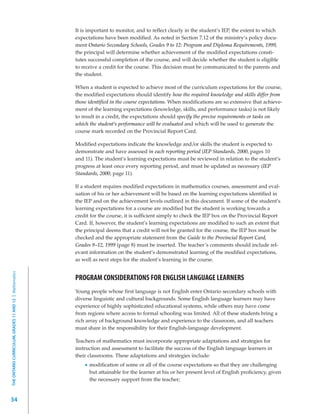
3. Determining Equivalent Algebraic
Expressions* 3.4 determine if two given algebraic expressions
are equivalent (i.e., by simplifying; by
By the end of this course, students will: substituting values)
Sample problem: Determine if the expressions
3.1 simplify polynomial expressions by adding,
2x 2 – 4x – 6
subtracting, and multiplying and 8x2 – 2x(4x – 1) – 6 are
x+1
Sample problem: Write and simplify an equivalent.
expression for the volume of a cube with
edge length 2x + 1.
MCR3U
CHARACTERISTICS OF FUNCTIONS
*The knowledge and skills described in the expectations in this section are to be introduced as needed, and applied and
consolidated, as appropriate, in solving problems throughout the course.
47](https://image.slidesharecdn.com/math1112currb-100910221608-phpapp02/85/Math1112currb-49-320.jpg)
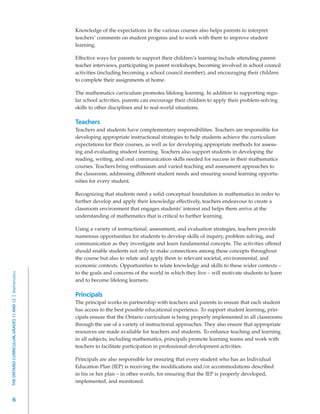
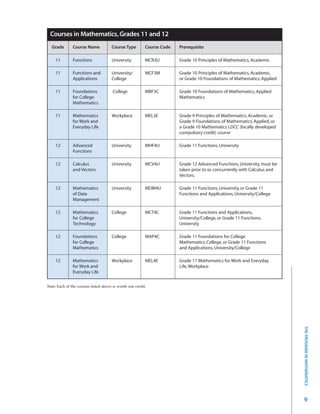
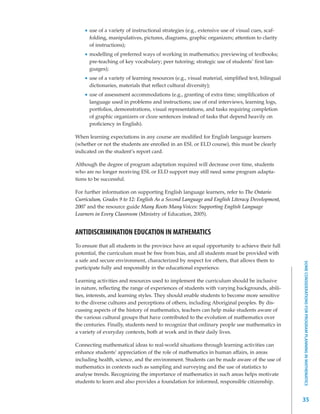
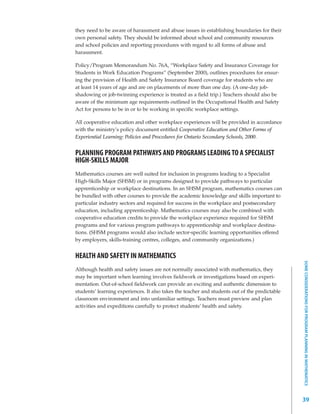
![B. EXPONENTIAL FUNCTIONS
Grade 11, University Preparation
Grade 11, University Preparation
OVERALL EXPECTATIONS
By the end of this course, students will:
1. evaluate powers with rational exponents, simplify expressions containing exponents, and describe
properties of exponential functions represented in a variety of ways;
2. make connections between the numeric, graphical, and algebraic representations of exponential
functions;
3. identify and represent exponential functions, and solve problems involving exponential functions,
including problems arising from real-world applications.
SPECIFIC EXPECTATIONS
1.4 determine, through investigation, and
1. Representing Exponential Functions describe key properties relating to domain
and range, intercepts, increasing/decreasing
By the end of this course, students will: intervals, and asymptotes (e.g., the domain
1.1 graph, with and without technology, an expo- is the set of real numbers; the range is the
nential relation, given its equation in the form set of positive real numbers; the function
y = a x (a > 0, a ≠ 1), define this relation as the either increases or decreases throughout its
function f(x) = ax , and explain why it is a domain) for exponential functions represented
function in a variety of ways [e.g., tables of values,
mapping diagrams, graphs, equations of the
1.2 determine, through investigation using a form f(x) = a x (a > 0, a ≠ 1), function
variety of tools (e.g., calculator, paper and machines]
pencil, graphing technology) and strategies
Sample problem: Graph f(x) = 2 x, g(x) = 3 x,
(e.g., patterning; finding values from a graph;
and h(x) = 0.5 x on the same set of axes. Make
interpreting the exponent laws), the value of
m comparisons between the graphs, and explain
a power with a rational exponent (i.e., x n , the relationship between the y-intercepts.
where x > 0 and m and n are integers)
THE ONTARIO CURRICULUM, GRADES 11 AND 12 | Mathematics
Sample problem: The exponent laws suggest
1 1 2. Connecting Graphs and Equations
that 4 2 x 4 2 = 41. What value would you of Exponential Functions
1
assign to 42 ? What value would you assign
1
3
to 27 ? Explain your reasoning. Extend your By the end of this course, students will:
reasoning to make a generalization about the 2.1 distinguish exponential functions from linear
1
meaning of x n, where x > 0 and n is a natural and quadratic functions by making compar-
number. isons in a variety of ways (e.g., comparing
rates of change using finite differences in
1.3 simplify algebraic expressions containing tables of values; identifying a constant ratio in
integer and rational exponents [e.g., a table of values; inspecting graphs; compar-
1 1
( )
(x 3 ) ÷ x 2 , (x 6 y 3 ) 3 ], and evaluate numeric ing equations)
expressions containing integer and rational Sample problem: Explain in a variety of ways
exponents and rational bases how you can distinguish the exponential
1 function f(x) = 2 x from the quadratic function
[e.g., 2 – 3 , (– 6)3 , 4 2 , 1.01120 ] f(x) = x 2 and the linear function f(x) = 2x.
48](https://image.slidesharecdn.com/math1112currb-100910221608-phpapp02/85/Math1112currb-50-320.jpg)
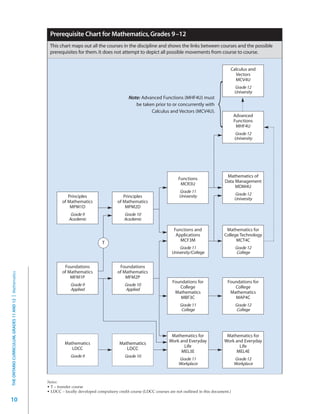
![2.2 determine, through investigation using tech- Sample problem: Collect data and graph the
nology, the roles of the parameters a, k, d, and cooling curve representing the relationship
c in functions of the form y = af (k(x – d)) + c, between temperature and time for hot water
and describe these roles in terms of transfor- cooling in a porcelain mug. Predict the shape
mations on the graph of f(x) = ax (a > 0, a ≠ 1) of the cooling curve when hot water cools in
(i.e., translations; reflections in the axes; verti- an insulated mug. Test your prediction.
cal and horizontal stretches and compressions
to and from the x- and y-axes)
3.2 identify exponential functions, including
those that arise from real-world applications
Sample problem: Investigate the graph of
Functions
involving growth and decay (e.g., radioactive
f(x) = 3 x – d – 5 for various values of d, decay, population growth, cooling rates,
using technology, and describe the effects pressure in a leaking tire), given various
of changing d in terms of a transformation. representations (i.e., tables of values, graphs,
2.3 sketch graphs of y = af (k(x – d)) + c by equations), and explain any restrictions that
applying one or more transformations the context places on the domain and range
to the graph of f(x) = ax (a > 0, a ≠ 1), (e.g., ambient temperature limits the range
and state the domain and range of the for a cooling curve)
transformed functions Sample problem: Using data from Statistics
Sample problem: Transform the graph of Canada, investigate to determine if there was
a period of time over which the increase in
f(x) = 3 x to sketch g(x) = 3 – (x + 1) – 2, and state
Canada’s national debt could be modelled
the domain and range of each function.
using an exponential function.
2.4 determine, through investigation using techno-
3.3 solve problems using given graphs or
logy, that the equation of a given exponential
equations of exponential functions arising
function can be expressed using different bases MCR3U
from a variety of real-world applications
[e.g., f(x) = 9 x can be expressed as f(x) = 32x ],
(e.g., radioactive decay, population growth,
and explain the connections between the
height of a bouncing ball, compound interest)
equivalent forms in a variety of ways (e.g.,
by interpreting the graphs or by substituting
comparing graphs; using transformations;
values for the exponent into the equations
using the exponent laws)
Sample problem: The temperature of a
2.5 represent an exponential function with an cooling liquid over time can be modelled
equation, given its graph or its properties by the exponential function
x
Sample problem: Write two equations to rep- 1 30
resent the same exponential function with a
T(x) = 60 ( )
2
+ 20, where T(x) is the
y-intercept of 5 and an asymptote at y = 3. temperature, in degrees Celsius, and x is the
Investigate whether other exponential func- elapsed time, in minutes. Graph the function
tions have the same properties. Use transfor- and determine how long it takes for the tem-
mations to explain your observations. perature to reach 28ºC.
3. Solving Problems Involving
Exponential Functions
By the end of this course, students will:
3.1 collect data that can be modelled as an expo-
nential function, through investigation with
and without technology, from primary sources,
using a variety of tools (e.g., concrete materials
EXPONENTIAL FUNCTIONS
such as number cubes, coins; measurement
tools such as electronic probes), or from
secondary sources (e.g., websites such as
Statistics Canada, E-STAT), and graph
the data
49](https://image.slidesharecdn.com/math1112currb-100910221608-phpapp02/85/Math1112currb-51-320.jpg)
![C. DISCRETE FUNCTIONS
Grade 11, University Preparation
Grade 11, University Preparation
OVERALL EXPECTATIONS
By the end of this course, students will:
1. demonstrate an understanding of recursive sequences, represent recursive sequences in a variety of
ways, and make connections to Pascal’s triangle;
2. demonstrate an understanding of the relationships involved in arithmetic and geometric sequences
and series, and solve related problems;
3. make connections between sequences, series, and financial applications, and solve problems involving
compound interest and ordinary annuities.
SPECIFIC EXPECTATIONS
1 2 3
1. Representing Sequences f(n) = 2 n , or as tn = 2 n , or represent , , ,
2 3 4
4 5 6 1 1
By the end of this course, students will: , , , … as t1 = ; tn = t n – 1 + ,
5 6 7 2 n(n + 1)
n n
1.1 make connections between sequences and as f(n) = , or as tn = , where n
n+1 n+1
discrete functions, represent sequences using
is a natural number], and describe the infor-
function notation, and distinguish between a
mation that can be obtained by inspecting
discrete function and a continuous function
each representation (e.g., function notation
[e.g., f(x) = 2x, where the domain is the set of
or the formula for the nth term may show
natural numbers, is a discrete linear function
the type of function; a recursion formula
and its graph is a set of equally spaced points;
shows the relationship between terms)
f(x) = 2x, where the domain is the set of real
numbers, is a continuous linear function and Sample problem: Represent the sequence
its graph is a straight line] 0, 3, 8, 15, 24, 35, … using a recursion
formula, function notation, and the formula
1.2 determine and describe (e.g., in words; using for the nth term. Explain why this sequence
flow charts) a recursive procedure for gen- can be described as a discrete quadratic
erating a sequence, given the initial terms function. Explore how to identify a sequence
THE ONTARIO CURRICULUM, GRADES 11 AND 12 | Mathematics
(e.g., 1, 3, 6, 10, 15, 21, …), and represent as a discrete quadratic function by inspecting
sequences as discrete functions in a variety the recursion formula.
of ways (e.g., tables of values, graphs)
1.5 determine, through investigation, recursive
1.3 connect the formula for the nth term of a patterns in the Fibonacci sequence, in related
sequence to the representation in function sequences, and in Pascal’s triangle, and
notation, and write terms of a sequence given represent the patterns in a variety of ways
one of these representations or a recursion (e.g., tables of values, algebraic notation)
formula
1.6 determine, through investigation, and
1.4 represent a sequence algebraically using a describe the relationship between Pascal’s
recursion formula, function notation, or the triangle and the expansion of binomials,
formula for the nth term [e.g., represent 2, 4, and apply the relationship to expand bino-
8, 16, 32, 64, … as t1 = 2; tn = 2t n – 1 , as mials raised to whole-number exponents
[e.g., (1 + x)4 , (2x – 1)5 , (2x – y)6 , (x2 + 1)5 ]
50](https://image.slidesharecdn.com/math1112currb-100910221608-phpapp02/85/Math1112currb-52-320.jpg)
![2. Investigating Arithmetic and 3. Solving Problems Involving
Geometric Sequences and Series Financial Applications
By the end of this course, students will: By the end of this course, students will:
2.1 identify sequences as arithmetic, geometric, 3.1 make and describe connections between
or neither, given a numeric or algebraic simple interest, arithmetic sequences, and
representation linear growth, through investigation with
Functions
technology (e.g., use a spreadsheet or
2.2 determine the formula for the general
graphing calculator to make simple interest
term of an arithmetic sequence [i.e.,
calculations, determine first differences in
tn = a + (n – 1)d ] or geometric sequence
the amounts over time, and graph amount
(i.e., tn = ar n – 1), through investigation
versus time)
using a variety of tools (e.g., linking cubes,
algebra tiles, diagrams, calculators) and Sample problem: Describe an investment
strategies (e.g., patterning; connecting the that could be represented by the function
steps in a numerical example to the steps in f(x) = 500(1 + 0.05x).
the algebraic development), and apply the 3.2 make and describe connections between
formula to calculate any term in a sequence compound interest, geometric sequences,
2.3 determine the formula for the sum of an and exponential growth, through investiga-
arithmetic or geometric series, through inves- tion with technology (e.g., use a spreadsheet
tigation using a variety of tools (e.g., linking to make compound interest calculations,
cubes, algebra tiles, diagrams, calculators) determine finite differences in the amounts
and strategies (e.g., patterning; connecting over time, and graph amount versus time)
the steps in a numerical example to the steps MCR3U
Sample problem: Describe an investment
in the algebraic development), and apply that could be represented by the function
the formula to calculate the sum of a given f(x) = 500(1.05)x .
number of consecutive terms
3.3 solve problems, using a scientific calculator,
Sample problem: Given the following array
that involve the calculation of the amount,
built with grey and white connecting cubes,
A (also referred to as future value, FV ),
investigate how different ways of determin-
the principal, P (also referred to as
ing the total number of grey cubes can be
present value, PV ), or the interest rate
used to evaluate the sum of the arithmetic
per compounding period, i, using the
series 1 + 2 + 3 + 4 + 5. Extend the series,
compound interest formula in the form
use patterning to make generalizations for
A = P(1 + i) n [or FV = PV(1 + i) n ]
finding the sum, and test the generalizations
for other arithmetic series. Sample problem: Two investments are
available, one at 6% compounded annually
and the other at 6% compounded monthly.
Investigate graphically the growth of each
investment, and determine the interest
earned from depositing $1000 in each
investment for 10 years.
3.4 determine, through investigation using
technology (e.g., scientific calculator, the
TVM Solver on a graphing calculator, online
tools), the number of compounding periods, n,
using the compound interest formula in the
form A = P(1 + i) n [or FV = PV(1 + i) n ];
describe strategies (e.g., guessing and check-
DISCRETE FUNCTIONS
2.4 solve problems involving arithmetic and geo-
metric sequences and series, including those ing; using the power of a power rule for
arising from real-world applications exponents; using graphs) for calculating this
number; and solve related problems
51](https://image.slidesharecdn.com/math1112currb-100910221608-phpapp02/85/Math1112currb-53-320.jpg)


![A. QUADRATIC FUNCTIONS
Functions and Applications
OVERALL EXPECTATIONS
By the end of this course, students will:
1. expand and simplify quadratic expressions, solve quadratic equations, and relate the roots of a
quadratic equation to the corresponding graph;
2. demonstrate an understanding of functions, and make connections between the numeric, graphical,
and algebraic representations of quadratic functions;
3. solve problems involving quadratic functions, including problems arising from real-world applications.
SPECIFIC EXPECTATIONS
Sample problem: The profit, P, of a video
1. Solving Quadratic Equations company, in thousands of dollars, is given
by P = – 5x 2 + 550x – 5000, where x is the
By the end of this course, students will: amount spent on advertising, in thousands of
dollars. Determine, by factoring and by
MCF3M
1.1 pose problems involving quadratic relations
arising from real-world applications and graphing, the amount spent on advertising
represented by tables of values and graphs, that will result in a profit of $0. Describe the
and solve these and other such problems (e.g., connection between the two strategies.
“From the graph of the height of a ball versus 1.6 explore the algebraic development of the
time, can you tell me how high the ball was quadratic formula (e.g., given the algebraic
thrown and the time when it hit the ground?”) development, connect the steps to a numeric
1.2 represent situations (e.g., the area of a picture example; follow a demonstration of the
frame of variable width) using quadratic algebraic development, with technology,
expressions in one variable, and expand such as computer algebra systems, or without
and simplify quadratic expressions in one technology [student reproduction of the
variable [e.g., 2x(x + 4) – (x + 3)2 ]* development of the general case is not
required]), and apply the formula to solve
1.3 factor quadratic expressions in one variable, quadratic equations, using technology
including those for which a ≠ 1 (e.g.,
3x 2 + 13x – 10), differences of squares 1.7 relate the real roots of a quadratic equation to
(e.g., 4x 2 – 25), and perfect square trinomials the x-intercepts of the corresponding graph,
(e.g., 9x 2 + 24x + 16), by selecting and and connect the number of real roots to the
applying an appropriate strategy* value of the discriminant (e.g., there are no
real roots and no x-intercepts if b2 – 4ac < 0)
Sample problem: Factor 2x2 – 12x + 10.
1.8 determine the real roots of a variety of quad-
1.4 solve quadratic equations by selecting and ratic equations (e.g., 100x 2 = 115x + 35), and
applying a factoring strategy describe the advantages and disadvantages of
1.5 determine, through investigation, and describe each strategy (i.e., graphing; factoring; using
the quadratic formula)
QUADRATIC FUNCTIONS
the connection between the factors used
in solving a quadratic equation and the Sample problem: Generate 10 quadratic equa-
x-intercepts of the graph of the corresponding tions by randomly selecting integer values
quadratic relation for a, b, and c in ax 2 + bx + c = 0. Solve the
*The knowledge and skills described in this expectation may initially require the use of a variety of learning tools (e.g., computer
algebra systems, algebra tiles, grid paper).
59](https://image.slidesharecdn.com/math1112currb-100910221608-phpapp02/85/Math1112currb-61-320.jpg)
![Grade 11, University/College Preparation
equations using the quadratic formula. How reflections in the x-axis; vertical stretches and
Grade 11, University/CollegePreparation
many of the equations could you solve by compressions to and from the x-axis)
factoring?
Sample problem: Investigate the graph
f(x) = 3(x – h)2 + 5 for various values
of h, using technology, and describe the
2. Connecting Graphs and Equations
effects of changing h in terms of a
of Quadratic Functions
transformation.
By the end of this course, students will: 2.6 sketch graphs of g(x) = a(x – h)2 + k by
applying one or more transformations to
2.1 explain the meaning of the term function, and the graph of f(x) = x 2
distinguish a function from a relation that is
not a function, through investigation of linear Sample problem: Transform the graph of
and quadratic relations using a variety of f(x) = x 2 to sketch the graphs of g(x) = x 2 – 4
representations (i.e., tables of values, mapping and h(x) = – 2(x + 1)2 .
diagrams, graphs, function machines, equa-
tions) and strategies (e.g., using the vertical-
2.7 express the equation of a quadratic function
in the standard form f(x) = ax 2 + bx + c, given
line test)
the vertex form f(x) = a(x – h)2 + k, and verify,
Sample problem: Investigate, using numeric using graphing technology, that these forms
and graphical representations, whether the are equivalent representations
relation x = y 2 is a function, and justify
Sample problem: Given the vertex form
your reasoning.
f(x) = 3(x – 1)2 + 4, express the equation in
2.2 substitute into and evaluate linear and standard form. Use technology to compare
quadratic functions represented using the graphs of these two forms of the equation.
1
function notation [e.g., evaluate f
2()
, given 2.8 express the equation of a quadratic function
f(x) = 2x 2 + 3x – 1], including functions in the vertex form f(x) = a(x – h)2 + k, given
arising from real-world applications the standard form f(x) = ax 2 + bx + c, by
Sample problem: The relationship between completing the square (e.g., using algebra
the selling price of a sleeping bag, s dollars, tiles or diagrams; algebraically), including
and the revenue at that selling price, b
cases where is a simple rational number
a
r(s) dollars, is represented by the function
(e.g., 1 , 0.75), and verify, using graphing
r (s) = –10s 2 + 1500s. Evaluate, interpret, and 2
compare r (29.95), r (60.00), r (75.00), r(90.00), technology, that these forms are equivalent
and r (130.00). representations
2.3 explain the meanings of the terms domain and 2.9 sketch graphs of quadratic functions in the
range, through investigation using numeric, factored form f(x) = a(x – r )(x – s) by using
graphical, and algebraic representations of lin- the x-intercepts to determine the vertex
THE ONTARIO CURRICULUM, GRADES 11 AND 12 | Mathematics
ear and quadratic functions, and describe the 2.10 describe the information (e.g., maximum,
domain and range of a function appropriately intercepts) that can be obtained by inspecting
(e.g., for y = x 2 + 1, the domain is the set of the standard form f(x) = ax 2 + bx + c, the
real numbers, and the range is y ≥ 1) vertex form f(x) = a(x – h)2 + k, and the
2.4 explain any restrictions on the domain and factored form f(x) = a(x – r)(x – s) of a
the range of a quadratic function in contexts quadratic function
arising from real-world applications 2.11 sketch the graph of a quadratic function
Sample problem: A quadratic function repre- whose equation is given in the standard
sents the relationship between the height of a form f(x) = ax 2 + bx + c by using a suitable
ball and the time elapsed since the ball was strategy (e.g., completing the square and
thrown. What physical factors will restrict the finding the vertex; factoring, if possible, to
domain and range of the quadratic function? locate the x-intercepts), and identify the key
features of the graph (e.g., the vertex, the
2.5 determine, through investigation using x- and y-intercepts, the equation of the axis
technology, the roles of a, h, and k in quadratic of symmetry, the intervals where the function
functions of the form f(x) = a(x – h)2 + k, and is positive or negative, the intervals where
describe these roles in terms of transforma- the function is increasing or decreasing)
tions on the graph of f(x) = x 2 (i.e., translations;
60](https://image.slidesharecdn.com/math1112currb-100910221608-phpapp02/85/Math1112currb-62-320.jpg)
![B. EXPONENTIAL FUNCTIONS
Grade 11, University/College Preparation
Grade 11, University/CollegePreparation
OVERALL EXPECTATIONS
By the end of this course, students will:
1. simplify and evaluate numerical expressions involving exponents, and make connections between
the numeric, graphical, and algebraic representations of exponential functions;
2. identify and represent exponential functions, and solve problems involving exponential functions,
including problems arising from real-world applications;
3. demonstrate an understanding of compound interest and annuities, and solve related problems.
SPECIFIC EXPECTATIONS
and asymptotes (e.g., the domain is the set of
1. Connecting Graphs and Equations real numbers; the range is the set of positive
of Exponential Functions real numbers; the function either increases
or decreases throughout its domain) for
By the end of this course, students will: exponential functions represented in a
variety of ways [e.g., tables of values, mapping
1.1 determine, through investigation using a
diagrams, graphs, equations of the form
variety of tools (e.g., calculator, paper and
f(x) = a x (a > 0, a ≠ 1), function machines]
pencil, graphing technology) and strategies
(e.g., patterning; finding values from a graph; Sample problem: Graph f(x) = 2 x , g(x) = 3 x ,
interpreting the exponent laws), the value and h(x) = 0.5 x on the same set of axes.
m
of a power with a rational exponent (i.e., x n , Make comparisons between the graphs,
where x > 0 and m and n are integers) and explain the relationship between the
y-intercepts.
Sample problem: The exponent laws suggest
1 1
1.5 determine, through investigation (e.g., by
that 4 2 x 4 2 = 41. What value would you patterning with and without a calculator),
1
assign to 42 ? What value would you assign the exponent rules for multiplying and
1
3
to 27 ? Explain your reasoning. Extend your dividing numeric expressions involving
3 2
exponents [e.g., 1 x 1 ], and the
() ()
THE ONTARIO CURRICULUM, GRADES 11 AND 12 | Mathematics
reasoning to make a generalization about the
1 2 2
meaning of x n , where x > 0 and n is a natural exponent rule for simplifying numerical
number. expressions involving a power of a power
2
1.2 evaluate, with and without technology,
numerical expressions containing integer
( )
[e.g., 53 ], and use the rules to simplify
numerical expressions containing integer
and rational exponents and rational bases exponents [e.g., (23 )(25 ) = 28 ]
1
[e.g., 2 – 3 , (– 6)3 , 4 2 , 1.01120 ] 1.6 distinguish exponential functions from
1.3 graph, with and without technology, an expo- linear and quadratic functions by making
nential relation, given its equation in the form comparisons in a variety of ways (e.g.,
y = a x (a > 0, a ≠ 1), define this relation as the comparing rates of change using finite
function f(x) = a x , and explain why it is a differences in tables of values; identifying a
function constant ratio in a table of values; inspecting
graphs; comparing equations), within the
1.4 determine, through investigation, and describe same context when possible (e.g., simple
key properties relating to domain and range, interest and compound interest, population
intercepts, increasing/decreasing intervals, growth)
62](https://image.slidesharecdn.com/math1112currb-100910221608-phpapp02/85/Math1112currb-64-320.jpg)
![Sample problem: Explain in a variety of
ways how you can distinguish the exponen- 3. Solving Financial Problems
tial function f(x) = 2x from the quadratic Involving Exponential Functions
function f(x) = x 2 and the linear function
f (x) = 2x. By the end of this course, students will:
Functions and Applications
3.1 compare, using a table of values and graphs,
2. Solving Problems Involving the simple and compound interest earned for
Exponential Functions a given principal (i.e., investment) and a fixed
interest rate over time
By the end of this course, students will: Sample problem: Compare, using tables of
values and graphs, the amounts after each of
2.1 collect data that can be modelled as an the first five years for a $1000 investment at
exponential function, through investigation 5% simple interest per annum and a $1000
with and without technology, from primary investment at 5% interest per annum, com-
sources, using a variety of tools (e.g., concrete pounded annually.
materials such as number cubes, coins; meas-
urement tools such as electronic probes), or 3.2 solve problems, using a scientific calculator,
from secondary sources (e.g., websites such that involve the calculation of the amount, A
as Statistics Canada, E-STAT), and graph (also referred to as future value, FV ), and the
the data principal, P (also referred to as present value,
PV ), using the compound interest formula in
Sample problem: Collect data and graph the the form A = P(1 + i) n [or FV = PV (1 + i) n ]
cooling curve representing the relationship
between temperature and time for hot water Sample problem: Calculate the amount if
cooling in a porcelain mug. Predict the shape $1000 is invested for three years at 6% per MCF3M
of the cooling curve when hot water cools in annum, compounded quarterly.
an insulated mug. Test your prediction.
3.3 determine, through investigation (e.g., using
2.2 identify exponential functions, including spreadsheets and graphs), that compound
those that arise from real-world applications interest is an example of exponential
involving growth and decay (e.g., radioactive growth [e.g., the formulas for compound
decay, population growth, cooling rates, interest, A = P(1 + i) n , and present value,
pressure in a leaking tire), given various PV = A(1 + i) – n , are exponential functions,
representations (i.e., tables of values, graphs, where the number of compounding periods,
equations), and explain any restrictions that n, varies]
the context places on the domain and range Sample problem: Describe an investment
(e.g., ambient temperature limits the range that could be represented by the function
for a cooling curve) f(x) = 500(1.01) x .
2.3 solve problems using given graphs or 3.4 solve problems, using a TVM Solver on a
equations of exponential functions arising graphing calculator or on a website, that
from a variety of real-world applications involve the calculation of the interest rate
(e.g., radioactive decay, population growth, per compounding period, i, or the number
height of a bouncing ball, compound interest) of compounding periods, n, in the
by interpreting the graphs or by substituting compound interest formula A = P(1 + i) n
values for the exponent into the equations [or FV = PV(1 + i) n ]
Sample problem: The temperature of a Sample problem: Use the TVM Solver in a
cooling liquid over time can be modelled by graphing calculator to determine the time it
x
1 30
the exponential function T(x) = 60 ( )
2
+ 20, takes to double an investment in an account
that pays interest of 4% per annum, com-
EXPONENTIAL FUNCTIONS
where T(x) is the temperature, in degrees pounded semi-annually.
Celsius, and x is the elapsed time, in minutes.
Graph the function and determine how long it 3.5 explain the meaning of the term annuity,
takes for the temperature to reach 28ºC. through investigation of numeric and
graphical representations using technology
63](https://image.slidesharecdn.com/math1112currb-100910221608-phpapp02/85/Math1112currb-65-320.jpg)


![A. MATHEMATICAL MODELS
Foundations for College Mathematics
OVERALL EXPECTATIONS
By the end of this course, students will:
1. make connections between the numeric, graphical, and algebraic representations of quadratic
relations, and use the connections to solve problems;
2. demonstrate an understanding of exponents, and make connections between the numeric, graphical,
and algebraic representations of exponential relations;
3. describe and represent exponential relations, and solve problems involving exponential relations
arising from real-world applications.
SPECIFIC EXPECTATIONS
1.4 sketch graphs of quadratic relations repre-
1. Connecting Graphs and Equations sented by the equation y = a(x – h)2 + k (e.g.,
of Quadratic Relations using the vertex and at least one point on
each side of the vertex; applying one or more MBF3C
By the end of this course, students will: transformations to the graph of y = x 2 )
1.1 construct tables of values and graph quadra- 1.5 expand and simplify quadratic expressions in
tic relations arising from real-world applica- one variable involving multiplying binomials
tions (e.g., dropping a ball from a given 1
height; varying the edge length of a cube
[e.g.,( 2 )
x + 1 (3x – 2)] or squaring a binomial
and observing the effect on the surface area [e.g., 5(3x – 1)2 ], using a variety of tools (e.g.,
of the cube) paper and pencil, algebra tiles, computer
algebra systems)
1.2 determine and interpret meaningful values
of the variables, given a graph of a quadratic 1.6 express the equation of a quadratic relation in
relation arising from a real-world application the standard form y = ax 2 + bx + c, given the
vertex form y = a(x – h)2 + k, and verify, using
Sample problem: Under certain conditions,
graphing technology, that these forms are
there is a quadratic relation between the
equivalent representations
profit of a manufacturing company and the
number of items it produces. Explain how Sample problem: Given the vertex form
you could interpret a graph of the relation y = 3(x – 1)2 + 4, express the equation in
to determine the numbers of items produced standard form. Use technology to compare
for which the company makes a profit and to the graphs of these two forms of the
determine the maximum profit the company equation.
can make.
1.7 factor trinomials of the form ax 2 + bx + c,
1.3 determine, through investigation using where a = 1 or where a is the common factor,
technology, the roles of a, h, and k in quadratic by various methods
relations of the form y = a(x – h)2 + k, and
1.8 determine, through investigation, and
describe these roles in terms of transforma-
MATHEMATICAL MODELS
describe the connection between the factors
tions on the graph of y = x 2 (i.e., translations;
of a quadratic expression and the x-intercepts
reflections in the x-axis; vertical stretches and
of the graph of the corresponding quadratic
compressions to and from the x-axis)
relation
Sample problem: Investigate the graph
Sample problem: Investigate the relationship
y = 3(x – h)2 + 5 for various values of h,
between the factored form of 3x 2 + 15x + 12
using technology, and describe the effects of
and the x-intercepts of y = 3x 2 + 15x + 12.
changing h in terms of a transformation.
69](https://image.slidesharecdn.com/math1112currb-100910221608-phpapp02/85/Math1112currb-71-320.jpg)
![1.9 solve problems, using an appropriate strategy Sample problem: Explain in a variety of ways
(i.e., factoring, graphing), given equations of how you can distinguish exponential growth
quadratic relations, including those that arise represented by y = 2 x from quadratic growth
from real-world applications (e.g., break-even represented by y = x 2 and linear growth rep-
Grade 11, College Preparation
Grade 11, College Preparation
point) resented by y = 2x.
Sample problem: On planet X, the height,
h metres, of an object fired upward from the
3. Solving Problems Involving
ground at 48 m/s is described by the equation
h = 48t – 16t 2 , where t seconds is the time
Exponential Relations
since the object was fired upward. Deter-
mine the maximum height of the object, the By the end of this course, students will:
times at which the object is 32 m above the 3.1 collect data that can be modelled as an
ground, and the time at which the object hits exponential relation, through investigation
the ground. with and without technology, from primary
sources, using a variety of tools (e.g., concrete
materials such as number cubes, coins; meas-
2. Connecting Graphs and Equations urement tools such as electronic probes), or
of Exponential Relations from secondary sources (e.g., websites such
as Statistics Canada, E-STAT), and graph
By the end of this course, students will: the data
2.1 determine, through investigation using a Sample problem: Collect data and graph the
variety of tools and strategies (e.g., graphing cooling curve representing the relationship
with technology; looking for patterns in tables between temperature and time for hot water
of values), and describe the meaning of nega- cooling in a porcelain mug. Predict the shape
tive exponents and of zero as an exponent of the cooling curve when hot water cools in
an insulated mug. Test your prediction.
2.2 evaluate, with and without technology,
numeric expressions containing integer 3.2 describe some characteristics of exponential
exponents and rational bases (e.g., 2 –3 , 6 3 , relations arising from real-world applications
3456 0 , 1.0310 ) (e.g., bacterial growth, drug absorption) by
using tables of values (e.g., to show a constant
2.3 determine, through investigation (e.g., by ratio, or multiplicative growth or decay) and
patterning with and without a calculator), graphs (e.g., to show, with technology, that
the exponent rules for multiplying and there is no maximum or minimum value)
dividing numerical expressions involving
1 3 1 2 3.3 pose problems involving exponential relations
exponents [e.g.,
2( ) ( )
x
2
], and the arising from a variety of real-world applica-
exponent rule for simplifying numerical tions (e.g., population growth, radioactive
expressions involving a power of a power decay, compound interest), and solve these
THE ONTARIO CURRICULUM, GRADES 11 AND 12 | Mathematics
2 and other such problems by using a given
( )
[e.g., 53 ] graph or a graph generated with technology
2.4 graph simple exponential relations, using from a given table of values or a given equation
paper and pencil, given their equations Sample problem: Given a graph of the
1 x
( )
[e.g., y = 2 x , y = 10 x , y =
2
] population of a bacterial colony versus
time, determine the change in population
2.5 make and describe connections between in the first hour.
representations of an exponential relation
(i.e., numeric in a table of values; graphical; 3.4 solve problems using given equations of
algebraic) exponential relations arising from a variety
of real-world applications (e.g., radioactive
2.6 distinguish exponential relations from linear decay, population growth, height of a bounc-
and quadratic relations by making compar- ing ball, compound interest) by substituting
isons in a variety of ways (e.g., comparing values for the exponent into the equations
rates of change using finite differences in
Sample problem: The height, h metres, of a
tables of values; inspecting graphs; comparing
ball after n bounces is given by the equation
equations), within the same context when n
h = 2(0.6) . Determine the height of the ball
possible (e.g., simple interest and compound
after 3 bounces.
interest, population growth)
70](https://image.slidesharecdn.com/math1112currb-100910221608-phpapp02/85/Math1112currb-72-320.jpg)
![B. PERSONAL FINANCE
Foundations for College Mathematics
OVERALL EXPECTATIONS
By the end of this course, students will:
1. compare simple and compound interest, relate compound interest to exponential growth, and solve
problems involving compound interest;
2. compare services available from financial institutions, and solve problems involving the cost of making
purchases on credit;
3. interpret information about owning and operating a vehicle, and solve problems involving the
associated costs.
SPECIFIC EXPECTATIONS
Sample problem: Calculate the amount
1. Solving Problems Involving if $1000 is invested for 3 years at 6% per
Compound Interest annum, compounded quarterly.
MBF3C
By the end of this course, students will: 1.4 calculate the total interest earned on an invest-
ment or paid on a loan by determining the
1.1 determine, through investigation using technol- difference between the amount and the princi-
ogy, the compound interest for a given invest- pal [e.g., using I = A – P (or I = FV – PV )]
ment, using repeated calculations of simple
interest, and compare, using a table of values 1.5 solve problems, using a TVM Solver on a
and graphs, the simple and compound interest graphing calculator or on a website, that
earned for a given principal (i.e., investment) involve the calculation of the interest rate per
and a fixed interest rate over time compounding period, i, or the number of com-
pounding periods, n, in the compound interest
Sample problem: Compare, using tables of n
formula A = P(1 + i ) [or FV = PV (1 + i ) n ]
values and graphs, the amounts after each of
the first five years for a $1000 investment at Sample problem: Use the TVM Solver on a
5% simple interest per annum and a $1000 graphing calculator to determine the time it
investment at 5% interest per annum, takes to double an investment in an account
compounded annually. that pays interest of 4% per annum, com-
pounded semi-annually.
1.2 determine, through investigation (e.g., using
spreadsheets and graphs), and describe the 1.6 determine, through investigation using
relationship between compound interest and technology (e.g., a TVM Solver on a graphing
exponential growth calculator or on a website), the effect on the
future value of a compound interest invest-
1.3 solve problems, using a scientific calculator, ment or loan of changing the total length of
that involve the calculation of the amount, A time, the interest rate, or the compounding
(also referred to as future value, FV ), and the period
principal, P (also referred to as present value,
Sample problem: Investigate whether dou-
PV ), using the compound interest formula in
bling the interest rate will halve the time it
the form A = P(1 + i ) n [or FV = PV (1 + i ) n ]
takes for an investment to double.
PERSONAL FINANCE
71](https://image.slidesharecdn.com/math1112currb-100910221608-phpapp02/85/Math1112currb-73-320.jpg)
![C. GEOMETRY AND TRIGONOMETRY
Foundations for College Mathematics
OVERALL EXPECTATIONS
By the end of this course, students will:
1. represent, in a variety of ways, two-dimensional shapes and three-dimensional figures arising from
real-world applications, and solve design problems;
2. solve problems involving trigonometry in acute triangles using the sine law and the cosine law,
including problems arising from real-world applications.
SPECIFIC EXPECTATIONS
drawings (e.g., made using design or drawing
1. Representing Two-Dimensional software), and state any assumptions made
Shapes and Three-Dimensional
Sample problem: Design and construct a
Figures
model boat that can carry the most pennies,
using one sheet of 8.5 in. x 11 in. card stock,
By the end of this course, students will: no more than five popsicle sticks, and some MBF3C
1.1 recognize and describe real-world applications adhesive tape or glue.
of geometric shapes and figures, through
investigation (e.g., by importing digital photos
into dynamic geometry software), in a variety
2. Applying the Sine Law and the
of contexts (e.g., product design, architecture,
Cosine Law in Acute Triangles
fashion), and explain these applications (e.g.,
one reason that sewer covers are round is to By the end of this course, students will:
prevent them from falling into the sewer
2.1 solve problems, including those that arise
during removal and replacement)
from real-world applications (e.g., surveying,
Sample problem: Explain why rectangular navigation), by determining the measures of the
prisms are often used for packaging. sides and angles of right triangles using the
primary trigonometric ratios
1.2 represent three-dimensional objects, using
concrete materials and design or drawing 2.2 verify, through investigation using technology
software, in a variety of ways (e.g., ortho- (e.g., dynamic geometry software, spread-
graphic projections [i.e., front, side, and top sheet), the sine law and the cosine law (e.g.,
views], perspective isometric drawings, scale compare, using dynamic geometry software,
models) a b c
the ratios , , and in
sin A sin B sin C
1.3 create nets, plans, and patterns from physical
models arising from a variety of real-world triangle ABC while dragging one of the
applications (e.g., fashion design, interior dec- vertices);
orating, building construction), by applying
GEOMETRY AND TRIGONOMETRY
the metric and imperial systems and using 2.3 describe conditions that guide when it is
design or drawing software appropriate to use the sine law or the cosine
law, and use these laws to calculate sides and
1.4 solve design problems that satisfy given con- angles in acute triangles
straints (e.g., design a rectangular berm that
would contain all the oil that could leak from 2.4 solve problems that arise from real-world
a cylindrical storage tank of a given height applications involving metric and imperial
and radius), using physical models (e.g., built measurements and that require the use of the
from popsicle sticks, cardboard, duct tape) or sine law or the cosine law in acute triangles
73](https://image.slidesharecdn.com/math1112currb-100910221608-phpapp02/85/Math1112currb-75-320.jpg)


![A. EXPONENTIAL AND LOGARITHMIC
FUNCTIONS
Advanced Functions
OVERALL EXPECTATIONS
By the end of this course, students will:
1. demonstrate an understanding of the relationship between exponential expressions and logarithmic
expressions, evaluate logarithms, and apply the laws of logarithms to simplify numeric expressions;
2. identify and describe some key features of the graphs of logarithmic functions, make connections
among the numeric, graphical, and algebraic representations of logarithmic functions, and solve
related problems graphically;
3. solve exponential and simple logarithmic equations in one variable algebraically, including those
in problems arising from real-world applications.
SPECIFIC EXPECTATIONS
logarithms by evaluating expressions such as MHF4U
1. Evaluating Logarithmic Expressions log10 1000 – log10 100 and then rewriting the
answer as a logarithmic term to the same
By the end of this course, students will: base), and use the laws of logarithms to
1.1 recognize the logarithm of a number to a simplify and evaluate numerical expressions
given base as the exponent to which the base
must be raised to get the number, recognize
the operation of finding the logarithm to be 2. Connecting Graphs and Equations
the inverse operation (i.e., the undoing or of Logarithmic Functions
reversing) of exponentiation, and evaluate
simple logarithmic expressions By the end of this course, students will:
Sample problem: Why is it not possible to 2.1 determine, through investigation with tech-
determine log10(– 3) or log 2 0? Explain your nology (e.g., graphing calculator, spreadsheet)
reasoning. and without technology, key features (i.e.,
vertical and horizontal asymptotes, domain
1.2 determine, with technology, the approximate and range, intercepts, increasing/decreasing
logarithm of a number to any base, including behaviour) of the graphs of logarithmic func-
base 10 (e.g., by reasoning that log 3 29 is tions of the form f(x) = log b x, and make con-
between 3 and 4 and using systematic trial to nections between the algebraic and graphical EXPONENTIAL AND LOGARITHMIC FUNCTIONS
determine that log 3 29 is approximately 3.07) representations of these logarithmic functions
1.3 make connections between related logarithmic Sample problem: Compare the key features
and exponential equations (e.g., log 5 125 = 3 of the graphs of f(x) = log 2 x, g(x) = log 4 x,
can also be expressed as 5 3 = 125), and solve and h(x) = log 8 x using graphing technology.
simple exponential equations by rewriting
them in logarithmic form (e.g., solving 3x = 10 2.2 recognize the relationship between an expo-
by rewriting the equation as log 3 10 = x) nential function and the corresponding loga-
rithmic function to be that of a function and
1.4 make connections between the laws of expo- its inverse, deduce that the graph of a loga-
nents and the laws of logarithms [e.g., use rithmic function is the reflection of the graph
a+b
the statement 10 = 10 a 10b to deduce that of the corresponding exponential function in
log10 x + log10 y = log10 (xy)], verify the laws of the line y = x, and verify the deduction using
logarithms with or without technology (e.g., technology
use patterning to verify the quotient law for
87](https://image.slidesharecdn.com/math1112currb-100910221608-phpapp02/85/Math1112currb-89-320.jpg)
![Sample problem: Give examples to show that
the inverse of a function is not necessarily a 3. Solving Exponential and
function. Use the key features of the graphs of Logarithmic Equations
Grade 12, University Preparation
logarithmic and exponential functions to give
reasons why the inverse of an exponential By the end of this course, students will:
function is a function.
3.1 recognize equivalent algebraic expressions
2.3 determine, through investigation using technol- involving logarithms and exponents, and
ogy, the roles of the parameters d and c in simplify expressions of these types
functions of the form y = log10(x – d) + c and
Sample problem: Sketch the graphs of
the roles of the parameters a and k in func-
f(x) = log10(100x) and g(x) = 2 + log10x,
tions of the form y = alog10(kx), and describe
compare the graphs, and explain your
these roles in terms of transformations on the
findings algebraically.
graph of f(x) = log10 x (i.e., vertical and
horizontal translations; reflections in the axes; 3.2 solve exponential equations in one variable
vertical and horizontal stretches and by determining a common base (e.g., solve
x+ 3
compressions to and from the x- and y-axes) 4x = 8 by expressing each side as a power
of 2) and by using logarithms (e.g., solve
Sample problem: Investigate the graphs of x+ 3
4x = 8 by taking the logarithm base 2
f(x) = log10(x) + c, f(x) = log10(x – d),
of both sides), recognizing that logarithms
f(x) = alog10 x, and f(x) = log10(kx) for base 10 are commonly used (e.g., solving
x
various values of c, d, a, and k, using technol- 3 = 7 by taking the logarithm base 10 of
ogy, describe the effects of changing these both sides)
parameters in terms of transformations, and n
Sample problem: Solve 300(1.05) = 600 and
make connections to the transformations of
other functions such as polynomial functions,
2
x+ 2
– 2x = 12 either by finding a common
base or by taking logarithms, and explain
exponential functions, and trigonometric
your choice of method in each case.
functions.
3.3 solve simple logarithmic equations in one
2.4 pose problems based on real-world applica-
variable algebraically [e.g., log 3 (5x + 6) = 2,
tions of exponential and logarithmic functions
log10(x + 1) = 1]
(e.g., exponential growth and decay, the
Richter scale, the pH scale, the decibel scale), 3.4 solve problems involving exponential and
and solve these and other such problems by logarithmic equations algebraically, includ-
using a given graph or a graph generated ing problems arising from real-world
with technology from a table of values or applications
from its equation
Sample problem: The pH or acidity of a solu-
Sample problem: The pH or acidity of a solu- tion is given by the equation pH = – logC,
tion is given by the equation pH = – logC, where C is the concentration of [H +] ions in
where C is the concentration of [H +] ions in multiples of M = 1 mol/L. You are given a
THE ONTARIO CURRICULUM, GRADES 11 AND 12 | Mathematics
multiples of M = 1 mol/L. Use graphing solution of hydrochloric acid with a pH of 1.7
software to graph this function. What is the and asked to increase the pH of the solution
change in pH if the solution is diluted from a by 1.4. Determine how much you must dilute
concentration of 0.1M to a concentration of the solution. Does your answer differ if you
0.01M? From 0.001M to 0.0001M? Describe start with a pH of 2.2?
the change in pH when the concentration of
1
any acidic solution is reduced to of its
10
original concentration. Rearrange the given
equation to determine concentration as a
function of pH.
88](https://image.slidesharecdn.com/math1112currb-100910221608-phpapp02/85/Math1112currb-90-320.jpg)
![B. TRIGONOMETRIC FUNCTIONS
OVERALL EXPECTATIONS
Advanced Functions
By the end of this course, students will:
1. demonstrate an understanding of the meaning and application of radian measure;
2. make connections between trigonometric ratios and the graphical and algebraic representations of
the corresponding trigonometric functions and between trigonometric functions and their reciprocals,
and use these connections to solve problems;
3. solve problems involving trigonometric equations and prove trigonometric identities.
SPECIFIC EXPECTATIONS
1. Understanding and Applying 2. Connecting Graphs and Equations
Radian Measure of Trigonometric Functions
By the end of this course, students will: By the end of this course, students will: MHF4U
1.1 recognize the radian as an alternative unit to 2.1 sketch the graphs of f(x) = sin x and f(x) = cos x
the degree for angle measurement, define the for angle measures expressed in radians, and
radian measure of an angle as the length of determine and describe some key properties
the arc that subtends this angle at the centre (e.g., period of 2π, amplitude of 1) in terms of
of a unit circle, and develop and apply the radians
relationship between radian and degree
2.2 make connections between the tangent ratio
measure
and the tangent function by using technology
1.2 represent radian measure in terms of π (e.g., to graph the relationship between angles in
π radians and their tangent ratios and defining
radians, 2π radians) and as a rational number
3 this relationship as the function f(x) = tan x,
(e.g., 1.05 radians, 6.28 radians) and describe key properties of the tangent
function
1.3 determine, with technology, the primary
trigonometric ratios (i.e., sine, cosine, tangent) 2.3 graph, with technology and using the primary
and the reciprocal trigonometric ratios (i.e., trigonometric functions, the reciprocal
cosecant, secant, cotangent) of angles trigonometric functions (i.e., cosecant, secant,
expressed in radian measure cotangent) for angle measures expressed in
radians, determine and describe key proper-
1.4 determine, without technology, the exact ties of the reciprocal functions (e.g., state the
values of the primary trigonometric ratios
domain, range, and period, and identify and
and the reciprocal trigonometric ratios for
explain the occurrence of asymptotes), and
π π π π recognize notations used to represent the
the special angles 0, , , , , and their
6 4 3 2
reciprocal functions [e.g., the reciprocal of
TRIGONOMETRIC FUNCTIONS
multiples less than or equal to 2π
f(x) = sin x can be represented using csc x,
1 1
, or , but not using f –1(x) or sin–1 x,
f(x) sin x
which represent the inverse function]
89](https://image.slidesharecdn.com/math1112currb-100910221608-phpapp02/85/Math1112currb-91-320.jpg)
![2.4 determine the amplitude, period, and phase
shift of sinusoidal functions whose equations 3. Solving Trigonometric Equations
are given in the form f(x) = a sin (k(x – d)) + c
or f(x) = a cos(k(x – d)) + c, with angles By the end of this course, students will:
Grade 12, University Preparation
expressed in radians 3.1 recognize equivalent trigonometric expressions
2.5 sketch graphs of y = a sin (k(x – d)) + c and [e.g., by using the angles in a right triangle
π
y = a cos(k(x – d)) + c by applying trans-
formations to the graphs of f(x) = sin x and
to recognize that sin x and cos ( 2 )
– x are
f(x) = cos x with angles expressed in radians, equivalent; by using transformations to
π
and state the period, amplitude, and phase
shift of the transformed functions
(
recognize that cos x +
2) and – sin x are
equivalent], and verify equivalence using
Sample problem: Transform the graph of graphing technology
f(x) = cos x to sketch g(x) = 3 cos (2x) – 1,
and state the period, amplitude, and phase 3.2 explore the algebraic development of the
shift of each function. compound angle formulas (e.g., verify the
formulas in numerical examples, using tech-
2.6 represent a sinusoidal function with an nology; follow a demonstration of the alge-
equation, given its graph or its properties, braic development [student reproduction of
with angles expressed in radians the development of the general case is not
Sample problem: A sinusoidal function has required]), and use the formulas to determine
an amplitude of 2 units, a period of π, and a exact values of trigonometric ratios [e.g.,
maximum at (0, 3). Represent the function π
with an equation in two different ways.
determining the exact value of sin ( )12
by
first rewriting it in terms of special angles
2.7 pose problems based on applications involv- π π
ing a trigonometric function with domain as sin( 4
– ]
6)
expressed in radians (e.g., seasonal changes in
temperature, heights of tides, hours of day- 3.3 recognize that trigonometric identities are
light, displacements for oscillating springs), equations that are true for every value in the
and solve these and other such problems by domain (i.e., a counter-example can be used
using a given graph or a graph generated to show that an equation is not an identity),
with or without technology from a table of prove trigonometric identities through the
values or from its equation application of reasoning skills, using a variety
sin x
Sample problem: The population size, P, of relationships (e.g., tan x = cos x ;
of owls (predators) in a certain region can sin 2 x + cos 2 x = 1; the reciprocal identities;
be modelled by the function the compound angle formulas), and verify
πt
P(t) = 1000 + 100 sin ( )
12
, where t represents identities using technology
THE ONTARIO CURRICULUM, GRADES 11 AND 12 | Mathematics
the time in months. The population size, p, Sample problem: Use the compound angle
of mice (prey) in the same region is given by formulas to prove the double angle formulas.
πt
p(t) = 20 000 + 4000 cos ( )
12
. Sketch the 3.4 solve linear and quadratic trigonometric equa-
tions, with and without graphing technology,
graphs of these functions, and pose and
for the domain of real values from 0 to 2π,
solve problems involving the relationships
and solve related problems
between the two populations over time.
Sample problem: Solve the following trigono-
metric equations for 0 ≤ x ≤ 2π, and verify by
graphing with technology: 2 sin x + 1 = 0;
2 sin 2 x + sin x – 1 = 0; sin x = cos 2x;
1
cos 2x = .
2
90](https://image.slidesharecdn.com/math1112currb-100910221608-phpapp02/85/Math1112currb-92-320.jpg)
![C. POLYNOMIAL AND RATIONAL
FUNCTIONS
Advanced Functions
OVERALL EXPECTATIONS
By the end of this course, students will:
1. identify and describe some key features of polynomial functions, and make connections between the
numeric, graphical, and algebraic representations of polynomial functions;
2. identify and describe some key features of the graphs of rational functions, and represent rational
functions graphically;
3. solve problems involving polynomial and simple rational equations graphically and algebraically;
4. demonstrate an understanding of solving polynomial and simple rational inequalities.
SPECIFIC EXPECTATIONS
1.3 describe key features of the graphs of poly- MHF4U
1. Connecting Graphs and Equations nomial functions (e.g., the domain and range,
of Polynomial Functions the shape of the graphs, the end behaviour of
the functions for very large positive or nega-
By the end of this course, students will: tive x-values)
1.1 recognize a polynomial expression (i.e., a Sample problem: Describe and compare the
series of terms where each term is the product key features of the graphs of the functions
of a constant and a power of x with a non- f(x) = x, f(x) = x 2, f(x) = x 3, f(x) = x 3 + x 2,
negative integral exponent, such as and f(x) = x 3 + x.
x3 – 5x 2 + 2x – 1); recognize the equation of
1.4 distinguish polynomial functions from
a polynomial function, give reasons why it
sinusoidal and exponential functions [e.g.,
is a function, and identify linear and quad- x
f(x) = sin x, g(x) = 2 ], and compare and
ratic functions as examples of polynomial
contrast the graphs of various polynomial
functions
functions with the graphs of other types of
1.2 compare, through investigation using graph- functions
ing technology, the numeric, graphical, and
1.5 make connections, through investigation
algebraic representations of polynomial (i.e.,
using graphing technology (e.g., dynamic
linear, quadratic, cubic, quartic) functions
geometry software), between a polynomial
(e.g., compare finite differences in tables of
function given in factored form [e.g.,
values; investigate the effect of the degree of a
f(x) = 2(x – 3)(x + 2)(x – 1)] and the
POLYNOMIAL AND RATIONAL FUNCTIONS
polynomial function on the shape of its graph
x-intercepts of its graph, and sketch the
and the maximum number of x-intercepts;
graph of a polynomial function given in
investigate the effect of varying the sign of the
factored form using its key features (e.g.,
leading coefficient on the end behaviour of
by determining intercepts and end beha-
the function for very large positive or nega-
viour; by locating positive and negative
tive x-values)
regions using test values between and on
Sample problem: Investigate the maximum either side of the x-intercepts)
number of x-intercepts for linear, quadratic,
Sample problem: Investigate, using graphing
cubic, and quartic functions using graphing
technology, the x-intercepts and the shapes
technology.
of the graphs of polynomial functions with
91](https://image.slidesharecdn.com/math1112currb-100910221608-phpapp02/85/Math1112currb-93-320.jpg)
![one or more repeated factors, for example, 1.9 determine, through investigation, and compare
f(x) = (x – 2)(x – 3), f(x) = (x – 2)(x – 2)(x – 3), the properties of even and odd polynomial
f(x) = (x – 2)(x – 2)(x – 2)(x – 3), and functions [e.g., symmetry about the y-axis
f(x) = (x + 2)(x + 2)(x – 2)(x – 2)(x – 3),
Grade 12, University Preparation
or the origin; the power of each term; the
by considering whether the factor is number of x-intercepts; f(x) = f(– x) or
repeated an even or an odd number of f(– x) = – f(x)], and determine whether a given
times. Use your conclusions to sketch polynomial function is even, odd, or neither
f(x) = (x + 1)(x + 1)(x – 3)(x – 3), and verify
Sample problem: Investigate numerically,
using technology.
graphically, and algebraically, with and with-
1.6 determine, through investigation using tech- out technology, the conditions under which
nology, the roles of the parameters a, k, d, and an even function has an even number of
c in functions of the form y = af (k(x – d)) + c, x-intercepts.
and describe these roles in terms of transforma-
tions on the graphs of f(x) = x 3 and f(x) = x 4
(i.e., vertical and horizontal translations; 2. Connecting Graphs and Equations
reflections in the axes; vertical and horizontal of Rational Functions
stretches and compressions to and from the
x- and y-axes) By the end of this course, students will:
Sample problem: Investigate, using technol- 2.1 determine, through investigation with and
ogy, the graph of f(x) = 2(x – d) 3 + c for without technology, key features (i.e., vertical
various values of d and c, and describe and horizontal asymptotes, domain and
the effects of changing d and c in terms of range, intercepts, positive/negative intervals,
transformations. increasing/decreasing intervals) of the graphs
of rational functions that are the reciprocals of
1.7 determine an equation of a polynomial func-
linear and quadratic functions, and make con-
tion that satisfies a given set of conditions (e.g.,
nections between the algebraic and graphical
degree of the polynomial, intercepts, points
representations of these rational functions [e.g.,
on the function), using methods appropriate
to the situation (e.g., using the x-intercepts of 1
make connections between f(x) = 2
the function; using a trial-and-error process x – 4
with a graphing calculator or graphing soft- and its graph by using graphing technology
ware; using finite differences), and recognize and by reasoning that there are vertical
that there may be more than one polynomial asymptotes at x = 2 and x = – 2 and a hori-
function that can satisfy a given set of condi- zontal asymptote at y = 0 and that the func-
tions (e.g., an infinite number of polynomial tion maintains the same sign as f(x) = x 2 – 4]
functions satisfy the condition that they have Sample problem: Investigate, with technology,
three given x-intercepts) the key features of the graphs of families of
Sample problem: Determine an equation for rational functions of the form
THE ONTARIO CURRICULUM, GRADES 11 AND 12 | Mathematics
a fifth-degree polynomial function that inter- 1 1
f(x) = and f(x) = 2 ,
sects the x-axis at only 5, 1, and – 5, and x+n x +n
sketch the graph of the function. where n is an integer, and make connections
between the equations and key features of
1.8 determine the equation of the family of poly- the graphs.
nomial functions with a given set of zeros
and of the member of the family that passes 2.2 determine, through investigation with and
through another given point [e.g., a family without technology, key features (i.e., vertical
of polynomial functions of degree 3 with and horizontal asymptotes, domain and
zeros 5, – 3, and – 2 is defined by the equation range, intercepts, positive/negative intervals,
f(x) = k(x – 5)(x + 3)(x + 2), where k is a real increasing/decreasing intervals) of the graphs
number, k ≠ 0; the member of the family of rational functions that have linear expres-
that passes through (– 1, 24) is sions in the numerator and denominator
f(x) = – 2(x – 5)(x + 3)(x + 2)] 2x x–2
[e.g., f(x) = , h(x) = ], and
x–3 3x + 4
Sample problem: Investigate, using graphing
make connections between the algebraic and
technology, and determine a polynomial
graphical representations of these rational
function that can be used to model the func-
functions
tion f(x) = sin x over the interval 0 ≤ x ≤ 2π.
92](https://image.slidesharecdn.com/math1112currb-100910221608-phpapp02/85/Math1112currb-94-320.jpg)
![Sample problem: Investigate, using graphing 3.4 solve polynomial equations in one variable,
technology, key features of the graphs of the of degree no higher than four (e.g.,
family of rational functions of the form 2x3 – 3x2 + 8x – 12 = 0), by selecting and
8x applying strategies (i.e., common factoring,
f(x) = for n = 1, 2, 4, and 8, and make
nx + 1 difference of squares, trinomial factoring,
connections between the equations and the factoring by grouping, remainder theorem,
asymptotes.
Advanced Functions
factor theorem), and verify solutions using
technology (e.g., using computer algebra
2.3 sketch the graph of a simple rational function
systems to determine the roots; using graph-
using its key features, given the algebraic rep-
ing technology to determine the x-intercepts
resentation of the function
of the graph of the corresponding polynomial
function)
3. Solving Polynomial and Rational 3.5 determine, through investigation using tech-
Equations nology (e.g., graphing calculator, computer
algebra systems), the connection between
By the end of this course, students will: the real roots of a rational equation and the
x-intercepts of the graph of the corresponding
3.1 make connections, through investigation using rational function, and describe this connection
technology (e.g., computer algebra systems),
x–2
between the polynomial function f(x), the [e.g., the real root of the equation =0
x–3
divisor x – a, the remainder from the division
is 2, which is the x-intercept of the function
f(x) x–2 1
, and f(a) to verify the remainder theorem f(x) = ; the equation = 0 has no
x–a x–3 x–3
and the factor theorem 1
real roots, and the function f(x) = does
x–3 MHF4U
Sample problem: Divide not intersect the x-axis]
f(x) = x4 + 4x3 – x2 – 16x – 14 by x – a for
3.6 solve simple rational equations in one variable
various integral values of a using a computer
algebraically, and verify solutions using tech-
algebra system. Compare the remainder from
nology (e.g., using computer algebra systems
each division with f(a).
to determine the roots; using graphing tech-
3.2 factor polynomial expressions in one variable, nology to determine the x-intercepts of the
of degree no higher than four, by selecting graph of the corresponding rational function)
and applying strategies (i.e., common factor-
3.7 solve problems involving applications of
ing, difference of squares, trinomial factoring,
polynomial and simple rational functions and
factoring by grouping, remainder theorem,
equations [e.g., problems involving the factor
factor theorem)
theorem or remainder theorem, such as deter-
Sample problem: Factor: x3 + 2x2 – x – 2; mining the values of k for which the function
x4 – 6x3 + 4x2 + 6x – 5. f(x) = x3 + 6x2 + kx – 4 gives the same remain-
der when divided by x – 1 and x + 2]
3.3 determine, through investigation using tech-
nology (e.g., graphing calculator, computer Sample problem: Use long division to express
algebra systems), the connection between the x 2 + 3x – 5
the given function f(x) = as the
real roots of a polynomial equation and the x–1
x-intercepts of the graph of the corresponding sum of a polynomial function and a rational
polynomial function, and describe this con- A
POLYNOMIAL AND RATIONAL FUNCTIONS
function of the form (where A is a
nection [e.g., the real roots of the equation x–1
x4 – 13x2 + 36 = 0 are the x-intercepts of the constant), make a conjecture about the rela-
graph of f(x) = x4 – 13x2 + 36] tionship between the given function and the
polynomial function for very large positive
Sample problem: Describe the relationship
and negative x-values, and verify your con-
between the x-intercepts of the graphs of
jecture using graphing technology.
linear and quadratic functions and the real
roots of the corresponding equations.
Investigate, using technology, whether this
relationship exists for polynomial functions
of higher degree.
93](https://image.slidesharecdn.com/math1112currb-100910221608-phpapp02/85/Math1112currb-95-320.jpg)
![4. Solving Inequalities
By the end of this course, students will:
Grade 12, University Preparation
4.1 explain, for polynomial and simple rational
functions, the difference between the solution
to an equation in one variable and the solu-
tion to an inequality in one variable, and
demonstrate that given solutions satisfy an
inequality (e.g., demonstrate numerically
and graphically that the solution to
1 4
< 5 is x < – 1 or x > – );
x +1 5
4.2 determine solutions to polynomial inequali-
ties in one variable [e.g., solve f(x) ≥ 0, where
f(x) = x 3 – x 2 + 3x – 9] and to simple rational
inequalities in one variable by graphing the
corresponding functions, using graphing tech-
nology, and identifying intervals for which x
satisfies the inequalities
4.3 solve linear inequalities and factorable poly-
nomial inequalities in one variable (e.g.,
x 3 + x 2 > 0) in a variety of ways (e.g., by deter-
mining intervals using x-intercepts and evalu-
ating the corresponding function for a single
x-value within each interval; by factoring the
polynomial and identifying the conditions for
which the product satisfies the inequality),
and represent the solutions on a number line
or algebraically (e.g., for the inequality
x4 – 5x 2 + 4 < 0, the solution represented
algebraically is – 2 < x < – 1 or 1 < x < 2)
THE ONTARIO CURRICULUM, GRADES 11 AND 12 | Mathematics
94](https://image.slidesharecdn.com/math1112currb-100910221608-phpapp02/85/Math1112currb-96-320.jpg)
![Sample problem: In general, does the speedo- arising from real-world applications, by using
meter of a car measure instantaneous rate of numerical and graphical methods (e.g., by
change (i.e., instantaneous speed) or average using graphing technology to graph a tangent
Grade 12, University Preparation
rate of change (i.e., average speed)? Describe and measure its slope)
situations in which the instantaneous speed
Sample problem: The height, h metres, of a
and the average speed would be the same.
ball above the ground can be modelled by
1.6 determine, through investigation using various the function h(t) = – 5t 2 + 20t, where t is
representations of relationships (e.g., tables of the time in seconds. Use average speeds to
values, graphs, equations), approximate instan- determine the approximate instantaneous
taneous rates of change arising from real-world speed at t = 3.
applications (e.g., in the natural, physical, and
social sciences) by using average rates of
change and reducing the interval over which 2. Combining Functions
the average rate of change is determined
By the end of this course, students will:
Sample problem: The distance, d metres,
travelled by a falling object in t seconds is 2.1 determine, through investigation using graph-
represented by d = 5t 2. When t = 3, the ing technology, key features (e.g., domain,
instantaneous speed of the object is 30 m/s. range, maximum/minimum points, number
Compare the average speeds over different of zeros) of the graphs of functions created by
time intervals starting at t = 3 with the adding, subtracting, multiplying, or dividing
instantaneous speed when t = 3. Use your functions [e.g., f(x) = 2 –x sin 4x, g(x) = x 2 + 2 x,
observations to select an interval that can be sin x
h(x) = ], and describe factors that affect
used to provide a good approximation of the cos x
instantaneous speed at t = 3. these properties
1.7 make connections, through investigation, Sample problem: Investigate the effect of
between the slope of a secant on the graph the behaviours of f(x) = sin x, f(x) = sin 2x,
of a function (e.g., quadratic, exponential, and f(x) = sin 4x on the shape of
sinusoidal) and the average rate of change f(x) = sin x + sin 2x + sin 4x.
of the function over an interval, and between
2.2 recognize real-world applications of combi-
the slope of the tangent to a point on the
nations of functions (e.g., the motion of a
graph of a function and the instantaneous
damped pendulum can be represented by a
rate of change of the function at that point
function that is the product of a trigonometric
Sample problem: Use tangents to investigate function and an exponential function; the fre-
the behaviour of a function when the instan- quencies of tones associated with the numbers
taneous rate of change is zero, positive, or on a telephone involve the addition of two
negative. trigonometric functions), and solve related
problems graphically
1.8 determine, through investigation using a vari-
THE ONTARIO CURRICULUM, GRADES 11 AND 12 | Mathematics
ety of tools and strategies (e.g., using a table Sample problem: The rate at which a conta-
of values to calculate slopes of secants or minant leaves a storm sewer and enters a
graphing secants and measuring their slopes lake depends on two factors: the concentra-
with technology), the approximate slope of tion of the contaminant in the water from the
the tangent to a given point on the graph of sewer and the rate at which the water leaves
a function (e.g., quadratic, exponential, sinu- the sewer. Both of these factors vary with
soidal) by using the slopes of secants through time. The concentration of the contaminant,
the given point (e.g., investigating the slopes in kilograms per cubic metre of water, is
of secants that approach the tangent at that given by c(t) = t 2, where t is in seconds. The
point more and more closely), and make con- rate at which water leaves the sewer, in cubic
nections to average and instantaneous rates 1
metres per second, is given by w(t) = 4 .
of change t + 10
Determine the time at which the contaminant
1.9 solve problems involving average and instan- leaves the sewer and enters the lake at the
taneous rates of change, including problems maximum rate.
96](https://image.slidesharecdn.com/math1112currb-100910221608-phpapp02/85/Math1112currb-98-320.jpg)
![2.3 determine, through investigation, and explain Determine algebraically c(v(t)), the rate of
some properties (i.e., odd, even, or neither; gasoline consumption as a function of time.
increasing/decreasing behaviours) of functions Determine, using technology, the time when
formed by adding, subtracting, multiplying, the car is running most economically during
and dividing general functions [e.g., a four-hour trip.
f(x) + g(x), f(x)g(x)]
2.7 demonstrate, by giving examples for func-
Advanced Functions
Sample problem: Investigate algebraically, tions represented in a variety of ways (e.g.,
and verify numerically and graphically, function machines, graphs, equations), the
whether the product of two functions is even property that the composition of a function
or odd if the two functions are both even or and its inverse function maps a number onto
both odd, or if one function is even and the itself [i.e., f –1( f(x)) = x and f( f –1(x)) = x
other is odd. demonstrate that the inverse function is the
reverse process of the original function and
2.4 determine the composition of two functions
that it undoes what the function does]
[i.e., f(g(x))] numerically (i.e., by using a table
of values) and graphically, with technology, 2.8 make connections, through investigation
for functions represented in a variety of ways using technology, between transformations
(e.g., function machines, graphs, equations), (i.e., vertical and horizontal translations;
and interpret the composition of two func- reflections in the axes; vertical and horizontal
tions in real-world applications stretches and compressions to and from the
Sample problem: For a car travelling at a con- x- and y-axes) of simple functions f(x) [e.g.,
stant speed, the distance driven, d kilometres, f(x) = x 3 + 20, f(x) = sin x, f(x) = log x] and
is represented by d(t) = 80t, where t is the the composition of these functions with a
time in hours. The cost of gasoline, in dollars, linear function of the form g(x) = A(x + B)
for the drive is represented by C(d) = 0.09d. Sample problem: Compare the graph of MHF4U
Determine numerically and interpret C(d(5)), f(x) = x2 with the graphs of f(g(x)) and
and describe the relationship represented by g( f(x)), where g(x) = 2(x – d), for various
C(d(t)). values of d. Describe the effects of d in
terms of transformations of f(x).
2.5 determine algebraically the composition of
two functions [i.e., f(g(x))], verify that f(g(x))
is not always equal to g( f(x)) [e.g., by deter- 3. Using Function Models to Solve
mining f(g(x)) and g( f(x)), given f(x) = x + 1
Problems
and g(x) = 2x], and state the domain [i.e., by
defining f(g(x)) for those x-values for which
g(x) is defined and for which it is included in By the end of this course, students will:
the domain of f(x)] and the range of the com- 3.1 compare, through investigation using a vari-
position of two functions ety of tools and strategies (e.g., graphing with
Sample problem: Determine f(g(x)) and g( f(x)) technology; comparing algebraic representa-
given f(x) = cos x and g(x) = 2x + 1, state the tions; comparing finite differences in tables of
domain and range of f(g(x)) and g( f(x)), com- values) the characteristics (e.g., key features of
pare f(g(x)) with g( f(x)) algebraically, and the graphs, forms of the equations) of various
verify numerically and graphically with functions (i.e., polynomial, rational, trigono-
technology. metric, exponential, logarithmic)
2.6 solve problems involving the composition of 3.2 solve graphically and numerically equations
two functions, including problems arising and inequalities whose solutions are not
accessible by standard algebraic techniques
CHARACTERISTICS OF FUNCTIONS
from real-world applications
x
Sample problem: The speed of a car, v kilo- Sample problem: Solve: 2x2 < 2 ; cos x = x,
metres per hour, at a time of t hours is repre- with x in radians.
sented by v(t) = 40 + 3t + t 2. The rate of
3.3 solve problems, using a variety of tools and
gasoline consumption of the car, c litres per
strategies, including problems arising from
kilometre, at a speed of v kilometres per hour
real-world applications, by reasoning with
v 2
is represented by c(v) = (
500 )
– 0.1 + 0.15. functions and by applying concepts and
procedures involving functions (e.g., by
97](https://image.slidesharecdn.com/math1112currb-100910221608-phpapp02/85/Math1112currb-99-320.jpg)

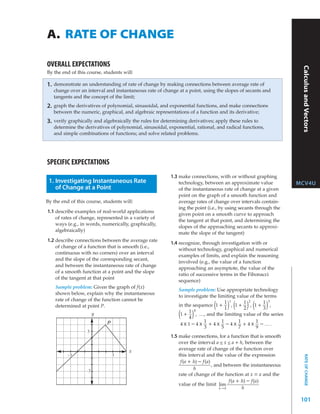
![dy
Sample problem: What does the limit the graphs of f(x) and f ’(x) or y and
dx
f(4 + h) – f(4)
lim = 8 indicate about the [e.g., when f(x) is linear, f ’(x) is constant;
h→0 h when f(x) is quadratic, f ’(x) is linear; when
Grade 12, University Preparation
graph of the function f(x) = x 2 ? The graph of f(x) is cubic, f ’(x) is quadratic]
a general function y = f(x)?
Sample problem: Investigate, using patterning
1.6 compare, through investigation, the calcula- strategies and graphing technology, relation-
tion of instantaneous rates of change at a ships between the equation of a polynomial
point (a, f(a)) for polynomial functions function of degree no higher than 3 and the
[e.g., f(x) = x 2, f(x) = x 3 ], with and without equation of its derivative.
f(a + h) – f(a)
simplifying the expression 2.3 determine the derivatives of polynomial func-
h
tions by simplifying the algebraic expression
before substituting values of h that approach
f(x + h) – f(x)
zero [e.g., for f(x) = x 2 at x = 3, by determining and then taking the limit of the
h
f(3 + 1) – f(3) f(3 + 0.1) – f(3) simplified expression as h approaches zero
= 7, = 6.1,
1 0.1
lim f(x + h) – f(x)
f(3 + 0.01) – f(3) [i.e., determining hlim
→0 ]
= 6.01, and h→0 h
0.01
f(3 + 0.001) – f(3)
2.4 determine, through investigation using tech-
= 6.001, and nology, the graph of the derivative f ’(x) or
0.001
f(3 + h) – f(3) dy
by first simplifying as of a given sinusoidal function [i.e.,
h dx
2 2
(3 + h) – 3 f(x) = sin x, f(x) = cos x] (e.g., by generating
= 6 + h and then substituting
h a table of values showing the instantaneous
the same values of h to give the same results] rate of change of the function for various values
of x and graphing the ordered pairs; by using
dynamic geometry software to verify graphi-
2. Investigating the Concept of the cally that when f(x) = sin x, f ’(x) = cos x, and
Derivative Function when f(x) = cos x, f ’(x) = – sin x; by using
a motion sensor to compare the displacement
By the end of this course, students will: and velocity of a pendulum)
2.1 determine numerically and graphically the 2.5 determine, through investigation using tech-
intervals over which the instantaneous rate nology, the graph of the derivative f ’(x) or
of change is positive, negative, or zero for a dy
function that is smooth over these intervals of a given exponential function [i.e.,
dx
(e.g., by using graphing technology to exam-
f(x) = a x (a > 0, a ≠ 1)] [e.g., by generating a
ine the table of values and the slopes of tan-
gents for a function whose equation is given; table of values showing the instantaneous rate
by examining a given graph), and describe the of change of the function for various values
THE ONTARIO CURRICULUM, GRADES 11 AND 12 | Mathematics
behaviour of the instantaneous rate of change of x and graphing the ordered pairs; by using
at and between local maxima and minima dynamic geometry software to verify that
x
when f(x) = a , f ’(x) = kf(x)], and make con-
Sample problem: Given a smooth function nections between the graphs of f(x) and f ’(x)
for which the slope of the tangent is always dy
positive, explain how you know that the or y and [e.g., f(x) and f ’(x) are both
dx
function is increasing. Give an example of f ’(x)
exponential; the ratio is constant, or
such a function. f(x)
f ’(x) = kf(x); f ’(x) is a vertical stretch from
2.2 generate, through investigation using tech-
the x-axis of f(x)]
nology, a table of values showing the instan-
taneous rate of change of a polynomial Sample problem: Graph, with technology,
function, f(x), for various values of x (e.g., f(x) = a x (a > 0, a ≠ 1) and f ’(x) on the same
construct a tangent to the function, measure set of axes for various values of a (e.g., 1.7,
its slope, and create a slider or animation to 2.0, 2.3, 3.0, 3.5). For each value of a,
move the point of tangency), graph the f ’(x)
investigate the ratio for various values
ordered pairs, recognize that the graph f(x)
represents a function called the derivative, of x, and explain how you can use this ratio
dy to determine the slopes of tangents to f(x).
f ’(x) or , and make connections between
dx
102](https://image.slidesharecdn.com/math1112currb-100910221608-phpapp02/85/Math1112currb-104-320.jpg)
![2.6 determine, through investigation using tech-
nology, the exponential function f(x) = a
x 3. Investigating the Properties of
(a > 0, a ≠ 1) for which f ’(x) = f(x) (e.g., by Derivatives
using graphing technology to create a slider
that varies the value of a in order to deter- By the end of this course, students will:
mine the exponential function whose graph is
3.1 verify the power rule for functions of the form
Calculus and Vectors
the same as the graph of its derivative), iden- n
f(x) = x , where n is a natural number [e.g., by
tify the number e to be the value of a for which
x x determining the equations of the derivatives
f ’(x) = f(x) [i.e., given f(x) = e , f ’(x) = e ], and
of the functions f(x) = x, f(x) = x 2, f(x) = x 3 ,
recognize that for the exponential function
x and f(x) = x 4 algebraically using
f(x) = e the slope of the tangent at any point
on the function is equal to the value of the f(x + h) – f(x)
lim and graphically using slopes
function at that point h→0 h
of tangents]
Sample problem: Use graphing technology to
determine an approximate value of e by graph- 3.2 verify the constant, constant multiple, sum,
x and difference rules graphically and numeri-
ing f(x) = a (a > 0, a ≠ 1) for various values
of a, comparing the slope of the tangent at a cally [e.g., by using the function g(x) = kf(x)
point with the value of the function at that and comparing the graphs of g’(x) and kf’(x);
point, and identifying the value of a for which by using a table of values to verify that
they are equal. f ’(x) + g’(x) = ( f + g)’(x), given f(x) = x and
g(x) = 3x], and read and interpret proofs
2.7 recognize that the natural logarithmic func- f(x + h) – f(x)
tion f(x) = log e x, also written as f(x) = ln x, involving lim of the constant,
h→0 h
is the inverse of the exponential function constant multiple, sum, and difference rules
x
f(x) = e , and make connections between (student reproduction of the development of MCV4U
x
f(x) = ln x and f(x) = e [e.g., f(x) = ln x the general case is not required)
x
reverses what f(x) = e does; their graphs are
reflections of each other in the line y = x; the Sample problem: The amounts of water flow-
lnx x ing into two barrels are represented by the
composition of the two functions, e or ln e ,
lnx functions f (t) and g(t). Explain what f ’(t),
maps x onto itself, that is, e = x and
x g’(t), f ’(t) + g’(t), and ( f + g)’(t) represent.
ln e = x]
Explain how you can use this context to veri-
2.8 verify, using technology (e.g., calculator, fy the sum rule, f ’(t) + g’(t) = ( f + g)’(t).
graphing technology), that the derivative
x 3.3 determine algebraically the derivatives of
of the exponential function f(x) = a is
x polynomial functions, and use these deriva-
f ’(x) = a ln a for various values of a [e.g.,
x tives to determine the instantaneous rate of
verifying numerically for f(x) = 2 that
x change at a point and to determine point(s)
f ’(x) = 2 ln 2 by using a calculator to show
h at which a given rate of change occurs
(2 – 1) x
that lim is ln 2 or by graphing f(x) = 2 , Sample problem: Determine algebraically the
h→0 h
determining the value of the slope and the derivative of f(x) = 2x 3 + 3x 2 and the point(s)
value of the function for specific x-values, and at which the slope of the tangent is 36.
f ’(x)
comparing the ratio with ln 2] 3.4 verify that the power rule applies to functions
f(x) of the form f(x) = x n, where n is a rational
x
Sample problem: Given f(x) = e , verify number [e.g., by comparing values of the
1
numerically with technology using slopes of tangents to the function f(x) = x 2
x+h
(e – e x) with values of the derivative function deter-
lim that f ’(x) = f(x) ln e.
h→0 h mined using the power rule], and verify
RATE OF CHANGE
103](https://image.slidesharecdn.com/math1112currb-100910221608-phpapp02/85/Math1112currb-105-320.jpg)
![algebraically the chain rule using monomial
functions [e.g., by determining the same
1
derivative for f(x) = (5x 3) 3 by using the chain
Grade 12, University Preparation
rule and by differentiating the simplified
1
form, f(x) = 5 3 x] and the product rule using
polynomial functions [e.g., by determining the
same derivative for f(x) = (3x + 2)(2x 2 – 1) by
using the product rule and by differentiating
the expanded form f(x) = 6x 3 + 4x 2 – 3x – 2]
Sample problem: Verify the chain rule by
using the product rule to look for patterns in
the derivatives of f(x) = x 2 + 1, f(x) = (x 2 + 1)2,
f(x) = (x 2 + 1)3, and f(x) = (x 2 + 1)4.
3.5 solve problems, using the product and chain
rules, involving the derivatives of polynomial
functions, sinusoidal functions, exponential
functions, rational functions [e.g., by
x2 + 1
expressing f(x) = as the product
x–1
f(x) = (x 2 + 1)(x – 1)– 1], radical functions [e.g.,
by expressing f(x) = √ x 2 + 5 as the power
1
f(x) = (x 2 + 5) 2 ], and other simple combinations
sin x
of functions [e.g., f(x) = x sin x, f(x) = cos x ]*
THE ONTARIO CURRICULUM, GRADES 11 AND 12 | Mathematics
*The emphasis of this expectation is on the application of the derivative rules and not on the simplification of resulting complex
algebraic expressions.
104](https://image.slidesharecdn.com/math1112currb-100910221608-phpapp02/85/Math1112currb-106-320.jpg)
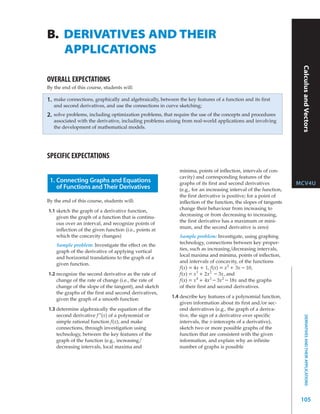
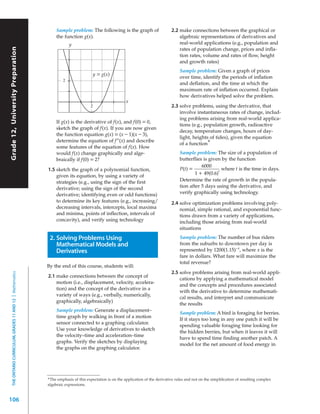

![C. GEOMETRY AND ALGEBRA
OF VECTORS
Grade 12, University Preparation
OVERALL EXPECTATIONS
By the end of this course, students will:
1. demonstrate an understanding of vectors in two-space and three-space by representing them
algebraically and geometrically and by recognizing their applications;
2. perform operations on vectors in two-space and three-space, and use the properties of these
operations to solve problems, including those arising from real-world applications;
3. distinguish between the geometric representations of a single linear equation or a system of two
linear equations in two-space and three-space, and determine different geometric configurations
of lines and planes in three-space;
4. represent lines and planes using scalar, vector, and parametric equations, and solve problems
involving distances and intersections.
SPECIFIC EXPECTATIONS
the representation as a directed line segment
1. Representing Vectors Geometrically of a vector in two-space given in Cartesian
and Algebraically form [e.g., representing the vector (8, 6) as a
directed line segment]
By the end of this course, students will:
Sample problem: Represent the vector with a
1.1 recognize a vector as a quantity with both magnitude of 8 and a direction of 30º anti-
magnitude and direction, and identify, gather, clockwise to the positive x-axis in Cartesian
and interpret information about real-world form.
applications of vectors (e.g., displacement,
1.4 recognize that points and vectors in three-space
forces involved in structural design, simple
can both be represented using Cartesian coor-
animation of computer graphics, velocity
dinates, and determine the distance between
determined using GPS)
THE ONTARIO CURRICULUM, GRADES 11 AND 12 | Mathematics
two points and the magnitude of a vector
Sample problem: Position is represented using their Cartesian representations
using vectors. Explain why knowing that
someone is 69 km from Lindsay, Ontario, is
not sufficient to identify their exact position. 2. Operating With Vectors
1.2 represent a vector in two-space geometrically By the end of this course, students will:
as a directed line segment, with directions ex-
pressed in different ways (e.g., 320º; N 40º W), 2.1 perform the operations of addition, subtrac-
and algebraically (e.g., using Cartesian coordi- tion, and scalar multiplication on vectors
nates; using polar coordinates), and recognize represented as directed line segments in two-
vectors with the same magnitude and direc- space, and on vectors represented in Cartesian
tion but different positions as equal vectors form in two-space and three-space
1.3 determine, using trigonometric relationships 2.2 determine, through investigation with and
–1 y without technology, some properties (e.g.,
[e.g., x = rcos θ, y = rsin θ, θ = tan
–1 y
( )
x
or commutative, associative, and distributive
tan ( )
x
+ 180º, r = √ x + y ],
2 2
properties) of the operations of addition,
subtraction, and scalar multiplication of
the Cartesian representation of a vector in
two-space given as a directed line segment, or vectors
108](https://image.slidesharecdn.com/math1112currb-100910221608-phpapp02/85/Math1112currb-110-320.jpg)
![2.3 solve problems involving the addition, sub- 2.7 determine, through investigation, properties
traction, and scalar multiplication of vectors, of the cross product (e.g., investigate whether
including problems arising from real-world it is commutative, distributive, or associative;
applications investigate the cross product of collinear
vectors)
Sample problem: A plane on a heading of
N 27° E has an air speed of 375 km/h. The Sample problem: Investigate algebraically the
Calculus and Vectors
wind is blowing from the south at 62 km/h. relationship between the cross product of
→ →
Determine the actual direction of travel of the the vectors a = (1, 0, 1) and b = (0, 1, – 1)
plane and its ground speed.
and the cross product of scalar multiples
→ →
2.4 perform the operation of dot product on two of a and b. Does this relationship apply to
vectors represented as directed line segments any two vectors?
→ → → →
(i.e., using a • b =|a||b|cos θ ) and in
→ → 2.8 solve problems involving dot product and
Cartesian form (i.e., using a • b = a1b1 + a2b2 or
→ → cross product (e.g., determining projections,
a • b = a1b1 + a2b2 + a3b3 ) in two-space and the area of a parallelogram, the volume of a
three-space, and describe applications of parallelepiped), including problems arising
the dot product (e.g., determining the angle from real-world applications (e.g., determin-
between two vectors; determining the projec- ing work, torque, ground speed, velocity,
tion of one vector onto another) force)
Sample problem: Describe how the dot pro- Sample problem: Investigate the dot products
duct can be used to compare the work done → → → → → → →
a • (a x b) and b • (a x b) for any two vectors a
in pulling a wagon over a given distance in →
a specific direction using a given force for and b in three-space. What property of the
→ →
different positions of the handle. cross product a x b does this verify?
MCV4U
2.5 determine, through investigation, properties
of the dot product (e.g., investigate whether 3. Describing Lines and Planes Using
it is commutative, distributive, or associative; Linear Equations
investigate the dot product of a vector with
itself and the dot product of orthogonal By the end of this course, students will:
vectors)
3.1 recognize that the solution points (x, y) in
Sample problem: Investigate geometrically two-space of a single linear equation in two
and algebraically the relationship between variables form a line and that the solution
the dot product of the vectors (1, 0, 1) and points (x, y) in two-space of a system of two
(0, 1, – 1) and the dot product of scalar multi- linear equations in two variables determine
ples of these vectors. Does this relationship the point of intersection of two lines, if the
apply to any two vectors? Find a vector that lines are not coincident or parallel
is orthogonal to both the given vectors.
Sample problem: Describe algebraically the
2.6 perform the operation of cross product situations in two-space in which the solution
on two vectors represented in Cartesian points (x, y) of a system of two linear equa-
form in three-space [i.e., using tions in two variables do not determine a
→ →
a x b = (a2b3 – a3b2 , a3b1 – a1b3 , a1b2 – a2b1)], point.
determine the magnitude of the cross product
→ → → → 3.2 determine, through investigation with technol-
(i.e., using|a x b| =|a||b|sin θ ), and describe
ogy (i.e., 3-D graphing software) and without
GEOMETRY AND ALGEBRA OF VECTORS
applications of the cross product (e.g., deter-
technology, that the solution points (x, y, z) in
mining a vector orthogonal to two given vec-
three-space of a single linear equation in three
tors; determining the turning effect [or torque]
variables form a plane and that the solution
when a force is applied to a wrench at differ-
points (x, y, z) in three-space of a system of
ent angles)
two linear equations in three variables form
Sample problem: Explain how you maximize the line of intersection of two planes, if the
the torque when you use a wrench and how planes are not coincident or parallel
the inclusion of a ratchet in the design of a
Sample problem: Use spatial reasoning to
wrench helps you to maximize the torque.
compare the shapes of the solutions in three-
space with the shapes of the solutions in two-
space for each of the linear equations x = 0,
109](https://image.slidesharecdn.com/math1112currb-100910221608-phpapp02/85/Math1112currb-111-320.jpg)
![y = 0, and y = x. For each of the equations Sample problem: How does the relationship
→ → →
z = 5, y – z = 3, and x + z = 1, describe the a • (b x c) = 0 help you determine whether
shape of the solution points (x, y, z) in three- three non-parallel planes intersect in a point, if
Grade 12, University Preparation
→ → →
space. Verify the shapes of the solutions in a, b, and c represent normals to the three
three-space using technology. planes?
3.3 determine, through investigation using a 4.4 recognize a scalar equation for a plane in
variety of tools and strategies (e.g., modelling three-space to be an equation of the form
with cardboard sheets and drinking straws; Ax + By + Cz + D = 0 whose solution points
sketching on isometric graph paper), different make up the plane, determine the intersection
geometric configurations of combinations of of three planes represented using scalar
up to three lines and/or planes in three-space equations by solving a system of three linear
(e.g., two skew lines, three parallel planes, equations in three unknowns algebraically
two intersecting planes, an intersecting line (e.g., by using elimination or substitution),
and plane); organize the configurations based and make connections between the algebraic
on whether they intersect and, if so, how they solution and the geometric configuration of
intersect (i.e., in a point, in a line, in a plane) the three planes
Sample problem: Determine the equation
of a plane P3 that intersects the planes
4. Describing Lines and Planes Using P1 , x + y + z = 1, and P2 , x – y + z = 0, in
Scalar, Vector, and Parametric a single point. Determine the equation of a
Equations plane P4 that intersects P1 and P2 in more
than one point.
By the end of this course, students will:
4.5 determine, using properties of a plane, the
4.1 recognize a scalar equation for a line in scalar, vector, and parametric equations of
two-space to be an equation of the form a plane
Ax + By + C = 0, represent a line in
Sample problem: Determine the scalar, vector,
two-space using a vector equation (i.e.,
→ → → and parametric equations of the plane that
r = r0 + tm) and parametric equations, and passes through the points (3, 2, 5), (0, – 2, 2),
make connections between a scalar equation, and (1, 3, 1).
a vector equation, and parametric equations
of a line in two-space 4.6 determine the equation of a plane in its scalar,
vector, or parametric form, given another of
4.2 recognize that a line in three-space cannot these forms
be represented by a scalar equation, and rep-
resent a line in three-space using the scalar Sample problem: Represent the plane
→
equations of two intersecting planes and r = (2, 1, 0) + s(1, – 1, 3) + t(2, 0, – 5), where
using vector and parametric equations (e.g., s and t are real numbers, with a scalar
given a direction vector and a point on the equation.
THE ONTARIO CURRICULUM, GRADES 11 AND 12 | Mathematics
line, or given two points on the line)
4.7 solve problems relating to lines and planes in
Sample problem: Represent the line passing three-space that are represented in a variety
through (3, 2, – 1) and (0, 2, 1) with the scalar of ways (e.g., scalar, vector, parametric equa-
equations of two intersecting planes, with tions) and involving distances (e.g., between a
a vector equation, and with parametric point and a plane; between two skew lines) or
equations. intersections (e.g., of two lines, of a line and a
plane), and interpret the result geometrically
4.3 recognize a normal to a plane geometrically
(i.e., as a vector perpendicular to the plane) Sample problem: Determine the intersection
and algebraically [e.g., one normal to the of the perpendicular line drawn from the
plane 3x + 5y – 2z = 6 is (3, 5, – 2)], and deter- point A(– 5, 3, 7) to the plane
→
mine, through investigation, some geometric v = (0, 0, 2) + t(– 1, 1, 3) + s(2, 0, – 3),
properties of the plane (e.g., the direction of and determine the distance from
any normal to a plane is constant; all scalar point A to the plane.
multiples of a normal to a plane are also nor-
mals to that plane; three non-collinear points
determine a plane; the resultant, or sum, of
any two vectors in a plane also lies in the
plane)
110](https://image.slidesharecdn.com/math1112currb-100910221608-phpapp02/85/Math1112currb-112-320.jpg)


![getting an odd number of heads from tossing 2.2 solve simple problems using techniques for
a coin 5 times are mutually exclusive), and counting permutations and combinations,
solve related probability problems [e.g., cal- where all objects are distinct, and express
Grade 12, University Preparation
culate P(~A), P(A and B), P(A or B)] using a the solutions using standard combinatorial
variety of strategies (e.g., Venn diagrams, n
lists, formulas) ()
notation [e.g., n!, P(n, r),
r
]
Sample problem: In many Aboriginal com-
1.6 determine whether two events are indepen-
munities, it is common practice for people to
dent or dependent and whether one event is
shake hands when they gather. Use combina-
conditional on another event, and solve
tions to determine the total number of hand-
related probability problems [e.g., calculate
shakes when 7 people gather, and verify
P(A and B), P(A or B), P(A given B)] using a
using a different strategy.
variety of strategies (e.g., tree diagrams, lists,
formulas) 2.3 solve introductory counting problems involv-
ing the additive counting principle (e.g.,
determining the number of ways of selecting
2. Solving Problems Using Counting 2 boys or 2 girls from a group of 4 boys and
Principles 5 girls) and the multiplicative counting princi-
ple (e.g., determining the number of ways of
By the end of this course, students will: selecting 2 boys and 2 girls from a group of
4 boys and 5 girls)
2.1 recognize the use of permutations and combi-
nations as counting techniques with advan- 2.4 make connections, through investigation,
tages over other counting techniques (e.g., between combinations (i.e., n choose r) and
making a list; using a tree diagram; making a 2
chart; drawing a Venn diagram), distinguish
Pascal’s triangle [e.g., between()
r
and
n
between situations that involve the use of per-
mutations and those that involve the use of
row 3 of Pascal’s triangle, between ()
2
and
diagonal 3 of Pascal’s triangle]
combinations (e.g., by considering whether or
Sample problem: A school is 5 blocks west
not order matters), and make connections
and 3 blocks south of a student’s home.
between, and calculate, permutations and
Determine, in a variety of ways (e.g., by
combinations
drawing the routes, by using Pascal’s triangle,
Sample problem: An organization with by using combinations), how many different
10 members is considering two leadership routes the student can take from home to the
models. One involves a steering committee school by going west or south at each corner.
with 4 members of equal standing. The other
is an executive committee consisting of a 2.5 solve probability problems using counting
president, vice-president, secretary, and principles for situations involving equally
treasurer. Determine the number of ways of likely outcomes
selecting the executive committee from the Sample problem: Two marbles are drawn
THE ONTARIO CURRICULUM, GRADES 11 AND 12 | Mathematics
10 members and, using this number, the randomly from a bag containing 12 green
number of ways of selecting the steering marbles and 16 red marbles. What is the
committee from the 10 members. How are probability that the two marbles are both
the calculations related? Use the calculations green if the first marble is replaced? If the
to explain the relationship between permuta- first marble is not replaced?
tions and combinations.
114](https://image.slidesharecdn.com/math1112currb-100910221608-phpapp02/85/Math1112currb-116-320.jpg)
![B. PROBABILITY DISTRIBUTIONS
Mathematics Functions
OVERALL EXPECTATIONS
By the end of this course, students will:
1. demonstrate an understanding of discrete probability distributions, represent them numerically,
of Data Management
graphically, and algebraically, determine expected values, and solve related problems from a variety
of applications;
2. demonstrate an understanding of continuous probability distributions, make connections to discrete
probability distributions, determine standard deviations, describe key features of the normal
distribution, and solve related problems from a variety of applications.
SPECIFIC EXPECTATIONS
1.3 represent a probability distribution graphical-
1. Understanding Probability ly using a probability histogram (i.e., a histo-
Distributions for Discrete Random gram on which each rectangle has a base of
Variables width 1, centred on the value of the discrete MDM4U
random variable, and a height equal to the
By the end of this course, students will: probability associated with the value of the
random variable), and make connections
1.1 recognize and identify a discrete random vari- between the frequency histogram and the
able X (i.e., a variable that assumes a unique probability histogram (e.g., by comparing
value for each outcome of a discrete sample their shapes)
space, such as the value x for the outcome of
getting x heads in 10 tosses of a coin), gener- Sample problem: For the situation involving
ate a probability distribution [i.e., a function the rolling of two number cubes and deter-
that maps each value x of a random variable mining the sum, identify the discrete random
X to a corresponding probability, P(X = x)] by variable and generate the related probability
calculating the probabilities associated with histogram. Determine the total area of the
all values of a random variable, with and bars in the histogram and explain your
without technology, and represent a probabil- result.
ity distribution numerically using a table 1.4 recognize conditions (e.g., independent trials)
1.2 calculate the expected value for a given that give rise to a random variable that follows
probability distribution [i.e., using a binomial probability distribution, calculate
E(X) = ∑ xP(X = x)], interpret the expected the probability associated with each value of
value in applications, and make connections the random variable, represent the distribu-
between the expected value and the weighted tion numerically using a table and graphically
mean of the values of the discrete random using a probability histogram, and make con-
variable nections to the algebraic representation
n x
Sample problem: Of six cases, three each P(X = x) = () p (1 – p)n – x
PROBABILITY DISTRIBUTIONS
x
hold $1, two each hold $1000, and one holds
Sample problem: A light-bulb manufacturer
$100 000. Calculate the expected value and
estimates that 0.5% of the bulbs manufac-
interpret its meaning. Make a conjecture
tured are defective. Generate and graph the
about what happens to the expected value if
probability distribution for the random vari-
you add $10 000 to each case or if you multi-
able that represents the number of defective
ply the amount in each case by 10. Verify
bulbs in a set of 4 bulbs.
your conjectures.
115](https://image.slidesharecdn.com/math1112currb-100910221608-phpapp02/85/Math1112currb-117-320.jpg)


![Sample problem: Why is it possible to 2.6 pose problems based on real-world applica-
determine log10(100) but not log10(0) or tions that can be modelled with given expo-
log10 (– 100)? Explain your reasoning. nential equations, and solve these and other
such problems algebraically by rewriting
2.4 determine, with technology, the approximate
Grade 12, College Preparation
them in logarithmic form
logarithm of a number to any base, including
base 10 [e.g., by recognizing that log10(0.372) Sample problem: When a potato whose tem-
can be determined using the LOG key on perature is 20°C is placed in an oven main-
a calculator; by reasoning that log 3 29 is tained at 200°C, the relationship between the
between 3 and 4 and using systematic trial to core temperature of the potato T, in degrees
determine that log 329 is approximately 3.07] Celsius, and the cooking time t, in minutes, is
modelled by the equation 200 – T = 180(0.96)t .
2.5 make connections between related logarithmic Use logarithms to determine the time when
and exponential equations (e.g., log 5 125 = 3 the potato’s core temperature reaches 160°C.
can also be expressed as 5 3 = 125), and solve
simple exponential equations by rewriting
them in logarithmic form (e.g., solving 3x = 10
by rewriting the equation as log 3 10 = x)
THE ONTARIO CURRICULUM, GRADES 11 AND 12 | Mathematics
126](https://image.slidesharecdn.com/math1112currb-100910221608-phpapp02/85/Math1112currb-128-320.jpg)
![B. POLYNOMIAL FUNCTIONS
Mathematics for College Technology
OVERALL EXPECTATIONS
By the end of this course, students will:
1. recognize and evaluate polynomial functions, describe key features of their graphs, and solve
problems using graphs of polynomial functions;
2. make connections between the numeric, graphical, and algebraic representations of polynomial
functions;
3. solve polynomial equations by factoring, make connections between functions and formulas, and
solve problems involving polynomial expressions arising from a variety of applications.
SPECIFIC EXPECTATIONS
Sample problem: Describe and compare the
1. Investigating Graphs of Polynomial key features of the graphs of the functions
Functions f(x) = x, f(x) = x2 , f(x) = x3 , and f(x) = x 4 .
MCT4C
By the end of this course, students will: 1.4 distinguish polynomial functions from
sinusoidal and exponential functions [e.g.,
1.1 recognize a polynomial expression (i.e., a f(x) = sin x, f(x) = 2x )], and compare and
series of terms where each term is the product contrast the graphs of various polynomial
of a constant and a power of x with a non- functions with the graphs of other types
negative integral exponent, such as of functions
x3 – 5x2 + 2x – 1); recognize the equation of
a polynomial function and give reasons why 1.5 substitute into and evaluate polynomial func-
it is a function, and identify linear and quad- tions expressed in function notation, including
ratic functions as examples of polynomial functions arising from real-world applications
functions Sample problem: A box with no top is being
made out of a 20-cm by 30-cm piece of
1.2 compare, through investigation using graph-
cardboard by cutting equal squares of
ing technology, the graphical and algebraic
side length x from the corners and folding
representations of polynomial (i.e., linear,
up the sides. The volume of the box is
quadratic, cubic, quartic) functions (e.g., inves-
V = x(20 – 2x)(30 – 2x). Determine the volume
tigate the effect of the degree of a polynomial
if the side length of each square is 6 cm. Use
function on the shape of its graph and the
the graph of the polynomial function V(x) to
maximum number of x-intercepts; investigate
determine the size of square that should be
the effect of varying the sign of the leading
cut from the corners if the required volume
coefficient on the end behaviour of the
of the box is 1000 cm3 .
function for very large positive or negative
x-values) 1.6 pose problems based on real-world applica-
Sample problem: Investigate the maximum tions that can be modelled with polynomial
number of x-intercepts for linear, quadratic, functions, and solve these and other such
POLYNOMIAL FUNCTIONS
cubic, and quartic functions using graphing problems by using a given graph or a graph
technology. generated with technology from a table of
values or from its equation
1.3 describe key features of the graphs of poly-
nomial functions (e.g., the domain and range, 1.7 recognize, using graphs, the limitations of
the shape of the graphs, the end behaviour modelling a real-world relationship using a
of the functions for very large positive or polynomial function, and identify and explain
negative x-values) any restrictions on the domain and range
(e.g., restrictions on the height and time for a
127](https://image.slidesharecdn.com/math1112currb-100910221608-phpapp02/85/Math1112currb-129-320.jpg)
![polynomial function that models the relation- roots of the corresponding equations. Inves-
ship between height above the ground and tigate, using technology, whether this rela-
time for a falling object) tionship exists for polynomial functions of
higher degree.
Sample problem: The forces acting on a hori-
Grade 12, College Preparation
zontal support beam in a house cause it to sag
by d centimetres, x metres from one end of the
beam. The relationship between d and x can
3. Solving Problems Involving
be represented by the polynomial function
Polynomial Equations
1
d(x) = x(1000 – 20x 2 + x 3 ). Graph the By the end of this course, students will:
1850
function, using technology, and determine 3.1 solve polynomial equations in one variable, of
the domain over which the function models degree no higher than four (e.g., x2 – 4x = 0,
the relationship between d and x. Determine x4 – 16 = 0, 3x 2 + 5x + 2 = 0), by selecting and
the length of the beam using the graph, and applying strategies (i.e., common factoring;
explain your reasoning. difference of squares; trinomial factoring), and
verify solutions using technology (e.g., using
computer algebra systems to determine the
2. Connecting Graphs and Equations roots of the equation; using graphing technol-
of Polynomial Functions ogy to determine the x-intercepts of the
corresponding polynomial function)
By the end of this course, students will:
Sample problem: Solve x3 – 2x2 – 8x = 0.
2.1 factor polynomial expressions in one variable, 3.2 solve problems algebraically that involve
of degree no higher than four, by selecting
polynomial functions and equations of degree
and applying strategies (i.e., common factor-
no higher than four, including those arising
ing, difference of squares, trinomial factoring)
from real-world applications
Sample problem: Factor: x4 – 16; x3 – 2x2 – 8x.
3.3 identify and explain the roles of constants and
2.2 make connections, through investigation variables in a given formula (e.g., a constant
using graphing technology (e.g., dynamic can refer to a known initial value or a known
geometry software), between a polynomial fixed rate; a variable changes with varying
function given in factored form [e.g., conditions)
f(x) = x(x – 1)(x + 1)] and the x-intercepts of
Sample problem: The formula P = P0 + kh is
its graph, and sketch the graph of a polyno-
used to determine the pressure, P kilopascals,
mial function given in factored form using its
at a depth of h metres under water, where
key features (e.g., by determining intercepts
k kilopascals per metre is the rate of change
and end behaviour; by locating positive and
of the pressure as the depth increases, and
negative regions using test values between
P0 kilopascals is the pressure at the surface.
and on either side of the x-intercepts)
THE ONTARIO CURRICULUM, GRADES 11 AND 12 | Mathematics
Identify and describe the roles of P, P0 , k,
Sample problem: Sketch the graphs of and h in this relationship, and explain your
f(x) = – (x – 1)(x + 2)(x – 4) and reasoning.
g(x) = – (x – 1)(x + 2)(x + 2) and compare
3.4 expand and simplify polynomial expressions
their shapes and the number of x-intercepts.
involving more than one variable [e.g., sim-
2.3 determine, through investigation using tech- plify – 2xy(3x 2 y3 – 5x 3 y2 )], including expres-
nology (e.g., graphing calculator, computer sions arising from real-world applications
algebra systems), and describe the connection
Sample problem: Expand and simplify the
between the real roots of a polynomial equa-
expression π(R + r)(R – r) to explain why it
tion and the x-intercepts of the graph of the
represents the area of a ring. Draw a diagram
corresponding polynomial function [e.g., the
of the ring and identify R and r.
real roots of the equation x4 – 13x2 + 36 = 0
are the x-intercepts of the graph of 3.5 solve equations of the form x n = a using
f(x) = x4 – 13x2 + 36] rational exponents (e.g., solve x 3 = 7 by
1
Sample problem: Describe the relationship raising both sides to the exponent )
3
between the x-intercepts of the graphs of
linear and quadratic functions and the real
128](https://image.slidesharecdn.com/math1112currb-100910221608-phpapp02/85/Math1112currb-130-320.jpg)
![3.6 determine the value of a variable of degree of a linear function A(P) when i and n are
no higher than three, using a formula drawn constant], using a variety of tools and strat-
Mathematics for College Technology
from an application, by first substituting egies (e.g., comparing the graphs generated
known values and then solving for the vari- with technology when different variables in
able, and by first isolating the variable and a formula are set as constants)
then substituting known values Sample problem: Which variable(s) in the
Sample problem: The formula s = ut + 1 at 2 formula V = π r 2 h would you need to set as
2 a constant to generate a linear equation?
relates the distance, s, travelled by an object
A quadratic equation?
to its initial velocity, u, acceleration, a, and the
elapsed time, t. Determine the acceleration 3.8 solve multi-step problems requiring formulas
of a dragster that travels 500 m from rest in arising from real-world applications (e.g.,
15 s, by first isolating a, and then by first determining the cost of two coats of paint
substituting known values. Compare and for a large cylindrical tank)
evaluate the two methods.
3.9 gather, interpret, and describe information
3.7 make connections between formulas and lin- about applications of mathematical modelling
ear, quadratic, and exponential functions [e.g., in occupations, and about college programs
recognize that the compound interest formula, that explore these applications
A = P(1 + i) n , is an example of an exponential
function A(n) when P and i are constant, and
MCT4C
POLYNOMIAL FUNCTIONS
129](https://image.slidesharecdn.com/math1112currb-100910221608-phpapp02/85/Math1112currb-131-320.jpg)


![A. MATHEMATICAL MODELS
Foundations for College Mathematics
OVERALL EXPECTATIONS
By the end of this course, students will:
1. evaluate powers with rational exponents, simplify algebraic expressions involving exponents, and
solve problems involving exponential equations graphically and using common bases;
2. describe trends based on the interpretation of graphs, compare graphs using initial conditions and
rates of change, and solve problems by modelling relationships graphically and algebraically;
3. make connections between formulas and linear, quadratic, and exponential relations, solve problems
using formulas arising from real-world applications, and describe applications of mathematical
modelling in various occupations.
SPECIFIC EXPECTATIONS
1.4 evaluate, with or without technology, numeri-
1. Solving Exponential Equations cal expressions involving rational exponents
1
MAP4C
By the end of this course, students will: and rational bases [e.g., 2 –3 , (–6)3 , 4 2 , 1.01120 ]*
1.1 determine, through investigation (e.g., by 1.5 solve simple exponential equations numeri-
expanding terms and patterning), the exponent cally and graphically, with technology (e.g.,
laws for multiplying and dividing algebraic use systematic trial with a scientific calculator
expressions involving exponents [e.g., (x 3 )(x 2 ), to determine the solution to the equation
x 3 ÷ x 5 ] and the exponent law for simplifying 1.05x = 1.276), and recognize that the solu-
algebraic expressions involving a power of a tions may not be exact
power [e.g. (x 6 y 3 )2 ] Sample problem: Use the graph of y = 3 x to
1.2 simplify algebraic expressions containing inte- solve the equation 3 x = 5.
ger exponents using the laws of exponents 1.6 solve problems involving exponential equa-
a2b5c5 tions arising from real-world applications by
Sample problem: Simplify and
ab – 3 c 4 using a graph or table of values generated
evaluate for a = 8, b = 2, and c = – 30. with technology from a given equation [e.g.,
1.3 determine, through investigation using a h = 2(0.6) n, where h represents the height of
variety of tools (e.g., calculator, paper and a bouncing ball and n represents the number
pencil, graphing technology) and strategies of bounces]
(e.g., patterning; finding values from a graph; Sample problem: Dye is injected to test pan-
interpreting the exponent laws), the value of creas function. The mass, R grams, of dye re-
m
a power with a rational exponent (i.e., x n , maining in a healthy pancreas after t minutes
where x > 0 and m and n are integers) is given by the equation R = I(0.96) t , where
I grams is the mass of dye initially injected.
Sample problem: The exponent laws suggest
1 1 If 0.50 g of dye is initially injected into a
that 4 2 x 4 2 = 41. What value would you healthy pancreas, determine how much time
MATHEMATICAL MODELS
1
assign to 42 ? What value would you assign elapses until 0.35 g remains by using a graph
1 and/or table of values generated with
3
to 27 ? Explain your reasoning. Extend your technology.
reasoning to make a generalization about the
1
meaning of x n , where x > 0 and n is a natural
number.
*The knowledge and skills described in this expectation are to be introduced as needed, and applied and consolidated, where
appropriate, throughout the course.
137](https://image.slidesharecdn.com/math1112currb-100910221608-phpapp02/85/Math1112currb-139-320.jpg)
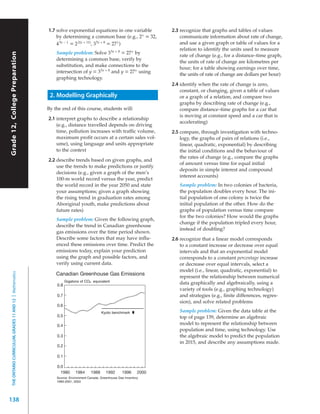
![Years after 1955 Population of Geese 3.3 make connections between formulas and lin-
ear, quadratic, and exponential functions [e.g.,
Foundations for College Mathematics
0 5 000
recognize that the compound interest formula,
10 12 000 A = P(1 + i) n , is an example of an exponential
20 26 000 function A(n) when P and i are constant, and
30 62 000 of a linear function A(P) when i and n are con-
40 142 000 stant], using a variety of tools and strategies
(e.g., comparing the graphs generated with
50 260 000 technology when different variables in a
formula are set as constants)
3. Modelling Algebraically Sample problem: Which variable(s) in the
formula V = π r 2 h would you need to set as
By the end of this course, students will: a constant to generate a linear equation?
A quadratic equation? Explain why you can
3.1 solve equations of the form x n = a using expect the relationship between the volume
rational exponents (e.g., solve x3 = 7 by and the height to be linear when the radius
1
raising both sides to the exponent ) is constant.
3
3.2 determine the value of a variable of degree 3.4 solve multi-step problems requiring formulas
no higher than three, using a formula drawn arising from real-world applications (e.g.,
from an application, by first substituting determining the cost of two coats of paint for
known values and then solving for the vari- a large cylindrical tank)
able, and by first isolating the variable and
then substituting known values 3.5 gather, interpret, and describe information
4 about applications of mathematical modelling
Sample problem: Use the formula V = π r 3 in occupations, and about college programs MAP4C
3
to determine the radius of a sphere with a that explore these applications
volume of 1000 cm3 .
MATHEMATICAL MODELS
139](https://image.slidesharecdn.com/math1112currb-100910221608-phpapp02/85/Math1112currb-141-320.jpg)


![Ucu100 1-1[1]](https://cdn.slidesharecdn.com/ss_thumbnails/ucu100-1-11-190926173142-thumbnail.jpg?width=640&height=640&fit=bounds)