Mechanical design processresults with the selection of a material using a set of
functional and geometrical constraints
A profile of properties is listed that fulfills the criteria set by these constraints that
are required for the design to function adequately
Properties of all kinds of materials are documented in materials databases for
the designer to find the one special material that best meets the needs of the
design
3.
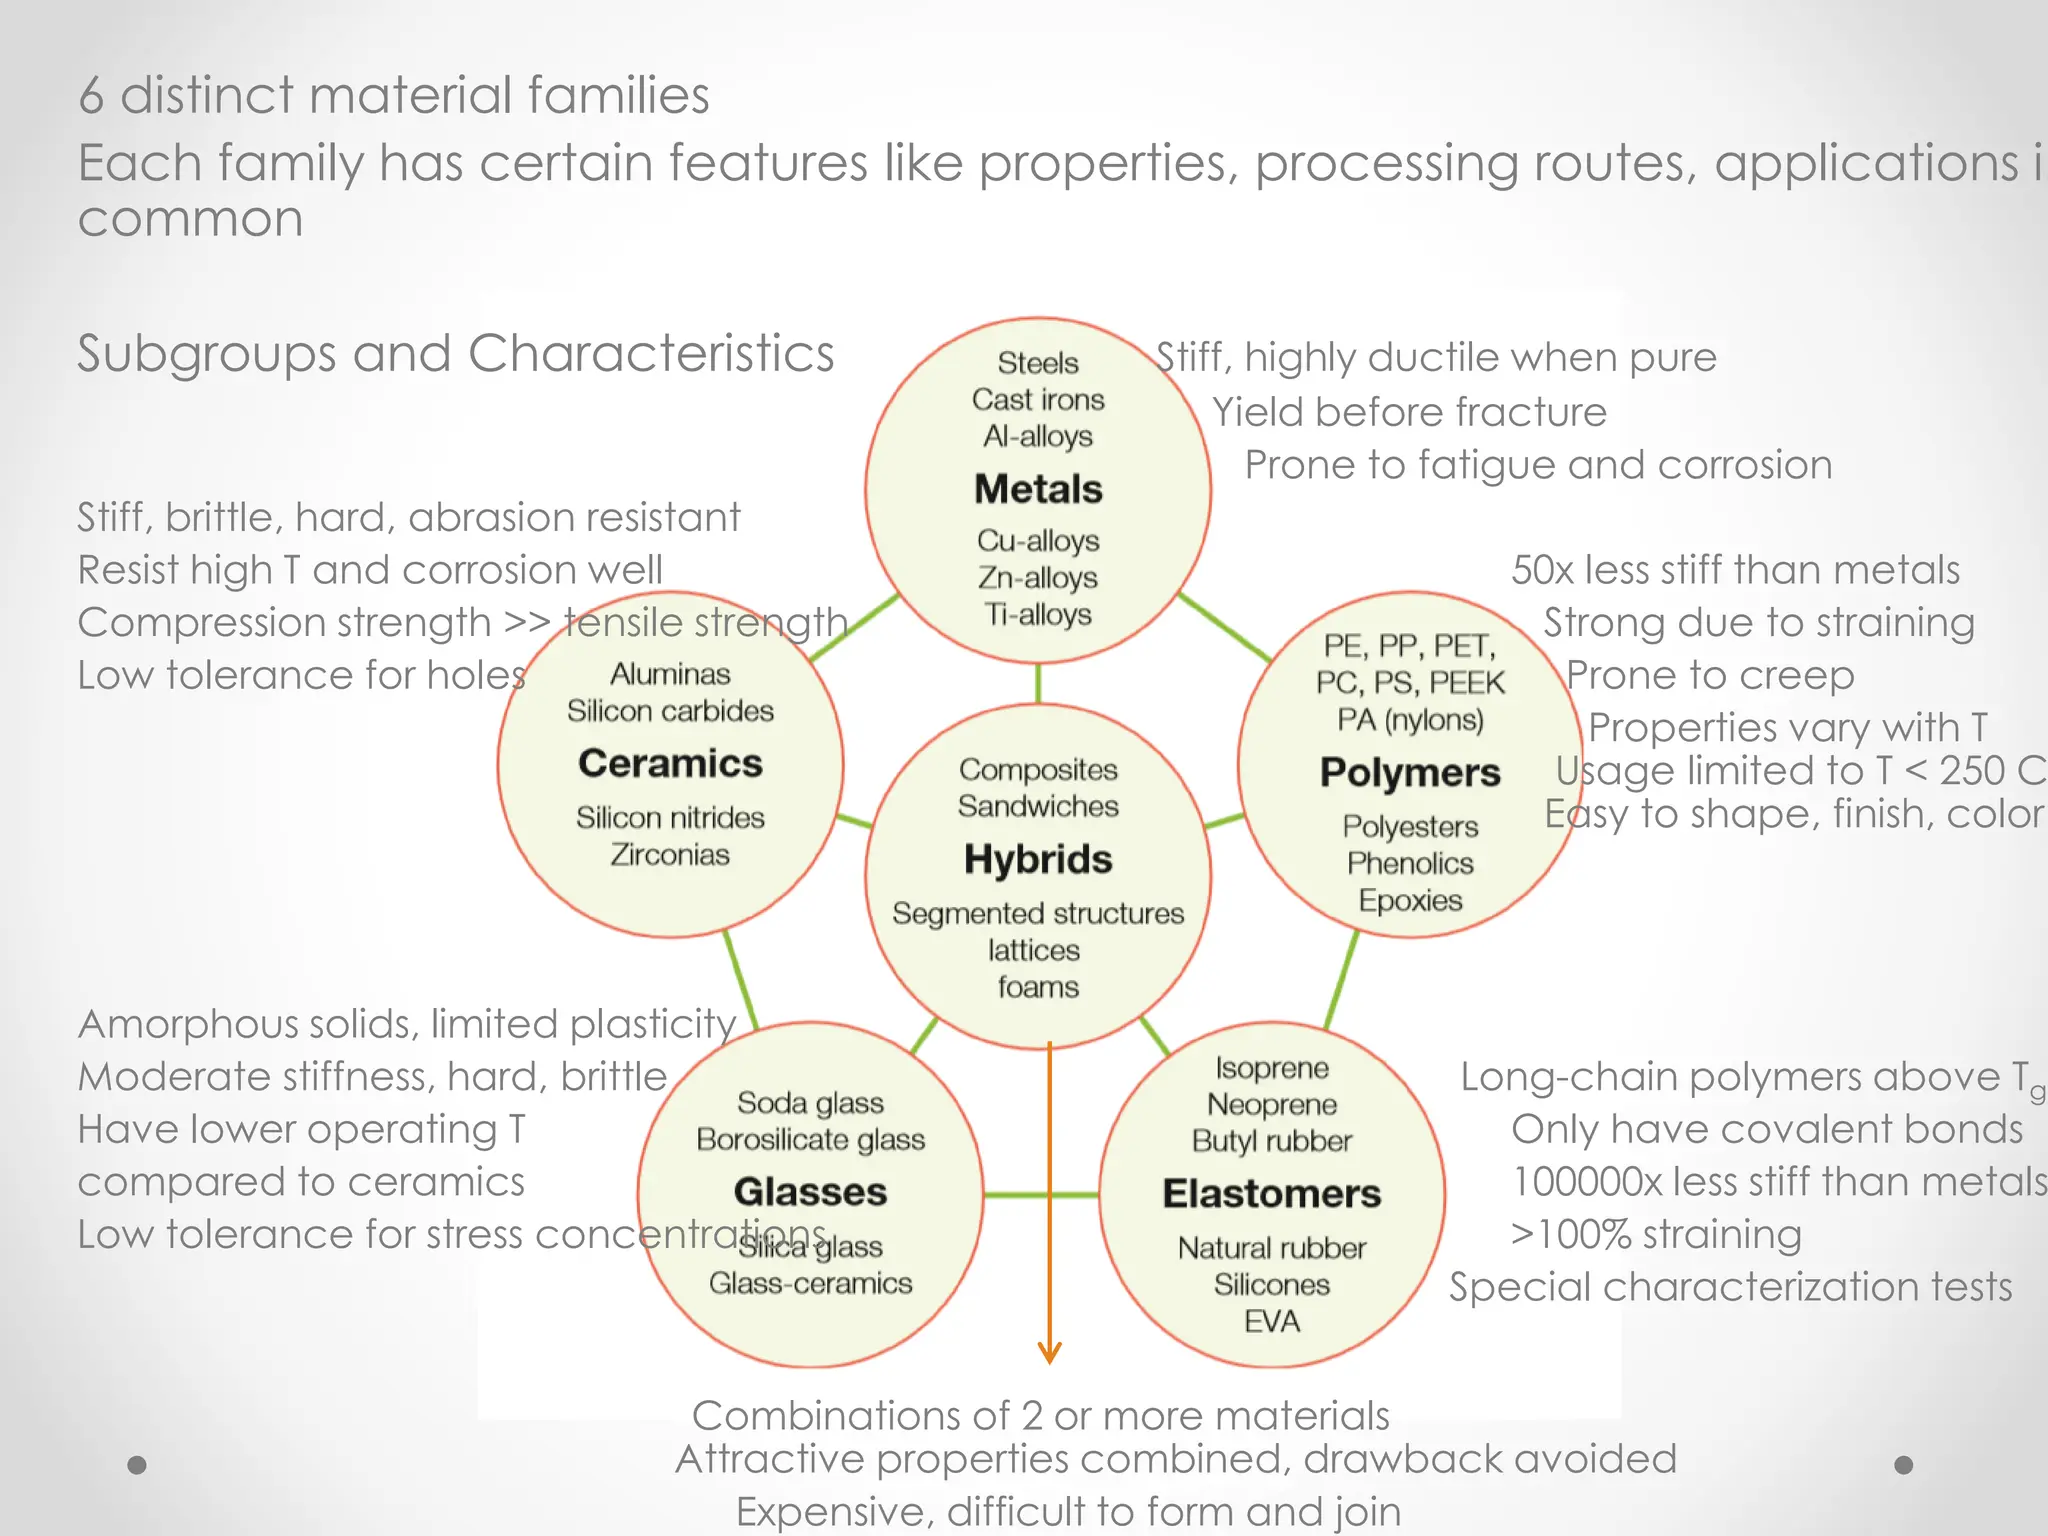
6 distinct materialfamilies
Each family has certain features like properties, processing routes, applications in
common
Subgroups and Characteristics Stiff, highly ductile when pure
Yield before fracture
Prone to fatigue and corrosion
Stiff, brittle, hard, abrasion resistant
Resist high T and corrosion well 50x less stiff than metals
Compression strength >> tensile strength Strong due to straining
Low tolerance for holes Prone to creep
Properties vary with T
Usage limited to T < 250 C
Easy to shape, finish, color
Amorphous solids, limited plasticity
Moderate stiffness, hard, brittle Long-chain polymers above Tg
Have lower operating T Only have covalent bonds
compared to ceramics 100000x less stiff than metals
Low tolerance for stress concentrations >100% straining
Special characterization tests
Combinations of 2 or more materials
Attractive properties combined, drawback avoided
Expensive, difficult to form and join
4.
Gathering the materialsinformation
Engineers select materials conservatively due to the lack of confidence in new
materials
Data for new, emerging materials may be incomplete or untrustworthy
Old, well-tried materials have established, reliable and easily found data
Yet innovation is often made possible by new materials
Data quality is important – Properties in data sheet should be guaranteed,
structured, rankable
5.
Structured properties enableengineers rank the candidate materials and filter
them with respect to the desired properties
More information on each qualified material is needed as the material pool
narrows
This supporting information or documentation of a material includes:
All its strengths
All its weaknesses
Possible processes to shape it
Possible processes to join it
Application history
Failure analysis
Supporting information is documented in
handbooks, design guidelines, failure analyses,
case studies
Certain parts may be available for one
material and may not be available for
another
6.
Material uses aresubject to standards and codes which refer to material classes or
subclasses
For a material to be used in contact with food, drug, or biological environment, it
must have FDA approval
Metals and composites to be used in US military aircraft must have military approval
Most commercially produced metals in Turkey conform to TSE standards
Most commercially produced conventional whiteware goods conform to TSE
standards
To qualify for best-practice design for the environment, material usage must
conform to ISO 14040 guidelines
All the necessary information for a material to convert to a successful product is
knowledge
7.
Basic design limitingmaterial properties and their SI units
Density is measured simply
using Archimedes’ method
by weighing in air and in a
fluid of known density
Price, $/kg fluctuates
depending on time,
quantity you want and your
status as a preferred
customer with the vendor
An approximate price is
used in the early stages of
material selection
8.
Mechanical properties
Elastic modulus,E is the slope of
the initial linear-elastic part of
the stress-strain curve
Moduli measured as slopes of
stress-strain curves are
inaccurate, about half the real
value because of contributions
to the strain from inelasticity,
creep and other factors
Moduli are accurately
measured dynamically by
measuring the velocity of
sound waves in the material
9.
Mechanical properties
Moduli inan isotropic material are related in the following ways:
Commonly, ν ≈1/3, G≈3E/8, K≈E But for elastomers, ν ≈1/2, G≈E/3, K>>E
In an axial loading,
Poisson’s ratio, ν is the negative of the
ratio of the lateral strain, εx to the axial
strain, εy
𝜈 = −
𝜀𝑥
𝜀𝑦
E describes response to tensile or
compressive axial loading
G describes response to shear loading
K describes response to hydrostatic
pressure
𝐸 =
3𝐺
1 +
𝐺
3𝐾
𝐺 =
𝐸
2 1 + 𝜈
𝐾 =
𝐸
3 1 − 2𝜈
10.
Strength of asolid requires careful definition
σf for metals is identified with the 0.2% offset yield strength σy and is the same in
tension and compression
σf for polymers is identified as the stress at which the stress-strain curve
becomes linear, at a strain typically of 1%
Polymers are stronger in compression (20%) than in tension
σf for ceramics and glasses depend on the mode of loading
In tension strength means the fracture strength, σt
In compression it means the crushing strength, σc Typically σc = 10-15 σt
11.
When a materialis difficult to grip,
as is a ceramic, its strength can be
measured in bending
The flexural strength or modulus of
rupture, σflex is the maximum
surface stress in a bent beam at
the instant of failure
For ceramics, σflex=1.3 σt because
the volume subjected to the
maximum stress is small and the
probability of a large flaw lying in it
is correspondingly small
12.
Strength of acomposite is best defined by a deviation from linear-elastic
behavior, an offset of 0.5% is taken
Composites that contain fibers, including natural composites such as wood are
slightly weaker in compression (up to 30%) than in tension because fibers
buckle
σf for composites is identified as the tensile strength σt
Hence strength depends on material class and on mode of loading
Other modes of loading are possible such as shear loading
Yield under multiaxial loads is related to that in simple tension by a yield
function
For metals:
where 𝜎1, 𝜎2, 𝜎3 are the principal stresses, positive when tensile
𝜎1 is the greatest, 𝜎3 the smallest
𝜎1 − 𝜎2
2
+ 𝜎2 − 𝜎3
2
+ 𝜎3 − 𝜎1
2
= 2𝜎𝑓
2
13.
The tensile orultimate strength σts is the nominal stress at which a round bar of
the material that is loaded in tension separates
For metals, ductile polymers and most composites, it is greater than the yield
strength by a factor of 1.1 – 3 because of work hardening or load transfer to
the reinforcement
It is the same as the failure strength in tension for brittle solids like ceramics,
glasses and brittle polymers
14.
Cyclic loading cancause a crack to nucleate and grow in a material, resulting
in fatigue failure
There exists a fatigue or endurance limit σe for many materials
It is the stress amplitude Δσ below which fracture does not occur or occurs
after a very large number of cycles
15.
Hardness
The hardness testgives an approximate, nondestructive measure of the
strength while tensile and compression tests need a large sample and destroy it
Hardness, H of a material is
measured by pressing a
pointed diamond or
hardened steel ball into the
material’s surface
Hardness is defined as the
indenter force divided by the
projected area of the indent
16.
Hardness is commonlyreported in a wide range of units other than MPa
The most common is the Vickers, Hv scale with units of kg/mm2
H ≈ 3σf, Hv = H/10
17.
Toughness, G1c (kJ/m2)and the fracture toughness, K1c (MPa/m1/2) measure the
resistance of a material to the propagation of a crack
Fracture toughness is measured by loading a sample containing a deliberately
introduced crack of length 2c, recording the tensile strength σ* at which the
crack propagates
Where Y is a geometric factor
near unity that depends on
details of the sample
geometry, E is Young’s
modulus and ν is Poisson’s
ratio
𝐾1𝑐 = 𝑌𝜎∗
𝜋𝑐
𝐺1𝑐 =
𝐾1𝑐
2
𝐸 1 + 𝜈
18.
The loss coefficient,η is a dimensional quantity that measures the degree to
which a material dissipated vibrational energy
If a material is loaded elastically to a stress σmax, it stores an elastic energy U
per unit volume
𝑈 =
0
𝜎𝑚𝑎𝑥
𝜎𝑑𝜀 ≈
1
2
𝜎𝑚𝑎𝑥
2
𝐸
If it is then unloaded, it dissipates an energy ΔU
∆𝑈 = 𝜎𝑑𝜀
The value of loss coefficient depends
on the time scale or frequency of cycling
19.
The loss ofa material when surfaces slide against each other or Wear, is a
multibody problem
When solids slide, the volume of material lost from one surface, per unit
distance slid, is called the wear rate, W (m2)
The wear resistance of a surface is characterized by the Archard wear
constant, KA (1/MPa)
𝑊
𝐴
= 𝐾𝐴𝑃
Where A is the area of the slider surface
and P is the normal force pressing it onto
the other surface
20.
Thermal properties
Two temperatures,the melting temperature Tm, and the glass transition
temperature Tg, are fundamental because they relate directly to the strength
of the bonds in the solid
Crystalline solids have a sharp melting point, Tm
Noncrystalline solids do not, the glass transition temperature Tg characterizes
the transition from true solid to very viscous liquid
The maximum service temperature Tmax is the highest temperature at which the
material can reasonably be used without oxidation, chemical change or
creep
The minimum service temperature Tmin is the temperature below which the
material becomes brittle or otherwise unsafe to use
21.
The rate atwhich heat is conducted through a solid at steady state is
measured by the thermal conductivity, λ (W/mK)
It is measured by recording the heat flux q flowing through the material from a
surface at higher temperature T1 to a lower one at temperature T2 separated
by a distance X
𝑞 = −𝜆
𝑑𝑇
𝑑𝑋
= 𝜆
𝑇1 − 𝑇2
𝑋
22.
The heat capacityor specific heat C (J/kgK) is the energy to heat 1 kg of a
material by 1 K
The heat capacity is measured by calorimetry which is also the standard way
of measuring the glass transition temperature
A measured quantity of energy is pumped into a sample of a material of
known mass while the temperature rise is measured
23.
Most materials expandwhen they are heated
The thermal strain per degree of temperature schange is measured by the
linear thermal expansion coefficient, α (1/K)
The thermal shock resistance, ΔT (K) is the maximum temperature difference
through which a material can be quenched without damage
24.
The electrical resistivity,ρe (Ωm) is the resistance of a unit cube with unit
potential difference between a pair of its faces
It ranges from 10-8 for good conductors to more than 1016 for the best insulators
The electrical conductivity, κe (Siemens/m) is the reciprocal of the resistivity
When an insulator is placed in an electric field, it becomes polarized and
charges appear on its surfaces
that tend to screen the
interior from the electric field
Dielectric constant, εγ
measures the tendency of an
insulating material to polarize
25.
All materials allowfor some passage of light, although it is exceedingly small for
metals
The speed of light v in the material is always less than that c in vacuum
A consequence of that is a beam of light striking the surface of such a material
at an angle of incidence α, enters the material at an angle β, the angle of
refraction
The refractive index, n is
𝑛 =
𝑐
𝜈
=
sin 𝛼
sin 𝛽
It is related to the dielectric constant at the same frequency by
𝑛 ≈ 𝜀𝛾
The refractive index depends on wavelength and thus on the color of the light
The denser the material, and the higher its dielectric constant, the greater the
refractive index
26.
Eco properties
The embodiedenergy (MJ/kg) is the energy required to extract 1 kg of a
material from its ores or feedstock
The associated CO2 footprint (kg/kg) is the mass of carbon diaoxide released
into the atmosphere during the production of 1 kg of material
27.
Materials Selection Diagrams
Materialattributes determine the performance of the design
An efficient way of relating material attributes and property requirements
dictated by the design is the analysis of material selection diagrams
A property can be described simply by a bar graph
However a design constraint is seldom a function of one property
Most design constraints are represented as a combination of material
attributes
For example, strength/density ratio (sf/r) or modulus/density ratio (E/r) are
aimed to be maximized for light weight mechanical design
28.
Most attributes ofengineering materials vary in a wide range and bar graphs
are convinient ways to demonstrate them
29.
Plotting one propertyas a function of another is the convenient way to
demonstrate a wealth of information
30.
The velocity ofsound waves traveling in a material depends on the modulus
and density
This enables the engineer relate the two axes E and ρ on the diagram
The equation forms a straight line for a constant sound wave
Contours of constant wave velocity are material indices
A material index is a parameter combining the significant properties of the
design
Material selection chartsdisplay data for about 30 properties for the families
and classes of materials listed
The list is expanded from the original six families by distinguishing composites
from foams and from natural materials, and by distinguishing the high-strength
technical ceramics from the low-strength, non-technical ceramics
Within each family data are plotted for a representative set of materials that
span the full range of behavior for the class and include the most common
and most widely used members
Diagrams show a range of values of each property of each material as
bubbles within the family envelope
35.
The density ofa solid depends on the atomic weight of its atoms or ions, their
size and the way they are packed
Size and packing of atoms do not affect density much
The spread of density comes mainly from the spread of atomic weight, ranging
from 1 for H2 to 238 for U
The moduli of most materials depend on 2 factors:
Bond stiffness (20-200 N/m for covalent, 10-100 for metallic and ionic, 0.5-2 for
van der Waals and hydrogen bonds)
The lower limit for true solids
Elastomers and foams have moduli lower than 1 GPa
Modulus vs Density Diagram
The definition ofstrength is different for each material family due to different
failure mechanisms
Strength of materials differ widely because of their different lattice resistances
If a unit dislocation step involves breaking strong bonds like covalent, the
material is strong
If it only involves the rupture of weak bonds like van der Waals, the material is
weak
Materials that fail by fracture have very large lattice resistances so that atomic
separation happens first
An important use of the diagram is in materials selection for lightweight
structural design
Strength vs Density Diagram
Springs can bemade of both high tensile strength steel and rubber
The useful comparison of strength to elastic modulus gives the yield strain
𝜎𝑓
𝐸
= 𝜀
Yield strain is the strain at which the material ceases to be linearly elastic
Metals and ceramics that have the highest strengths of all materials have
relatively low yield strain
Composites are close to metals, polymers about 10 times higher and elastomers
have values of
𝜎𝑓
𝐸
larger than any other material family due to their low moduli
Modulus vs Strength Diagram
Many designs thatare for moving parts require stiffness and strength at
minimum weight
The data of the previous diagram is replotted after dividing each material by the
density
Specific properties are measures of mechanical efficiency for the use of the
least mass of material to do the most structural work
Specific Modulus vs Specific Strength Diagram
Increasing the strengthof a material is useful only as long as the material
remains plastic and does not become brittle
Fracture toughness of polymers is about the same as ceramics, however they
are widely used in engineering structures while ceramics are used with caution
The necessary condition for fracture of the component is that sufficient elastic
energy released to supply the surface energy of the two surfaces that are
created
The energy absorbed by fracturing ceramics is only slightly more than the
surface energy
Fracture Toughness vs Modulus Diagram
Fracture Toughness vsStrength Diagram
The stress concentrations at the tip of a crack generates a process zone; a
plastic zone in ductile solids, micro-cracking zone in ceramics, delamination,
debonding and fiber pull-out zone in composites
Diagram shows the size of the zone as broken lines varying from atomic
dimensions for brittle ceramics to almost 1 meter for the most ductile metals
Diagram has application in selecting materials for the safe design of load-bearing
structures
Bells are traditionallymade of bronze but they can be made of glass and even of
silicon carbide if enough care was taken
Metals, glasses and ceramics have low intrinsic damping or internal friction
under right conditions during vibration
A large part of damping in materials is caused by dislocation movement
Heavily alloyed metals like bronze have low loss because the solute pins the
dislocations
Engineering ceramics have low damping because of the high lattice resistance
pinning dislocations
Porous ceramics are filled with cracks, the surfaces of which rub and dissipate
energy when material is loaded
In polymers chain segments slide against each other when loaded and the
relative motion damps energy
Loss Coefficient vs Modulus Diagram
The electrons inmaterials carry kinetic energy and their collisions transmit this
energy resulting in thermal conduction
The same electrons drift through the lattice under a potential gradient, resulting
in electrical conduction
Metals have free flowing electron clouds and have high thermal and electrical
conductivity
In ceramics and polymers electrons do not contribute to thermal conduction,
heat is carried by lattice vibrations of short wavelength
Impurities, lattice defects and surfaces scatter the vibrations resulting in
resistivity
Thermal conductivity vs
Electrical resistivity Diagram
Strength vs Maximumservice T Diagram
Temperature affects material performance in many ways
At high temperature materials experience creep, reduction in
load bearing capacity
Chemical structure of materials change by oxidation and
decomposition at high temperatures
Friction and WearDiagrams
Material surfaces create many problems
When they touch and slide, there is friction and wear
The energy lost through friction and worn equipment creates an enormous cost
The efficiency of machines would be significantly improved using materials with
lower coefficient of frictions
Cost Diagram
Strength, modulusor conductivity of a material do not
fluctuate in time
Cost on the other hand always does
The cost of commodity materials are daily reported in
newspapers and internet
Modulus vs Relativecost Diagram
In design for minimum cost, material selection is guided by
indices that involve modulus, strength and cost per unit
volume
A relative cost per unit volume unit is defined to make
corrections for the influence of inflation and units of currency:
rod
steel
mild
of
Density
Cost/kg
material
of
Density
Cost/kg
,
R
v
C
Steel rod costs about 0.3$/kg at the time of preparation of the diagrams