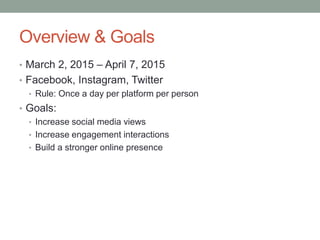
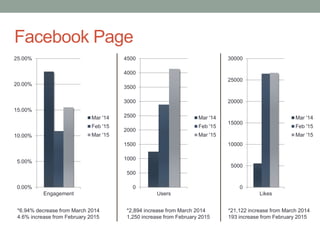
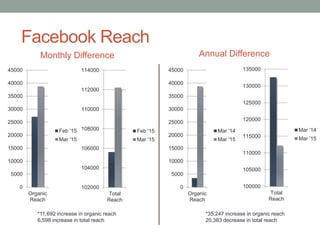
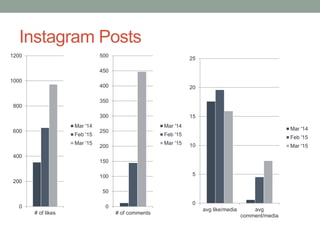
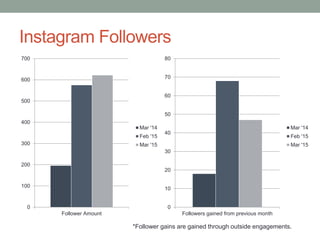
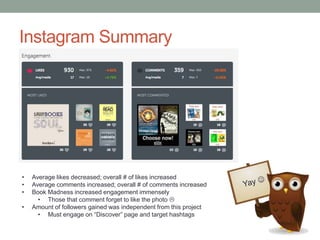
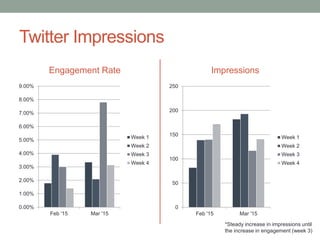
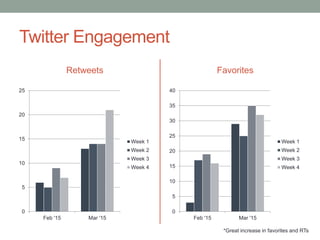
BOOK MADNESS
Social Media Report
Overview & Goals
• March 2, 2015 – April 7, 2015
• Facebook, Instagram, Twitter
• Rule: Once a day per platform per person
• Goals:
• Increase social media views
• Increase engagement interactions
• Build a stronger online presence
Facebook Page
0.00%
5.00%
10.00%
15.00%
20.00%
25.00%
Engagement
Mar '14
Feb '15
Mar '15
0
500
1000
1500
2000
2500
3000
3500
4000
4500
Users
Mar '14
Feb '15
Mar '15
0
5000
10000
15000
20000
25000
30000
Likes
Mar '14
Feb '15
Mar '15
*6.94% decrease from March 2014
4.6% increase from February 2015
*2,894 increase from March 2014
1,250 increase from February 2015
*21,122 increase from March 2014
193 increase from February 2015
Facebook Reach
0
5000
10000
15000
20000
25000
30000
35000
40000
45000
Organic
Reach
Feb '15
Mar '15
Monthly Difference Annual Difference
102000
104000
106000
108000
110000
112000
114000
Total
Reach
Feb '15
Mar '15
*11,692 increase in organic reach
6,598 increase in total reach
0
5000
10000
15000
20000
25000
30000
35000
40000
45000
Organic
Reach
Mar '14
Mar '15
100000
105000
110000
115000
120000
125000
130000
135000
Total
Reach
Mar '14
Mar '15
*35,247 increase in organic reach
20,383 decrease in total reach
Facebook Impressions
0
50,000
100,000
150,000
200,000
250,000
300,000
Organic Total
Feb '15
Mar '15
Monthly Difference Annual Difference
*46,895 increase in organic impressions
5,347 increase in total impressions
*117,180 increase in organic reach
869,312 decrease in total reach
0
200,000
400,000
600,000
800,000
1,000,000
1,200,000
Organic Total
Mar '14
Mar '15
Facebook Paid Reach & Impressions
Paid Reach
0
20000
40000
60000
80000
100000
120000
140000
Paid Reach
Mar '14
Feb '15
Mar '15
Paid Impressions
0
200000
400000
600000
800000
1000000
1200000
Paid Impressions
Mar '14
Feb '15
Mar '15
*Paid impressions explains the huge drop in total reach
& impressions between March 2014 and March 2015
Facebook Negative Feedback
0
20
40
60
80
100
120
Negative Feedback from Users
Mar '14
Feb '15
Mar '15
• 0 negative feedback in March 2014
• 58 negative feedback in February 2015
• 112 negative feedback in March 2015
• The more we post, the more negative
feedback we will get from users
• Hide
• Hide All
• Report Spam
• Page Unlikes
Facebook Summary
• Engagement has increased
• Huge spike in Facebook users
• No significant spike in Page Likes
• Reach more significant than impressions
• (from February 2015 – March 2015)
• Paid reach and impressions dropped significantly
• Negative feedback increased
Instagram Posts
0
5
10
15
20
25
avg like/media avg
comment/media
Mar '14
Feb '15
Mar '15
0
200
400
600
800
1000
1200
# of likes
Mar '14
Feb '15
Mar '15
0
50
100
150
200
250
300
350
400
450
500
# of comments
Mar '14
Feb '15
Mar '15
Instagram Followers
0
10
20
30
40
50
60
70
80
Followers gained from previous month
Mar '14
Feb '15
Mar '15
*Follower gains are gained through outside engagements.
0
100
200
300
400
500
600
700
Follower Amount
Mar '14
Feb '15
Mar '15
Instagram Summary
• Average likes decreased; overall # of likes increased
• Average comments increased; overall # of comments increased
• Book Madness increased engagement immensely
• Those that comment forget to like the photo 
• Amount of followers gained was independent from this project
• Must engage on “Discover” page and target hashtags
Twitter Impressions
Engagement Rate
0.00%
1.00%
2.00%
3.00%
4.00%
5.00%
6.00%
7.00%
8.00%
9.00%
Feb '15 Mar '15
Week 1
Week 2
Week 3
Week 4
Impressions
0
50
100
150
200
250
Feb '15 Mar '15
Week 1
Week 2
Week 3
Week 4
*Steady increase in impressions until
the increase in engagement (week 3)
Twitter Engagement
Retweets
0
5
10
15
20
25
Feb '15 Mar '15
Week 1
Week 2
Week 3
Week 4
Favorites
0
5
10
15
20
25
30
35
40
Feb '15 Mar '15
Week 1
Week 2
Week 3
Week 4
*Great increase in favorites and RTs
Twitter Summary
• Increase in RTs, favorites, and post clicks
• Engagement increased due to increased
interactions
• Follower increase of 196 from February to
March
• Campaign did not have much effect on
followers
Overall Summary
• Facebook
• Engagement and reach increase
• Instagram
• Engagement and comment increase
• Decrease in av. Likes, BUT increase in # of Likes
• Twitter
• RT and favorite increase
• Slight increase in engagement
• Overall we saw an increase in engagement across all 3
platforms. #BookMadness was a success! 

March Madness Report_EXCEL

  • 1.
  • 2.
    Overview & Goals •March 2, 2015 – April 7, 2015 • Facebook, Instagram, Twitter • Rule: Once a day per platform per person • Goals: • Increase social media views • Increase engagement interactions • Build a stronger online presence
  • 3.
    Facebook Page 0.00% 5.00% 10.00% 15.00% 20.00% 25.00% Engagement Mar '14 Feb'15 Mar '15 0 500 1000 1500 2000 2500 3000 3500 4000 4500 Users Mar '14 Feb '15 Mar '15 0 5000 10000 15000 20000 25000 30000 Likes Mar '14 Feb '15 Mar '15 *6.94% decrease from March 2014 4.6% increase from February 2015 *2,894 increase from March 2014 1,250 increase from February 2015 *21,122 increase from March 2014 193 increase from February 2015
  • 4.
    Facebook Reach 0 5000 10000 15000 20000 25000 30000 35000 40000 45000 Organic Reach Feb '15 Mar'15 Monthly Difference Annual Difference 102000 104000 106000 108000 110000 112000 114000 Total Reach Feb '15 Mar '15 *11,692 increase in organic reach 6,598 increase in total reach 0 5000 10000 15000 20000 25000 30000 35000 40000 45000 Organic Reach Mar '14 Mar '15 100000 105000 110000 115000 120000 125000 130000 135000 Total Reach Mar '14 Mar '15 *35,247 increase in organic reach 20,383 decrease in total reach
  • 5.
    Facebook Impressions 0 50,000 100,000 150,000 200,000 250,000 300,000 Organic Total Feb'15 Mar '15 Monthly Difference Annual Difference *46,895 increase in organic impressions 5,347 increase in total impressions *117,180 increase in organic reach 869,312 decrease in total reach 0 200,000 400,000 600,000 800,000 1,000,000 1,200,000 Organic Total Mar '14 Mar '15
  • 6.
    Facebook Paid Reach& Impressions Paid Reach 0 20000 40000 60000 80000 100000 120000 140000 Paid Reach Mar '14 Feb '15 Mar '15 Paid Impressions 0 200000 400000 600000 800000 1000000 1200000 Paid Impressions Mar '14 Feb '15 Mar '15 *Paid impressions explains the huge drop in total reach & impressions between March 2014 and March 2015
  • 7.
    Facebook Negative Feedback 0 20 40 60 80 100 120 NegativeFeedback from Users Mar '14 Feb '15 Mar '15 • 0 negative feedback in March 2014 • 58 negative feedback in February 2015 • 112 negative feedback in March 2015 • The more we post, the more negative feedback we will get from users • Hide • Hide All • Report Spam • Page Unlikes
  • 8.
    Facebook Summary • Engagementhas increased • Huge spike in Facebook users • No significant spike in Page Likes • Reach more significant than impressions • (from February 2015 – March 2015) • Paid reach and impressions dropped significantly • Negative feedback increased
  • 9.
    Instagram Posts 0 5 10 15 20 25 avg like/mediaavg comment/media Mar '14 Feb '15 Mar '15 0 200 400 600 800 1000 1200 # of likes Mar '14 Feb '15 Mar '15 0 50 100 150 200 250 300 350 400 450 500 # of comments Mar '14 Feb '15 Mar '15
  • 10.
    Instagram Followers 0 10 20 30 40 50 60 70 80 Followers gainedfrom previous month Mar '14 Feb '15 Mar '15 *Follower gains are gained through outside engagements. 0 100 200 300 400 500 600 700 Follower Amount Mar '14 Feb '15 Mar '15
  • 11.
    Instagram Summary • Averagelikes decreased; overall # of likes increased • Average comments increased; overall # of comments increased • Book Madness increased engagement immensely • Those that comment forget to like the photo  • Amount of followers gained was independent from this project • Must engage on “Discover” page and target hashtags
  • 12.
    Twitter Impressions Engagement Rate 0.00% 1.00% 2.00% 3.00% 4.00% 5.00% 6.00% 7.00% 8.00% 9.00% Feb'15 Mar '15 Week 1 Week 2 Week 3 Week 4 Impressions 0 50 100 150 200 250 Feb '15 Mar '15 Week 1 Week 2 Week 3 Week 4 *Steady increase in impressions until the increase in engagement (week 3)
  • 13.
    Twitter Engagement Retweets 0 5 10 15 20 25 Feb '15Mar '15 Week 1 Week 2 Week 3 Week 4 Favorites 0 5 10 15 20 25 30 35 40 Feb '15 Mar '15 Week 1 Week 2 Week 3 Week 4 *Great increase in favorites and RTs
  • 14.
    Twitter Summary • Increasein RTs, favorites, and post clicks • Engagement increased due to increased interactions • Follower increase of 196 from February to March • Campaign did not have much effect on followers
  • 15.
    Overall Summary • Facebook •Engagement and reach increase • Instagram • Engagement and comment increase • Decrease in av. Likes, BUT increase in # of Likes • Twitter • RT and favorite increase • Slight increase in engagement • Overall we saw an increase in engagement across all 3 platforms. #BookMadness was a success! 

Editor's Notes

  • #4 ENGAGEMENT: MAR ’14: 22.64% FEB ‘15: 10.91% MAR ‘15: 15.52% USERS: MAR ’14: 1,243 FEB ‘15: 2,887 MAR ‘15: 4,137 LIKES: MAR ’14: 5,535 FEB ‘15: 26,464 MAR ‘15: 26,657
  • #5 ORGANIC REACH: MAR ‘14: 3,493 FEB ‘15: 27,048 MAR ‘15: 38,740 TOTAL REACH: MAR ‘14: 132,597 FEB ‘15: 105,616 MAR ’15: 112,214
  • #6 ORGANIC IMPRESSIONS: MAR ‘14: 17,267 FEB ‘15: 87,552 MAR ’15: 134,447 TOTAL IMPRESSIONS: MAR ‘14: 1,130,514 FEB ‘15: 255,855 MAR ’15: 261,202
  • #7 PAID REACH: MAR ‘14: 129,104 FEB ’15: 78,568 MAR ‘15: 73,474 PAID IMPRESSIONS: MAR ‘14: 1,113,247 FEB ’15: 168,303 MAR ’15: 126,755
  • #10 # OF LIKES: MAR ‘14: 352 FEB ‘15: 627 MAR ‘15: 972 # OF COMMENTS: MAR ‘14: 12 FEB ‘15: 145 MAR ‘15: 447 AVG LIKE PER MEDIA: MAR ‘14: 17.6 FEB ‘15: 19.59 MAR ‘15: 15.93 AVG COMMENT PER MEDIA: MAR ‘14: 0.6 FEB ‘15: 4,53 MAR ‘15: 7.33
  • #13 *INFO TAKEN FROM DAILY/WEEKLY SOCIAL REPORT ENGAGEMENT PERCENTAGE FEB 2015: 1.79% 3.91% 3.01% 1.41% MAR 2015: 3.35% 2.09% 7.89% 3.14% --------------- iMPRESSIONS: FEB 2015: 82 129 140 172 MAR 2015: 182 193 117 141
  • #14 RETWEETS: FEB: 6, 5, 9, 7 MAR: 13, 14, 14, 21 FAVORITES: FEB: 3, 17, 19, 16 MAR: 29, 25, 35, 32