SlideShare a Scribd company logo
1 of 47
Download to read offline
Bringing the potential of
people, nature and
technology together to
create ingredient solutions
that make life better
2019 CAGNY PRESENTATION
1
CONFIDENTIAL
Forward-looking statements
2
This presentation contains or may contain forward-looking statements within the meaning of Section 27A of the Securities Act of 1933, as amended, and Section 21E of the Securities Exchange Act of 1934, as
amended. The Company intends these forward-looking statements to be covered by the safe harbor provisions for such statements.
Forward-looking statements include, among other things, any statements regarding the Company's prospects or future financial condition, earnings, revenues, tax rates, capital expenditures, cash flows,
expenses or other financial items, any statements concerning the Company's prospects or future operations, including management's plans or strategies and objectives therefor and any assumptions,
expectations or beliefs underlying the foregoing. These statements can sometimes be identified by the use of forward looking words such as "may," "will," "should," "anticipate," "assume", "believe," "plan,"
"project," "estimate," "expect," "intend," "continue," "pro forma," "forecast," "outlook," "propels," "opportunities," "potential," “provisional,” or other similar expressions or the negative thereof. All statements
other than statements of historical facts in this release or referred to in this release are "forward-looking statements."
These statements are based on current circumstances or expectations, but are subject to certain inherent risks and uncertainties, many of which are difficult to predict and are beyond our control. Although
we believe our expectations reflected in these forward-looking statements are based on reasonable assumptions, investors are cautioned that no assurance can be given that our expectations will prove
correct.
Actual results and developments may differ materially from the expectations expressed in or implied by these statements, based on various factors, including the effects of global economic conditions, including,
particularly, economic, currency and political conditions in South America and economic and political conditions in Europe, and their impact on our sales volumes and pricing of our products; our ability to
collect our receivables from customers and our ability to raise funds at reasonable rates; fluctuations in worldwide markets for corn and other commodities, and the associated risks of hedging against such
fluctuations; fluctuations in the markets and prices for our co-products, particularly corn oil; fluctuations in aggregate industry supply and market demand; the behavior of financial markets, including foreign
currency fluctuations and fluctuations in interest and exchange rates; volatility and turmoil in the capital markets; the commercial and consumer credit environment; general political, economic, business,
market and weather conditions in the various geographic regions and countries in which we buy our raw materials or manufacture or sell our products; future financial performance of major industries which
we serve, including, without limitation, the food, beverage, paper and corrugating and brewing industries; energy costs and availability; freight and shipping costs,; and changes in regulatory controls regarding
quotas, tariffs, duties, taxes and income tax rates; particularly United States tax reform enacted in 2017; operating difficulties; availability of raw materials, including potato starch, tapioca, gum Arabic and the
specific varieties of corn upon which some of our products are based; our ability to develop or acquire new products and services at rates or of qualities sufficient to meet expectations; energy issues in
Pakistan; boiler reliability; our ability to effectively integrate and operate acquired businesses; our ability to achieve budgets and to realize expected synergies; our ability to achieve expected savings under our
Cost Smart program; our ability to complete planned maintenance and investment projects successfully and on budget; labor disputes; genetic and biotechnology issues; changing consumption preferences
including those relating to high fructose corn syrup; increased competitive and/or customer pressure in the corn-refining industry; and the outbreak or continuation of serious communicable disease or
hostilities including acts of terrorism.
Our forward-looking statements speak only as of the date on which they are made and we do not undertake any obligation to update any forward-looking statement to reflect events or circumstances after
the date of the statement as a result of new information or future events or developments. If we do update or correct one or more of these statements, investors and others should not conclude that we will
make additional updates or corrections. For a further description of these and other risks, see "Risk Factors" included in our Annual Report on Form 10-K for the year ended December 31, 2017 and
subsequent reports on Forms 10-Q and 8-K.
CONFIDENTIAL
Today’s agenda
3
James P. Zallie
President and Chief Executive Officer
Our Strategy to Drive Growth
James Gray
Executive Vice President and Chief Financial Officer
Value Creation and Financial Outlook
Pierre Perez y Landazuri
Senior Vice President
and President, EMEA
Accelerating Customer Co-Creation
and Consumer Preferred Innovation
Jorgen Kokke
Executive Vice President, Global
Specialties and President,
North America
Specialty Growth Platforms
CONFIDENTIAL
500
4
CUSTOMERS IN OVER
120 COUNTRIES
18,000 FIVE-YEAR ADJUSTED
EARNINGS PER SHARE CAGR*
COMPANY
7%
A FORTUNE
$5.8B
26
COUNTRIES WITH
INGREDION OPERATIONS
Ingredion: A leading global ingredient solutions provider
more than
2018 NET SALES
World's Most Admired Companies, FORTUNE Magazine (2009–2019)
World's Most Ethical Companies, The Ethisphere Institute (2013–2018)
Bloomberg Gender-Equality Index (2018–2019)
*CAGR is calculated based on 2013-2018 EPS. See appendix for a reconciliation of these non-GAAP financial measures to U.S. GAAP measures.
CONFIDENTIAL
Ingredion’s unique value proposition in the $155B global ingredient space
5
• Aligned with food and beverage consumer trends and how those
trends are impacting our customer landscape
• Customer intimate with global reach and local touch
• An innovation accelerator from idea to shelf;
making food taste better through texture
• An experienced solution provider combining:
• Food science, applications knowledge and rapid prototyping
• Culinary expertise and sensory science
• Reputable, reliable and trusted sourcing
5
CONFIDENTIAL
Opportunities to sell a broad ingredient portfolio globally
6
66 COUNTRIES WITH >$1 MILLION IN INGREDION SALES PROVIDE ACCESS TO 80% OF WORLD POPULATION
CONFIDENTIAL
CONSUMERS MORE MINDFUL OF
SUGAR CONSUMPTION
Consumer trends create opportunities for Ingredion to make life better
7
39% Would switch to a more
transparent brand1
67% Want to know everything
that goes into their food1
FEWER INGREDIENTS AND SIMPLE
LABELS BUILD UNDERSTANDING
84% Have reduced sugar intake2
50%
Of millennials willing to
pay for the convenience
that food delivery offers3
1: Nielsen 2018 2: Mintel 2018 3: Euromonitor, 2018
CERTIFIED AND TRACEABLE SUPPLY
CHAINS CONVEY TRUST
CONSUMER DEMAND FOR
“FOOD ANYWHERE”
CONFIDENTIAL
Demand for convenience driving “food anywhere” disruption
8
748
869
2017
At Home
Away from Home
U.S. CONSUMER SALES
IN $ BILLIONS
INGREDIENTS THAT PROVIDE A
CONSISTENT PRODUCT
EXPERIENCE TOTHE HOME
USDA Economic Research Service
CONFIDENTIAL
Our strategic initiatives to forge growth
9
Build on our global innovation
strengths aligning with current and
future consumer trends and a
changing customer landscape
Focus and simplify to better
anticipate, execute and operate with
agility to improve productivity and
smartly lower our costs
Accelerate and deliver value
through customer co-creation
and differentiated go-to-market
capabilities
Unleash the potential of our people
by embracing an inclusive culture
supported by contemporary values
and an inspiring core purpose
1
3
2
4
COMMERCIAL EXCELLENCE PURPOSE, CULTURE,VALUES AND TALENT
SPECIALTIES COST SMART
CONFIDENTIAL
Starches
$6
Emulsifiers
$3
Cultures&
Enzymes
$2
Animal
Protein*
$15
Ingredion’s specialty solutions portfolio plays in a big space,
with room for organic growth and acquisitions
$6
~ $155 B1
Global ingredient sales
~ $41 B1
Texture industry sales
Texturizers
10
1Markets and Markets, Technavio, Modor, LMC Global Sweetener Market, LMC Global Starch Market, Giract, Food
Preservatives Market – Global Trends to 2022, Ingredion internal intelligence * Animal protein includes dairy and egg categories. Plant protein includes soy, wheat gluten and other.
10
CONFIDENTIAL
Specialties growth well positioned to exceed 33% of sales by 2022
11
*2022 net sales excludes the impact of pending and future acquisitions
2015 2018 2022*
CONFIDENTIAL
12
Customer Co-Creation and Consumer Preferred Innovation
Sustainable and Trusted Sourcing
Supply Chain and Operational Excellence
Core Food and Industrial Ingredients
Specialty Growth Platforms
VALUE
CREATION
VALUE
CREATION
CLEAN AND SIMPLE
INGREDIENTS
FOOD
SYSTEMS
PLANT-BASED
PROTEINS
STARCH-BASED
TEXTURIZERS
SUGAR REDUCTION
AND SPECIALTY
SWEETENERS
DRIVINGROWTH
Ingredion’s roadmap for value creation
Customer Co-Creation and Consumer Preferred Innovation
Purpose and Performance Driven Culture
CONFIDENTIAL
13
Customer Co-Creation and Consumer Preferred Innovation
STARCH-BASED
TEXTURIZERS
VALUE
CREATION
VALUE
CREATION
>5%
CAGR OF TAPIOCA,
POTATO AND RICE-
BASED SPECIALTY
FOOD STARCHES2
~60%
OF 2018 SPECIALTY
NET SALES
OF NEW PRODUCTS
INTRODUCED WITH
STARCHES IN F&B1
22%
OF PRODUCT
INNOVATION
POSSIBILITIES FROM
14 BASE STARCHES
1000s
INGREDION’S STRENGTH: THE BROADEST AND DEEPEST PORTFOLIO AND EXPERTISE IN THE INDUSTRY
DRIVINGROWTH
STARCH-BASED TEXTURIZERS
1 Innova, 2018 (excluding in alcohol, soda drinks, pet food and supplements)
2 Ingredion Internal Analysis 2017
CONFIDENTIAL
CLEAN AND SIMPLE
INGREDIENTS
14
Customer Co-Creation and Consumer Preferred Innovation
VALUE
CREATION
VALUE
CREATION
DRIVINGROWTH
CLEAN AND SIMPLE FOOD INGREDIENTS
INGREDION’S STRENGTH: A LEADER IN GLOBAL CLEAN LABEL STARCH SOLUTIONS
~$100M
REVENUE GROWTH
OPPORTUNITY
OF CONSUMERS WILLING
TO PAY MORE FOR FOODS
AND DRINKS THAT DON’T
CONTAIN “UNDESIRABLE”
INGREDIENTS2
68%
LAST FIVE YEAR CAGR
(2013-2017) OF
GLOBAL NEW PRODUCT
LAUNCHES WITH CLEAN
LABEL CLAIMS1
12%
1 Innova, 2018 (excludes Alcohol, Pet Food, Soft Drinks and Supplements)
2 Nielsen Product Insider (US)
3 Ingredion Proprietary Global Clean Label Study 2017 (Top Two Box, Very/Quite Important)
GLOBAL CONSUMERS
WHO WANT TO BUY
F&B PRODUCTS WITH
“SHORT AND SIMPLE”
INGREDIENT LISTS3
79%
CONFIDENTIAL
PLANT-BASED
PROTEINS
15
Customer Co-Creation and Consumer Preferred Innovation
VALUE
CREATION
VALUE
CREATION
1, 2, 3 Innova 2018
DRIVINGROWTH
PLANT-BASED PROTEINS
INGREDION’S STRENGTH: NUTRITIONAL AND TEXTURAL FORMULATING CAPABILITIES
UNDERPINNED BY SUPPLY CHAIN EXCELLENCE AND SUSTAINABLE SOURCING
~$100M
REVENUE OPPORTUNITY LAST THREE YEAR U.S.
CAGR OF PLANT-BASED
NON-SOY PROTEIN
CONSUMPTION2
51%
2012-2017 INCREASE OF
FOOD LAUNCHES WITH
DRY MILLED PULSE
INGREDIENTS1
19%
PERCEIVE PLANT-BASED
PROTEINS AS
BETTER FOR THE
ENVIRONMENT3
57%
CONFIDENTIAL
16
Customer Co-Creation and Consumer Preferred Innovation
VALUE
CREATION
VALUE
CREATION
SUGAR REDUCTION
AND SPECIALTY
SWEETENERS
1 Innova 2018
2 Nielsen Product Insider 52 weeks ending 12/30/2017
3 Mintel
DRIVINGROWTH
SUGAR REDUCTION AND SPECIALTY SWEETENERS
INGREDION’S STRENGTH: LOW/NO SUGAR, NATURE-BASED SOLUTIONS ENABLED BY WORLD-CLASS
SENSORY AND FORMULATING CAPABILITIES
>$100M
REVENUE OPPORTUNITY 2013-2017 CAGR OF
NEW PRODUCT LAUNCHES
WITH NO/LOW SUGAR
CLAIMS2
17%
2015-2018 CAGR OF
NEW PRODUCT LAUNCHES
CONTAINING STEVIA1
16%
OF NORTH AMERICAN
CONSUMERS REDUCED
SUGAR INTAKE IN
20173
84%
CONFIDENTIAL
FOOD
SYSTEMS
Customer Co-Creation and Consumer Preferred Innovation
VALUE
CREATION
VALUE
CREATION
DRIVINGROWTH
FOOD SYSTEMS
INGREDION’S STRENGTH: ABILITY TO COMBINE DEEP UNDERSTANDING OF INGREDIENT FUNCTIONALITY
WITH FORMULATION SCIENCE TO CREATE UNIQUE, VALUE-ADDED SOLUTIONS
~$85M
REVENUE GROWTH
OPPORTUNITY
CAGR 2013-18 OF
SYSTEMS USED BY SMALL,
FAST-GROWING FOOD
COMPANIES (<$200M)1
17%
VALUE VS. INGREDION
SPECIALTY AVERAGE
2X
OF TOTAL SIZE OF
OPPORTUNITY FOR STARCH
/ HYDROCOLLOID SYSTEMS2
$2.5B
1 Innova 2018
2 Ingredion Proprietary Study 2017
17
CONFIDENTIAL
Fusing culinary arts and food science are key customer enablers for growth
18
VALUE
CREATION
VALUE
CREATION
DRIVINGROWTH
Customer Co-Creation and Consumer Preferred Innovation
SENSORY SCIENCE
CONSUMER INSIGHTS
APPLICATIONS KNOW-HOW FOOD SCIENCE
CULINARY SKILLS
CONFIDENTIAL
SUGAR REDUCTION
AND SPECIALTY
SWEETENERS
19
Customer Co-Creation and Consumer Preferred Innovation
VALUE
CREATION
VALUE
CREATION
LOW-SUGAR DRINKABLE YOGURT
Accelerating customer co-creation and consumer-preferred innovation
DRIVINGROWTH
CREATION
CHALLENGE:
A reduced sugar solution
that helps maintains texture
and taste, avoiding “added
sugar” label
Stevia/functional ingredient system,
combined with formulation and
sensory expertise to deliver
required mouthfeel
FOOD
SYSTEMS
CONSUMER-PREFERRED
SOLUTION:
CONFIDENTIAL
CLEAN AND SIMPLE
INGREDIENTS
20
Customer Co-Creation and Consumer Preferred Innovation
VALUE
CREATION
VALUE
CREATION
INDULGENT SPREADABLE CHEESE
Accelerating customer co-creation and consumer-preferred innovation
DRIVINGROWTH
Grocery store brand looking to
reduce costs in spreadable
cheese while maintaining taste
and imparting a creamy texture
Replaced milk fat with a
specialty starch with an
indulgent taste while delivering
an affordable recipe
CREATION
CHALLENGE:
CONSUMER-PREFERRED
SOLUTION:
CONFIDENTIAL
21
Customer Co-Creation and Consumer Preferred Innovation
STARCH-BASED
TEXTURIZERS
Customer Co-Creation and Consumer Preferred Innovation
VALUE
CREATION
VALUE
CREATION
GLUTEN-FREE FROZEN PIZZA DOUGH
Accelerating customer co-creation and consumer-preferred innovation
DRIVINGROWTH
A fast food chain
wanted to prevent its
frozen gluten-free pizza
dough from cracking
Introduced nature-based
functional ingredients which
imparted dough elasticity
CREATION
CHALLENGE:
CONSUMER-PREFERRED
SOLUTION:
CONFIDENTIAL
CLEAN AND SIMPLE
INGREDIENTS
22
Customer Co-Creation and Consumer Preferred Innovation
VALUE
CREATION
VALUE
CREATION
FIBER-ADDED MULTIGRAIN BREAD
Accelerating customer co-creation and consumer-preferred innovation
DRIVINGROWTH
Impart desirable texture
and taste while improving
the fiber content of
multigrain bread
Added a clean label,
high-fiber starch that
imparts dietary fiber and
delivers on taste
CREATION
CHALLENGE:
CONSUMER-PREFERRED
SOLUTION:
STARCH-BASED
TEXTURIZERS
CONFIDENTIAL
PLANT-BASED
PROTEINS
23
Customer Co-Creation and Consumer Preferred Innovation
VALUE
CREATION
VALUE
CREATION
NON-GMO CHICKPEA FLOUR PASTA
Accelerating customer co-creation and consumer-preferred innovation
DRIVINGROWTH
A grocery store brand
pasta seeking functional and
nutritious non-GMO and
clean label ingredients that
were sustainably sourced
Chickpea flour was used along
with Ingredion's formulation
expertise to maintain the
desired pasta cooking and
eating experience
CREATION
CHALLENGE:
CONSUMER-PREFERRED
SOLUTION:
CONFIDENTIAL
24
Customer Co-Creation and Consumer Preferred Innovation
Purpose and Performance Driven Culture
Sustainable and Trusted Sourcing
VALUE
CREATION
VALUE
CREATION
METRIC TONS OF CROPS
SUSTAINABLY SOURCED
GLOBALLY IN 2018
100%
OF MANUFACTURING SITES WITH
3RD-PARTY RESPONSIBLE
SOURCING AUDITS
2M
Over a decade of supplying sustainable, identity-preserved ingredients
DRIVINGROWTH
CONFIDENTIAL
25
Customer Co-Creation and Consumer Preferred Innovation
Purpose and Performance Driven Culture
Sustainable and Trusted Sourcing
Supply Chain and Operational Excellence
VALUE
CREATION
VALUE
CREATION
NET SALES: $3,511 M, 60% OF INGREDION
POPULATION: 493 M, 7% OF WORLD
CUSTOMERS: 39% OF INGREDION
NET SALES: $943 M, 16% OF INGREDION
POPULATION: 424 M, 6% OF WORLD
CUSTOMERS: 21% OF INGREDION
NET SALES: $584 M, 10% OF INGREDION
POPULATION: 2.2 B, 30% OF WORLD
CUSTOMERS: 15% OF INGREDION
NET SALES: $803 M, 14% OF INGREDION
POPULATION: 4.3 B, 57% OF WORLD
CUSTOMERS: 25% OF INGREDION
We are excited about the breadth of our global opportunities
DRIVINGROWTH
Value Creation and
Financial Outlook
James Gray
EVP and CFO
26
CONFIDENTIAL
Finance recap
27
2017 2018 2019
Net Sales $5.8B $5.8B
flat
Net sales
expected up
Adjusted Operating Income $878MM* $767MM*
(13%)
Adj. Op Inc
expected flat to
slightly up
Reported Operating Income $836MM* $703MM*
(16%)
• North America
– Lower sweetener volumes
– Higher supply chain costs
• Commodity margin pressures
• FX devaluations
CONFIDENTIAL
Cost Smart working to mitigate inflation
28
• Cessation of wet milling in Stockton, CA
– Reduced HFCS manufacturing footprint
• Global procurement
• Freight bid process redesign
• Organizational reviews
• Shared Service Centers in Tulsa, OK
and Guadalajara, Mexico
• Zero-based budgeting on all other
SG&A (excluding comp and benefits)
CONFIDENTIAL
Specialty growth platforms are sources of profit growth
29
Net sales in billions
71%
29%
33%-36%
Starch-Based
Texturizers
Clean & Simple Ingredients
Sugar Reduction &
Specialty Sweeteners
Food Systems
Specialty
Remaining
Percent of
Expected Adj.
Op Income*
2018 2022
Plant-Based Proteins
Specialty
Remaining
53%-56%
44%-47%
48%
52%
$5.8
$6.4
Specialty
Remaining
Total
Note: See appendix for a reconciliation of these non-GAAP financial measures to U.S. GAAP measures
The company’s long-term objectives are considered internal goals and as such, do not represent guidance
Represents real gross margin absolute dollar growth; actual margins vary due to pass-through of changes in raw material costs and FX
Net sales growth objective assumes constant currency and corn/raw material costs equivalent to 2018
Mid Single Digit to
High Single Digit
1% - 4%
Flat to
Low Single Digit
2018 – 2022 CAGR
x
*Items below gross profit were allocated between Core and Specialty using either net sales or judgmentally based on nature of costs
67%-64%
CONFIDENTIAL
Four-year profit growth outlook
30
The company’s long-term objectives are considered internal goals and as such, do not represent guidance
Represents real gross margin absolute dollar growth; actual margins vary due to pass-through of changes in raw material costs and FX
Net sales growth objective assumes constant currency and corn/raw material costs equivalent to 2018
Net Sales Adjusted EPS
Operating Income
1%
4%
Mid Single Digit
High Single Digit
1%
CONFIDENTIAL
Consistent cash generation provides fuel to deploy toward strategic growth
31
$700
$650
Cash Flow
from
Operations
CapEx Dividends Free Cash
Flow After
Dividends
$ Millions
2019E Annual Cash Flows
-
~$200 -
$115
~$175
$360-
$330
Note: See appendix for a reconciliation of these non-GAAP financial measures to U.S. GAAP measures.
Cash principles
• Invest in growth projects and
specialty CapEx
• Pursue value-enhancing acquisitions
• Maintain investment-grade status
CONFIDENTIAL
Room within strong balance sheet to enable acquisitions
32
2016 2017 2018
Investment Grade Rating
- S&P and Fitch
- Moody’s
BBB
Baa2
BBB
Baa2
BBB
Baa1
Net Debt / Adjusted EBITDA*
1.4x 1.2x 1.8x
Net Debt to Capitalization*
34% 29% 40%
*Note: See appendix for a reconciliation of these non-GAAP financial measures to U.S. GAAP measures.
CONFIDENTIAL
Purpose-driven M&A to accelerate our Specialty Growth Platforms
33
NAME CHANGE
PORTFOLIO
EXPANSION
POTATO-BASED
INGREDIENTS
PORTFOLIO EXPANSION
FRUIT AND VEGETABLE
INGREDIENTS
PORTFOLIO
EXPANSION
RICE-BASED
INGREDIENTS
SHANDONG
HUANONG
CAPACITY EXPANSION
IN ASIA-PACIFIC
2010 2012 2015 2016
PORTFOLIO
EXPANSION
HYDROCOLLOID
INGREDIENTS
TRANSFORMATIVE
TRANSACTION
PORTFOLIO
EXPANSION
2017
(BANGLEN)
2018
SOUTH
SIOUX CITY
CAPACITY EXPANSION
IN NORTH AMERICA
JOINT VENTURE
PLANT-BASED
PROTEINS
STRATEGIC ALLIANCE
SUGAR REDUCTION
ALLULOSE
®*
*ASTRAEA® is trademark of Matsutani Chemical Industry Co., Ltd. Used with permission
CONFIDENTIAL
2009* 2010* 2011* 2012* 2013 2014* 2015* 2016* 2017* 2018* 2019* 2020 2022
Delivering adjusted EPS growth toward long-term target
34
Note: CAGR is calculated based on adjusted EPS for 2009 – 2012, and 2014 - 2018. CAGR are calculated based on 2018.
See appendix for a reconciliation of these non-GAAP financial measures to U.S. GAAP measures.
2019 Adj. EPS
Guidance
$6.80 - $7.50
10Year Adj. EPS CAGR: 7%
5 Year Adj. EPS CAGR: 7%
4 Year Profit
Growth Outlook
High Single Digit
Adjusted EPS
2020-
2021
CONFIDENTIAL
Four-year profit growth outlook (2018-2022)
35
• Specialty ingredients target >$2 billion of net sales
• Specialty ingredients target of 33-36% of net sales
• One percentage point margin expansion target*
• High single-digit targeted adjusted EPS Growth
• Target ROCE greater than 10%
Note: The company’s long-term objectives are considered internal goals based on 2018 year-end and as such, do not represent guidance
* Represents real margin absolute dollar growth; actual margins vary due to pass-through of changes in raw material costs and FX
CONFIDENTIAL
36
Customer Co-Creation and Consumer Preferred Innovation
Purpose and Performance Driven Culture
Customer Co-Creation and Consumer Preferred Innovation
Sustainable and Trusted Sourcing
Supply Chain and Operational Excellence
Core Food and Industrial Ingredients
Specialty Growth Platforms
VALUE
CREATION
VALUE
CREATION
CLEAN AND SIMPLE
INGREDIENTS
FOOD
SYSTEMS
PLANT-BASED
PROTEINS
STARCH-BASED
TEXTURIZERS
SUGAR REDUCTION
AND SPECIALTY
SWEETENERS
DRIVINGROWTH
Ingredion’s roadmap for value creation
CONFIDENTIAL
Questions and Answers
37
We bring the potential of people, nature, and technology together
to create ingredient solutions that make life better.
CONFIDENTIAL
38
APPENDIX
CONFIDENTIAL
Solid returns and financial performance
39
2016 2017 2018
Specialty % of Net Sales 26% 28% 29%
Gross Profit Margin % 25% 25% 23%
Return on Capital Employed*
12.6% 12.3% 11.0%
Dividends Paid per Share $1.85 $2.10 $2.43
Total Shareholder Payout*
21% 47% 167%
*See appendix for a reconciliation of these non-GAAP financial measures to U.S. GAAP measures.
CONFIDENTIAL
Reconciliation of non-GAAP net income and earnings per share
40
(in millions) EPS (in millions) EPS (in millions) EPS (in millions) EPS (in millions) EPS (in millions) EPS (in millions) EPS (in millions) EPS (in millions) EPS (in millions) EPS
Net income attributable to Ingredion $41 $0.54 $169 $2.20 $416 $5.32 $428 $5.47 $396 $5.05 $355 $4.74 $402 $5.51 $485 $6.55 $519 $7.06 $443 $6.17
Add back (deduct):
$110 1.47 $22 0.29 $6 0.08 $23 0.29 - - $33 0.44 $19 0.25 $14 0.20 $31 0.42 $51 0.71
- - $26 0.34 $20 0.26 $2 0.03 - - $1 0.02 $7 0.10 $2 0.03 $3 0.04 - -
- -
$18 0.23 - - - - - - - - $7 0.09 - - $6 0.08 - -
Bridge loan fees, net of income tax benefit of $6.9 million $13 0.16 - - - - - - - - - - - - - -
$1 0.02 - - - - - - - - - - - - - -
- - - - ($18) (0.23) ($3) (0.04) - - - - - - - - - -
NAFTA award - - - - ($58) (0.75) - - - - - - - - - - - -
Reversal of Korean deferred tax asset valuation allowance - - - - - - ($13) (0.16) - - - - - - - - - -
- - - - - - ($2) (0.02) - - - - (9) (0.12) - - - -
Litigation settlement, net of income tax benefit of $2.5 million 4 0.06 - -
Income tax settlement 27 0.36 (10) (0.14) - -
Income tax reform 23 0.31 3 0.04
Insurance proceeds, net of income tax benefit of $3.3 million (6) (0.08) - -
Non-GAAP adjusted net income $151 $2.01 $249 $3.24 $366 $4.68 $435 $5.57 $396 $5.05 $389 $5.20 $430 $5.88 $528 7.13 $566 $7.70 $497 $6.92
EPS may not foot or recalculate due to rounding.
December 31, 2009 December 31, 2010
Other acquisition-related financing costs, net of income tax benefit of $0.8
million
Gain from change in benefit plans, net of income tax of $11.4 million and $1.4
million for the years ended December 31, 2011 and December 31, 2012,
respectively
Gain from sale of land/plant, net of income tax of $0.4 million and $0.9 million
for the yeas ended December 31, 2012 and December 31, 2015, respectively
Restructuring/impairment charges, net of income tax benefit of $14.7 million,
$2.7 million, $3.5 million, $12.8 million, $0, $0, 9.7 million, $4.7 million, $7.4
million, and $13.0 million for the years ended December 31, 2009, December
31, 2010, December 31, 2011, December 31, 2012, December 31, 2013,
December 31, 2014, December 31, 2015, December 31, 2016, December 31,
2017, and December 31, 2018, respectively.
December 31, 2014
Year Ended Year Ended
December 31, 2015
Year Ended
December 31, 2018
Year Ended
December 31, 2017
Charge for fair value mark-up of acquired inventory, net of income tax benefit
of $9.3 million, $3.8 million, and $3.4 million for the years ended December
31, 2010, December 31, 2015, and December 31, 2017, respectively
Acquisition/integration costs, net of income tax benefit of $9.0 million, $10.2
million, $1.6 million, $0, $0.4 million, $2.9 million, $1.1 million, and $1.3
million for the years ended December 31, 2010, December 31, 2011,
December 31, 2012, December 31, 2013, December 31, 2014, December 31,
2015, December 31, 2016, and December 31, 2017, respectively
Year Ended
December 31, 2016
Year Ended Year Ended Year Ended Year Ended Year Ended
December 31, 2011 December 31, 2012 December 31, 2013
40
CONFIDENTIAL
Reconciliation of non-GAAP adjusted operating income
41
41
Year Ended Year Ended Year Ended Year Ended Year Ended
(in millions, pre-tax) December 31, 2014 December 31, 2015 December 31, 2016 December 31, 2017 December 31, 2018
Operating income 581
$ 653
$ 806
$ 836
$ 703
$
Add back:
Restructuring/impairment charges 33 28 19 38 64
Acquisition/integration costs 2 10 3 4 -
Charge for fair value mark-up of acquired inventory - 10 - 9 -
Insurance proceeds - - - (9) -
Litigation settlement - 7 - - -
Gain on sale of plant - (10) - - -
Non-GAAP adjusted operating income 616
$ 698
$ 828
$ 878
$ 767
$
CONFIDENTIAL
2019 adjusted EPS forecast
42
CONFIDENTIAL
43
Reconciliation of non-GAAP ROCE metric
Return on Capital Employed (dollars in millions)     
Total equity * $ 2,180 $ 2,595 $ 2,917
Add:
Cumulative translation adjustment *   1,025   1,008   951
Share-based payments subject to redemption*   24   30   36
Total debt *   1,838   1,956   1,864
Less:
Cash and cash equivalents *   (434)   (512)   (595)
Capital employed * (a) $ 4,633 $ 5,077 $ 5,173
Operating income $ 806 $ 836 $ 703
Adjusted for:
Restructuring/impairment charges   19   38   64
Acquisition/integration costs   3   4   -
Charge for fair value mark-up of acquired inventory   —   9   —
Insurance proceeds — (9) -
Litigation settlement   —   —   —
Gain on sale of plant   —   —   —
Adjusted operating income $ 828 $ 878 $ 767
Income taxes (at effective tax rates of 28.6%, 29.4%, and
27.5% in 2015, 2016, and 2017, respectively)   (243)   (251)   (198)
Adjusted operating income, net of tax (b) $ 585 $ 627 $ 569
Return on Capital Employed (b/a)   12.6%   12.3%   11.0%
2018
* Balance sheet amounts used in computing capital employed represent beginning of period balances.
2017
2016
CONFIDENTIAL
44
Reconciliation of non-GAAP adjusted effective income tax rate to GAAP effective
income tax rate
Income Before
Income Taxes (a)
Provision for
Income Taxes (b)
Effective Income
Tax Rate (b/a)
Income Before
Income Taxes (a)
Provision for
Income Taxes (b)
Effective Income
Tax Rate (b/a)
Income Before
Income Taxes (a)
Provision for
Income Taxes (b)
Effective Income
Tax Rate (b/a)
As Reported 742
$ 246
$ 33.1% 769
$ 237
$ 30.8% 621
$ 167
$ 26.9%
Add (deduct):
Restructuring/impairment
charges 19 5 38 7 64 13
Acquisition/integration costs 3 1 4 1 - -
Charge for fair value mark-
up of acquired inventory - - 9 3
- -
Insurance proceeds (9) (3)
- -
Litigation settlement - - - - - -
Gain on sale of plant - - - - - -
Income tax settlement - (27) - 10 - -
Income tax reform (23) -3
Adjusted non-GAAP 764
$ 225
$ 29.4% 811
$ 232
$ 28.6% 685
$ 177
$ 25.8%
Net income and tax rates may not foot or recalculate due to rounding.
2018
2016 2017
CONFIDENTIAL
Reconciliation of non-GAAP credit metrics – Net debt to adjusted EBITDA ratio
45
Net Debt to Adjusted EBITDA ratio (dollars in millions)     
Short-term debt $ 106 $ 120 $ 169
Long-term debt   1,850   1,744   1,931
Less: Cash and cash equivalents   (512)   (595)   (327)
Short-term investments   (4)   (9)   (7)
Total net debt (a) $ 1,440 $ 1,260 $ 1,766
Net income attributable to Ingredion $ 485 $ 519 443
Add back (deduct):
Restructuring/impairment charges (i)   19   38   30
Acquisition/integration costs   3   4   —
Charge for fair value mark-up of acquired inventory   —   9   —
Insurance proceeds (9)   —
Litigation settlement   —   —   —
Gain on sale of plant   —   —   —
Net income attributable to non-controlling interest   11   13   11
Provision for income taxes   246   237 167
Financing costs, net of interest income of $11, $10, and $11,
respectively   66   73 86
Depreciation and amortization   196   209 247
Adjusted EBITDA (b) $ 1,026 $ 1,093 $ 984
Net debt to adjusted EBITDA ratio (a/b)   1.4   1.2 1.8
i) 2018 restructuring / impairment charge is reduced above by $34 million to exclude the accelerated depreciation from cessation of wet-milling
at the Stockton, California plant. The accelerated depreciation is included within in Depreciation and amortization above, and to include in
restructuring / impairment charge would include the charge twice. See Note 5 for reconciliation to the $64 million restructuring charges
2018
2016 2017
CONFIDENTIAL
Reconciliation of non-GAAP credit metrics – Net debt to capitalization percentage
46
Net Debt to Capitalization percentage (dollars in millions)       
Short-term debt $ 106 $ 120 $ 169
Long-term debt   1,850   1,744 1,931
Less: Cash and cash equivalents   (512)   (595) (327)
Short-term investments   (4)   (9) (7)
Total net debt (a) $ 1,440 $ 1,260 $ 1,766
Deferred income tax liabilities $ 171 $ 199 $ 189
Share-based payments subject to redemption   30   36   37
Total equity   2,595   2,917   2,408
Total capital $ 2,796 $ 3,152 $ 2,634
Total net debt and capital (b) $ 4,236 $ 4,412 $ 4,400
Net debt to capitalization percentage (a/b)   34.0 %   28.6 %   40.1 %  
December 31,
2017
December 31,
2018
December 31,
2016
CONFIDENTIAL
47
Reconciliation of non-GAAP total shareholder payout metric
Total Shareholder Payout (in Millions)          
Dividends paid to Ingredion shareholders* $ 134 $ 150 $ 173
Add:  
Repurchase of common stock   8 123 657
Less:  
Issuance of common stock for share-based compensation, net of settlements (29) (9) (1)
Total shareholder payments (a) $ 113 $ 264 $ 829
Non-GAAP adjusted net income (b)   528   566   497
     
Total shareholder payout (a/b)   21%   47%   167%
2018
2016 2017
*Dividends paid per Consolidated Statements of Cash Flows less dividends declared to non-controlling interests

More Related Content

Similar to 2019 CAGNY INGR.pdf

Coca Cola Presentation at CAGNY 2021
Coca Cola Presentation at CAGNY 2021Coca Cola Presentation at CAGNY 2021
Coca Cola Presentation at CAGNY 2021Neil Kimberley
 
Pepsico Presentation at 2019 CAGNY
Pepsico Presentation at 2019 CAGNYPepsico Presentation at 2019 CAGNY
Pepsico Presentation at 2019 CAGNYNeil Kimberley
 
Hershey CAGNY 2015
Hershey CAGNY 2015Hershey CAGNY 2015
Hershey CAGNY 2015Neil Kimberley
 
Q2 fy16 earnings slides final
Q2 fy16 earnings slides finalQ2 fy16 earnings slides final
Q2 fy16 earnings slides finalirusfoods
 
20160216 cagny presentation vfinal
20160216 cagny presentation vfinal20160216 cagny presentation vfinal
20160216 cagny presentation vfinalSysco_Investors
 
Hershey Presentatio At CAGNY 2021
Hershey Presentatio At CAGNY 2021Hershey Presentatio At CAGNY 2021
Hershey Presentatio At CAGNY 2021Neil Kimberley
 
20160113 icr presentation vfinal
20160113 icr presentation vfinal20160113 icr presentation vfinal
20160113 icr presentation vfinalSysco_Investors
 
Tsn cagny 2017 presentation slides
Tsn cagny 2017 presentation slidesTsn cagny 2017 presentation slides
Tsn cagny 2017 presentation slidesinvestortyson
 
2019 cagny presentation v final2
2019 cagny presentation v final22019 cagny presentation v final2
2019 cagny presentation v final2SYYIR
 
2018 cagny presentation
2018 cagny presentation2018 cagny presentation
2018 cagny presentationSysco_Investors
 
Pepsico CAGNY 2021
Pepsico CAGNY 2021Pepsico CAGNY 2021
Pepsico CAGNY 2021Neil Kimberley
 
Frgi investor presentation spring 2016
Frgi investor presentation spring 2016Frgi investor presentation spring 2016
Frgi investor presentation spring 2016fiestarestaurant
 
Sysco at 2016 Barclays Global Consumer Staples Conference
Sysco at 2016 Barclays Global Consumer Staples Conference Sysco at 2016 Barclays Global Consumer Staples Conference
Sysco at 2016 Barclays Global Consumer Staples Conference Sysco_Investors
 
Investor deck (fy17 q3) final
Investor deck (fy17 q3) finalInvestor deck (fy17 q3) final
Investor deck (fy17 q3) finalcloroxir2016
 
The Future Of Alcohol Sponsorship
The Future Of Alcohol SponsorshipThe Future Of Alcohol Sponsorship
The Future Of Alcohol SponsorshipClayton T Ford
 
DuPont at Bernstein's 31st Annual Strategic Decisions Conference 2015
DuPont at Bernstein's 31st Annual Strategic Decisions Conference 2015DuPont at Bernstein's 31st Annual Strategic Decisions Conference 2015
DuPont at Bernstein's 31st Annual Strategic Decisions Conference 2015DupontInv
 
Sysco Investor Presentation CAGNY 2015
Sysco Investor Presentation  CAGNY 2015Sysco Investor Presentation  CAGNY 2015
Sysco Investor Presentation CAGNY 2015Sysco_Investors
 
KO 2023 CAGNY Presentation.pdf
KO 2023 CAGNY Presentation.pdfKO 2023 CAGNY Presentation.pdf
KO 2023 CAGNY Presentation.pdfNeil Kimberley
 
General Mills CAGNY 2023.pdf
General Mills CAGNY 2023.pdfGeneral Mills CAGNY 2023.pdf
General Mills CAGNY 2023.pdfNeil Kimberley
 
Q3 FY19 STZ IR Presentation
Q3 FY19 STZ IR PresentationQ3 FY19 STZ IR Presentation
Q3 FY19 STZ IR Presentationconstellationbrands
 

Similar to 2019 CAGNY INGR.pdf (20)

Coca Cola Presentation at CAGNY 2021
Coca Cola Presentation at CAGNY 2021Coca Cola Presentation at CAGNY 2021
Coca Cola Presentation at CAGNY 2021
 
Pepsico Presentation at 2019 CAGNY
Pepsico Presentation at 2019 CAGNYPepsico Presentation at 2019 CAGNY
Pepsico Presentation at 2019 CAGNY
 
Hershey CAGNY 2015
Hershey CAGNY 2015Hershey CAGNY 2015
Hershey CAGNY 2015
 
Q2 fy16 earnings slides final
Q2 fy16 earnings slides finalQ2 fy16 earnings slides final
Q2 fy16 earnings slides final
 
20160216 cagny presentation vfinal
20160216 cagny presentation vfinal20160216 cagny presentation vfinal
20160216 cagny presentation vfinal
 
Hershey Presentatio At CAGNY 2021
Hershey Presentatio At CAGNY 2021Hershey Presentatio At CAGNY 2021
Hershey Presentatio At CAGNY 2021
 
20160113 icr presentation vfinal
20160113 icr presentation vfinal20160113 icr presentation vfinal
20160113 icr presentation vfinal
 
Tsn cagny 2017 presentation slides
Tsn cagny 2017 presentation slidesTsn cagny 2017 presentation slides
Tsn cagny 2017 presentation slides
 
2019 cagny presentation v final2
2019 cagny presentation v final22019 cagny presentation v final2
2019 cagny presentation v final2
 
2018 cagny presentation
2018 cagny presentation2018 cagny presentation
2018 cagny presentation
 
Pepsico CAGNY 2021
Pepsico CAGNY 2021Pepsico CAGNY 2021
Pepsico CAGNY 2021
 
Frgi investor presentation spring 2016
Frgi investor presentation spring 2016Frgi investor presentation spring 2016
Frgi investor presentation spring 2016
 
Sysco at 2016 Barclays Global Consumer Staples Conference
Sysco at 2016 Barclays Global Consumer Staples Conference Sysco at 2016 Barclays Global Consumer Staples Conference
Sysco at 2016 Barclays Global Consumer Staples Conference
 
Investor deck (fy17 q3) final
Investor deck (fy17 q3) finalInvestor deck (fy17 q3) final
Investor deck (fy17 q3) final
 
The Future Of Alcohol Sponsorship
The Future Of Alcohol SponsorshipThe Future Of Alcohol Sponsorship
The Future Of Alcohol Sponsorship
 
DuPont at Bernstein's 31st Annual Strategic Decisions Conference 2015
DuPont at Bernstein's 31st Annual Strategic Decisions Conference 2015DuPont at Bernstein's 31st Annual Strategic Decisions Conference 2015
DuPont at Bernstein's 31st Annual Strategic Decisions Conference 2015
 
Sysco Investor Presentation CAGNY 2015
Sysco Investor Presentation  CAGNY 2015Sysco Investor Presentation  CAGNY 2015
Sysco Investor Presentation CAGNY 2015
 
KO 2023 CAGNY Presentation.pdf
KO 2023 CAGNY Presentation.pdfKO 2023 CAGNY Presentation.pdf
KO 2023 CAGNY Presentation.pdf
 
General Mills CAGNY 2023.pdf
General Mills CAGNY 2023.pdfGeneral Mills CAGNY 2023.pdf
General Mills CAGNY 2023.pdf
 
Q3 FY19 STZ IR Presentation
Q3 FY19 STZ IR PresentationQ3 FY19 STZ IR Presentation
Q3 FY19 STZ IR Presentation
 

Recently uploaded

VIP Call Girls Service Shamshabad Hyderabad Call +91-8250192130
VIP Call Girls Service Shamshabad Hyderabad Call +91-8250192130VIP Call Girls Service Shamshabad Hyderabad Call +91-8250192130
VIP Call Girls Service Shamshabad Hyderabad Call +91-8250192130Suhani Kapoor
 
Pesticide Calculation Review 2013 post.pptx
Pesticide Calculation Review 2013 post.pptxPesticide Calculation Review 2013 post.pptx
Pesticide Calculation Review 2013 post.pptxalfordglenn
 
Food & Nutrition Strategy Baseline (FNS.pdf)
Food & Nutrition Strategy Baseline (FNS.pdf)Food & Nutrition Strategy Baseline (FNS.pdf)
Food & Nutrition Strategy Baseline (FNS.pdf)Mohamed Miyir
 
(ANJALI) Shikrapur Call Girls Just Call 7001035870 [ Cash on Delivery ] Pune ...
(ANJALI) Shikrapur Call Girls Just Call 7001035870 [ Cash on Delivery ] Pune ...(ANJALI) Shikrapur Call Girls Just Call 7001035870 [ Cash on Delivery ] Pune ...
(ANJALI) Shikrapur Call Girls Just Call 7001035870 [ Cash on Delivery ] Pune ...ranjana rawat
 
Call Girls in Nashik Ila 7001305949 Independent Escort Service Nashik
Call Girls in Nashik Ila 7001305949 Independent Escort Service NashikCall Girls in Nashik Ila 7001305949 Independent Escort Service Nashik
Call Girls in Nashik Ila 7001305949 Independent Escort Service NashikCall Girls in Nagpur High Profile
 
Katraj ( Call Girls ) Pune 6297143586 Hot Model With Sexy Bhabi Ready For S...
Katraj ( Call Girls ) Pune  6297143586  Hot Model With Sexy Bhabi Ready For S...Katraj ( Call Girls ) Pune  6297143586  Hot Model With Sexy Bhabi Ready For S...
Katraj ( Call Girls ) Pune 6297143586 Hot Model With Sexy Bhabi Ready For S...tanu pandey
 
The Most Attractive Pune Call Girls Sanghavi 8250192130 Will You Miss This Ch...
The Most Attractive Pune Call Girls Sanghavi 8250192130 Will You Miss This Ch...The Most Attractive Pune Call Girls Sanghavi 8250192130 Will You Miss This Ch...
The Most Attractive Pune Call Girls Sanghavi 8250192130 Will You Miss This Ch...ranjana rawat
 
Book Paid Chakan Call Girls Pune 8250192130Low Budget Full Independent High P...
Book Paid Chakan Call Girls Pune 8250192130Low Budget Full Independent High P...Book Paid Chakan Call Girls Pune 8250192130Low Budget Full Independent High P...
Book Paid Chakan Call Girls Pune 8250192130Low Budget Full Independent High P...ranjana rawat
 
Russian Call Girls in Nagpur Devyani Call 7001035870 Meet With Nagpur Escorts
Russian Call Girls in Nagpur Devyani Call 7001035870 Meet With Nagpur EscortsRussian Call Girls in Nagpur Devyani Call 7001035870 Meet With Nagpur Escorts
Russian Call Girls in Nagpur Devyani Call 7001035870 Meet With Nagpur EscortsCall Girls in Nagpur High Profile
 
(KRITIKA) Balaji Nagar Call Girls Just Call 7001035870 [ Cash on Delivery ] P...
(KRITIKA) Balaji Nagar Call Girls Just Call 7001035870 [ Cash on Delivery ] P...(KRITIKA) Balaji Nagar Call Girls Just Call 7001035870 [ Cash on Delivery ] P...
(KRITIKA) Balaji Nagar Call Girls Just Call 7001035870 [ Cash on Delivery ] P...ranjana rawat
 
Week 5 Dessert Accompaniments (Cookery 9)
Week 5 Dessert Accompaniments (Cookery 9)Week 5 Dessert Accompaniments (Cookery 9)
Week 5 Dessert Accompaniments (Cookery 9)MAARLENEVIDENA
 
(SUNAINA) Call Girls Alandi Road ( 7001035870 ) HI-Fi Pune Escorts Service
(SUNAINA) Call Girls Alandi Road ( 7001035870 ) HI-Fi Pune Escorts Service(SUNAINA) Call Girls Alandi Road ( 7001035870 ) HI-Fi Pune Escorts Service
(SUNAINA) Call Girls Alandi Road ( 7001035870 ) HI-Fi Pune Escorts Serviceranjana rawat
 
(PRIYA) Call Girls Budhwar Peth ( 7001035870 ) HI-Fi Pune Escorts Service
(PRIYA) Call Girls Budhwar Peth ( 7001035870 ) HI-Fi Pune Escorts Service(PRIYA) Call Girls Budhwar Peth ( 7001035870 ) HI-Fi Pune Escorts Service
(PRIYA) Call Girls Budhwar Peth ( 7001035870 ) HI-Fi Pune Escorts Serviceranjana rawat
 
Low Rate Call Girls Nagpur Esha Call 7001035870 Meet With Nagpur Escorts
Low Rate Call Girls Nagpur Esha Call 7001035870 Meet With Nagpur EscortsLow Rate Call Girls Nagpur Esha Call 7001035870 Meet With Nagpur Escorts
Low Rate Call Girls Nagpur Esha Call 7001035870 Meet With Nagpur Escortsranjana rawat
 
Jp Nagar Call Girls Bangalore WhatsApp 8250192130 High Profile Service
Jp Nagar Call Girls Bangalore WhatsApp 8250192130 High Profile ServiceJp Nagar Call Girls Bangalore WhatsApp 8250192130 High Profile Service
Jp Nagar Call Girls Bangalore WhatsApp 8250192130 High Profile ServiceHigh Profile Call Girls
 
VIP Model Call Girls Shivane ( Pune ) Call ON 8005736733 Starting From 5K to ...
VIP Model Call Girls Shivane ( Pune ) Call ON 8005736733 Starting From 5K to ...VIP Model Call Girls Shivane ( Pune ) Call ON 8005736733 Starting From 5K to ...
VIP Model Call Girls Shivane ( Pune ) Call ON 8005736733 Starting From 5K to ...SUHANI PANDEY
 
VIP Call Girls In Singar Nagar ( Lucknow ) 🔝 8923113531 🔝 Cash Payment Avai...
VIP Call Girls In Singar Nagar ( Lucknow  ) 🔝 8923113531 🔝  Cash Payment Avai...VIP Call Girls In Singar Nagar ( Lucknow  ) 🔝 8923113531 🔝  Cash Payment Avai...
VIP Call Girls In Singar Nagar ( Lucknow ) 🔝 8923113531 🔝 Cash Payment Avai...anilsa9823
 
Top Rated Pune Call Girls JM road âźź 6297143586 âźź Call Me For Genuine Sex Ser...
Top Rated  Pune Call Girls JM road âźź 6297143586 âźź Call Me For Genuine Sex Ser...Top Rated  Pune Call Girls JM road âźź 6297143586 âźź Call Me For Genuine Sex Ser...
Top Rated Pune Call Girls JM road âźź 6297143586 âźź Call Me For Genuine Sex Ser...Call Girls in Nagpur High Profile
 
Call Girls Sb Road Call Me 7737669865 Budget Friendly No Advance Booking
Call Girls Sb Road Call Me 7737669865 Budget Friendly No Advance BookingCall Girls Sb Road Call Me 7737669865 Budget Friendly No Advance Booking
Call Girls Sb Road Call Me 7737669865 Budget Friendly No Advance Bookingroncy bisnoi
 
Top Rated Pune Call Girls Baner âźź 6297143586 âźź Call Me For Genuine Sex Servi...
Top Rated  Pune Call Girls Baner âźź 6297143586 âźź Call Me For Genuine Sex Servi...Top Rated  Pune Call Girls Baner âźź 6297143586 âźź Call Me For Genuine Sex Servi...
Top Rated Pune Call Girls Baner âźź 6297143586 âźź Call Me For Genuine Sex Servi...Call Girls in Nagpur High Profile
 

Recently uploaded (20)

VIP Call Girls Service Shamshabad Hyderabad Call +91-8250192130
VIP Call Girls Service Shamshabad Hyderabad Call +91-8250192130VIP Call Girls Service Shamshabad Hyderabad Call +91-8250192130
VIP Call Girls Service Shamshabad Hyderabad Call +91-8250192130
 
Pesticide Calculation Review 2013 post.pptx
Pesticide Calculation Review 2013 post.pptxPesticide Calculation Review 2013 post.pptx
Pesticide Calculation Review 2013 post.pptx
 
Food & Nutrition Strategy Baseline (FNS.pdf)
Food & Nutrition Strategy Baseline (FNS.pdf)Food & Nutrition Strategy Baseline (FNS.pdf)
Food & Nutrition Strategy Baseline (FNS.pdf)
 
(ANJALI) Shikrapur Call Girls Just Call 7001035870 [ Cash on Delivery ] Pune ...
(ANJALI) Shikrapur Call Girls Just Call 7001035870 [ Cash on Delivery ] Pune ...(ANJALI) Shikrapur Call Girls Just Call 7001035870 [ Cash on Delivery ] Pune ...
(ANJALI) Shikrapur Call Girls Just Call 7001035870 [ Cash on Delivery ] Pune ...
 
Call Girls in Nashik Ila 7001305949 Independent Escort Service Nashik
Call Girls in Nashik Ila 7001305949 Independent Escort Service NashikCall Girls in Nashik Ila 7001305949 Independent Escort Service Nashik
Call Girls in Nashik Ila 7001305949 Independent Escort Service Nashik
 
Katraj ( Call Girls ) Pune 6297143586 Hot Model With Sexy Bhabi Ready For S...
Katraj ( Call Girls ) Pune  6297143586  Hot Model With Sexy Bhabi Ready For S...Katraj ( Call Girls ) Pune  6297143586  Hot Model With Sexy Bhabi Ready For S...
Katraj ( Call Girls ) Pune 6297143586 Hot Model With Sexy Bhabi Ready For S...
 
The Most Attractive Pune Call Girls Sanghavi 8250192130 Will You Miss This Ch...
The Most Attractive Pune Call Girls Sanghavi 8250192130 Will You Miss This Ch...The Most Attractive Pune Call Girls Sanghavi 8250192130 Will You Miss This Ch...
The Most Attractive Pune Call Girls Sanghavi 8250192130 Will You Miss This Ch...
 
Book Paid Chakan Call Girls Pune 8250192130Low Budget Full Independent High P...
Book Paid Chakan Call Girls Pune 8250192130Low Budget Full Independent High P...Book Paid Chakan Call Girls Pune 8250192130Low Budget Full Independent High P...
Book Paid Chakan Call Girls Pune 8250192130Low Budget Full Independent High P...
 
Russian Call Girls in Nagpur Devyani Call 7001035870 Meet With Nagpur Escorts
Russian Call Girls in Nagpur Devyani Call 7001035870 Meet With Nagpur EscortsRussian Call Girls in Nagpur Devyani Call 7001035870 Meet With Nagpur Escorts
Russian Call Girls in Nagpur Devyani Call 7001035870 Meet With Nagpur Escorts
 
(KRITIKA) Balaji Nagar Call Girls Just Call 7001035870 [ Cash on Delivery ] P...
(KRITIKA) Balaji Nagar Call Girls Just Call 7001035870 [ Cash on Delivery ] P...(KRITIKA) Balaji Nagar Call Girls Just Call 7001035870 [ Cash on Delivery ] P...
(KRITIKA) Balaji Nagar Call Girls Just Call 7001035870 [ Cash on Delivery ] P...
 
Week 5 Dessert Accompaniments (Cookery 9)
Week 5 Dessert Accompaniments (Cookery 9)Week 5 Dessert Accompaniments (Cookery 9)
Week 5 Dessert Accompaniments (Cookery 9)
 
(SUNAINA) Call Girls Alandi Road ( 7001035870 ) HI-Fi Pune Escorts Service
(SUNAINA) Call Girls Alandi Road ( 7001035870 ) HI-Fi Pune Escorts Service(SUNAINA) Call Girls Alandi Road ( 7001035870 ) HI-Fi Pune Escorts Service
(SUNAINA) Call Girls Alandi Road ( 7001035870 ) HI-Fi Pune Escorts Service
 
(PRIYA) Call Girls Budhwar Peth ( 7001035870 ) HI-Fi Pune Escorts Service
(PRIYA) Call Girls Budhwar Peth ( 7001035870 ) HI-Fi Pune Escorts Service(PRIYA) Call Girls Budhwar Peth ( 7001035870 ) HI-Fi Pune Escorts Service
(PRIYA) Call Girls Budhwar Peth ( 7001035870 ) HI-Fi Pune Escorts Service
 
Low Rate Call Girls Nagpur Esha Call 7001035870 Meet With Nagpur Escorts
Low Rate Call Girls Nagpur Esha Call 7001035870 Meet With Nagpur EscortsLow Rate Call Girls Nagpur Esha Call 7001035870 Meet With Nagpur Escorts
Low Rate Call Girls Nagpur Esha Call 7001035870 Meet With Nagpur Escorts
 
Jp Nagar Call Girls Bangalore WhatsApp 8250192130 High Profile Service
Jp Nagar Call Girls Bangalore WhatsApp 8250192130 High Profile ServiceJp Nagar Call Girls Bangalore WhatsApp 8250192130 High Profile Service
Jp Nagar Call Girls Bangalore WhatsApp 8250192130 High Profile Service
 
VIP Model Call Girls Shivane ( Pune ) Call ON 8005736733 Starting From 5K to ...
VIP Model Call Girls Shivane ( Pune ) Call ON 8005736733 Starting From 5K to ...VIP Model Call Girls Shivane ( Pune ) Call ON 8005736733 Starting From 5K to ...
VIP Model Call Girls Shivane ( Pune ) Call ON 8005736733 Starting From 5K to ...
 
VIP Call Girls In Singar Nagar ( Lucknow ) 🔝 8923113531 🔝 Cash Payment Avai...
VIP Call Girls In Singar Nagar ( Lucknow  ) 🔝 8923113531 🔝  Cash Payment Avai...VIP Call Girls In Singar Nagar ( Lucknow  ) 🔝 8923113531 🔝  Cash Payment Avai...
VIP Call Girls In Singar Nagar ( Lucknow ) 🔝 8923113531 🔝 Cash Payment Avai...
 
Top Rated Pune Call Girls JM road âźź 6297143586 âźź Call Me For Genuine Sex Ser...
Top Rated  Pune Call Girls JM road âźź 6297143586 âźź Call Me For Genuine Sex Ser...Top Rated  Pune Call Girls JM road âźź 6297143586 âźź Call Me For Genuine Sex Ser...
Top Rated Pune Call Girls JM road âźź 6297143586 âźź Call Me For Genuine Sex Ser...
 
Call Girls Sb Road Call Me 7737669865 Budget Friendly No Advance Booking
Call Girls Sb Road Call Me 7737669865 Budget Friendly No Advance BookingCall Girls Sb Road Call Me 7737669865 Budget Friendly No Advance Booking
Call Girls Sb Road Call Me 7737669865 Budget Friendly No Advance Booking
 
Top Rated Pune Call Girls Baner âźź 6297143586 âźź Call Me For Genuine Sex Servi...
Top Rated  Pune Call Girls Baner âźź 6297143586 âźź Call Me For Genuine Sex Servi...Top Rated  Pune Call Girls Baner âźź 6297143586 âźź Call Me For Genuine Sex Servi...
Top Rated Pune Call Girls Baner âźź 6297143586 âźź Call Me For Genuine Sex Servi...
 

2019 CAGNY INGR.pdf

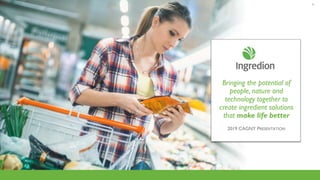
  • 1. Bringing the potential of people, nature and technology together to create ingredient solutions that make life better 2019 CAGNY PRESENTATION 1
  • 2. CONFIDENTIAL Forward-looking statements 2 This presentation contains or may contain forward-looking statements within the meaning of Section 27A of the Securities Act of 1933, as amended, and Section 21E of the Securities Exchange Act of 1934, as amended. The Company intends these forward-looking statements to be covered by the safe harbor provisions for such statements. Forward-looking statements include, among other things, any statements regarding the Company's prospects or future financial condition, earnings, revenues, tax rates, capital expenditures, cash flows, expenses or other financial items, any statements concerning the Company's prospects or future operations, including management's plans or strategies and objectives therefor and any assumptions, expectations or beliefs underlying the foregoing. These statements can sometimes be identified by the use of forward looking words such as "may," "will," "should," "anticipate," "assume", "believe," "plan," "project," "estimate," "expect," "intend," "continue," "pro forma," "forecast," "outlook," "propels," "opportunities," "potential," “provisional,” or other similar expressions or the negative thereof. All statements other than statements of historical facts in this release or referred to in this release are "forward-looking statements." These statements are based on current circumstances or expectations, but are subject to certain inherent risks and uncertainties, many of which are difficult to predict and are beyond our control. Although we believe our expectations reflected in these forward-looking statements are based on reasonable assumptions, investors are cautioned that no assurance can be given that our expectations will prove correct. Actual results and developments may differ materially from the expectations expressed in or implied by these statements, based on various factors, including the effects of global economic conditions, including, particularly, economic, currency and political conditions in South America and economic and political conditions in Europe, and their impact on our sales volumes and pricing of our products; our ability to collect our receivables from customers and our ability to raise funds at reasonable rates; fluctuations in worldwide markets for corn and other commodities, and the associated risks of hedging against such fluctuations; fluctuations in the markets and prices for our co-products, particularly corn oil; fluctuations in aggregate industry supply and market demand; the behavior of financial markets, including foreign currency fluctuations and fluctuations in interest and exchange rates; volatility and turmoil in the capital markets; the commercial and consumer credit environment; general political, economic, business, market and weather conditions in the various geographic regions and countries in which we buy our raw materials or manufacture or sell our products; future financial performance of major industries which we serve, including, without limitation, the food, beverage, paper and corrugating and brewing industries; energy costs and availability; freight and shipping costs,; and changes in regulatory controls regarding quotas, tariffs, duties, taxes and income tax rates; particularly United States tax reform enacted in 2017; operating difficulties; availability of raw materials, including potato starch, tapioca, gum Arabic and the specific varieties of corn upon which some of our products are based; our ability to develop or acquire new products and services at rates or of qualities sufficient to meet expectations; energy issues in Pakistan; boiler reliability; our ability to effectively integrate and operate acquired businesses; our ability to achieve budgets and to realize expected synergies; our ability to achieve expected savings under our Cost Smart program; our ability to complete planned maintenance and investment projects successfully and on budget; labor disputes; genetic and biotechnology issues; changing consumption preferences including those relating to high fructose corn syrup; increased competitive and/or customer pressure in the corn-refining industry; and the outbreak or continuation of serious communicable disease or hostilities including acts of terrorism. Our forward-looking statements speak only as of the date on which they are made and we do not undertake any obligation to update any forward-looking statement to reflect events or circumstances after the date of the statement as a result of new information or future events or developments. If we do update or correct one or more of these statements, investors and others should not conclude that we will make additional updates or corrections. For a further description of these and other risks, see "Risk Factors" included in our Annual Report on Form 10-K for the year ended December 31, 2017 and subsequent reports on Forms 10-Q and 8-K.
  • 3. CONFIDENTIAL Today’s agenda 3 James P. Zallie President and Chief Executive Officer Our Strategy to Drive Growth James Gray Executive Vice President and Chief Financial Officer Value Creation and Financial Outlook Pierre Perez y Landazuri Senior Vice President and President, EMEA Accelerating Customer Co-Creation and Consumer Preferred Innovation Jorgen Kokke Executive Vice President, Global Specialties and President, North America Specialty Growth Platforms
  • 4. CONFIDENTIAL 500 4 CUSTOMERS IN OVER 120 COUNTRIES 18,000 FIVE-YEAR ADJUSTED EARNINGS PER SHARE CAGR* COMPANY 7% A FORTUNE $5.8B 26 COUNTRIES WITH INGREDION OPERATIONS Ingredion: A leading global ingredient solutions provider more than 2018 NET SALES World's Most Admired Companies, FORTUNE Magazine (2009–2019) World's Most Ethical Companies, The Ethisphere Institute (2013–2018) Bloomberg Gender-Equality Index (2018–2019) *CAGR is calculated based on 2013-2018 EPS. See appendix for a reconciliation of these non-GAAP financial measures to U.S. GAAP measures.
  • 5. CONFIDENTIAL Ingredion’s unique value proposition in the $155B global ingredient space 5 • Aligned with food and beverage consumer trends and how those trends are impacting our customer landscape • Customer intimate with global reach and local touch • An innovation accelerator from idea to shelf; making food taste better through texture • An experienced solution provider combining: • Food science, applications knowledge and rapid prototyping • Culinary expertise and sensory science • Reputable, reliable and trusted sourcing 5
  • 6. CONFIDENTIAL Opportunities to sell a broad ingredient portfolio globally 6 66 COUNTRIES WITH >$1 MILLION IN INGREDION SALES PROVIDE ACCESS TO 80% OF WORLD POPULATION
  • 7. CONFIDENTIAL CONSUMERS MORE MINDFUL OF SUGAR CONSUMPTION Consumer trends create opportunities for Ingredion to make life better 7 39% Would switch to a more transparent brand1 67% Want to know everything that goes into their food1 FEWER INGREDIENTS AND SIMPLE LABELS BUILD UNDERSTANDING 84% Have reduced sugar intake2 50% Of millennials willing to pay for the convenience that food delivery offers3 1: Nielsen 2018 2: Mintel 2018 3: Euromonitor, 2018 CERTIFIED AND TRACEABLE SUPPLY CHAINS CONVEY TRUST CONSUMER DEMAND FOR “FOOD ANYWHERE”
  • 8. CONFIDENTIAL Demand for convenience driving “food anywhere” disruption 8 748 869 2017 At Home Away from Home U.S. CONSUMER SALES IN $ BILLIONS INGREDIENTS THAT PROVIDE A CONSISTENT PRODUCT EXPERIENCE TOTHE HOME USDA Economic Research Service
  • 9. CONFIDENTIAL Our strategic initiatives to forge growth 9 Build on our global innovation strengths aligning with current and future consumer trends and a changing customer landscape Focus and simplify to better anticipate, execute and operate with agility to improve productivity and smartly lower our costs Accelerate and deliver value through customer co-creation and differentiated go-to-market capabilities Unleash the potential of our people by embracing an inclusive culture supported by contemporary values and an inspiring core purpose 1 3 2 4 COMMERCIAL EXCELLENCE PURPOSE, CULTURE,VALUES AND TALENT SPECIALTIES COST SMART
  • 10. CONFIDENTIAL Starches $6 Emulsifiers $3 Cultures& Enzymes $2 Animal Protein* $15 Ingredion’s specialty solutions portfolio plays in a big space, with room for organic growth and acquisitions $6 ~ $155 B1 Global ingredient sales ~ $41 B1 Texture industry sales Texturizers 10 1Markets and Markets, Technavio, Modor, LMC Global Sweetener Market, LMC Global Starch Market, Giract, Food Preservatives Market – Global Trends to 2022, Ingredion internal intelligence * Animal protein includes dairy and egg categories. Plant protein includes soy, wheat gluten and other. 10
  • 11. CONFIDENTIAL Specialties growth well positioned to exceed 33% of sales by 2022 11 *2022 net sales excludes the impact of pending and future acquisitions 2015 2018 2022*
  • 12. CONFIDENTIAL 12 Customer Co-Creation and Consumer Preferred Innovation Sustainable and Trusted Sourcing Supply Chain and Operational Excellence Core Food and Industrial Ingredients Specialty Growth Platforms VALUE CREATION VALUE CREATION CLEAN AND SIMPLE INGREDIENTS FOOD SYSTEMS PLANT-BASED PROTEINS STARCH-BASED TEXTURIZERS SUGAR REDUCTION AND SPECIALTY SWEETENERS DRIVINGROWTH Ingredion’s roadmap for value creation Customer Co-Creation and Consumer Preferred Innovation Purpose and Performance Driven Culture
  • 13. CONFIDENTIAL 13 Customer Co-Creation and Consumer Preferred Innovation STARCH-BASED TEXTURIZERS VALUE CREATION VALUE CREATION >5% CAGR OF TAPIOCA, POTATO AND RICE- BASED SPECIALTY FOOD STARCHES2 ~60% OF 2018 SPECIALTY NET SALES OF NEW PRODUCTS INTRODUCED WITH STARCHES IN F&B1 22% OF PRODUCT INNOVATION POSSIBILITIES FROM 14 BASE STARCHES 1000s INGREDION’S STRENGTH: THE BROADEST AND DEEPEST PORTFOLIO AND EXPERTISE IN THE INDUSTRY DRIVINGROWTH STARCH-BASED TEXTURIZERS 1 Innova, 2018 (excluding in alcohol, soda drinks, pet food and supplements) 2 Ingredion Internal Analysis 2017
  • 14. CONFIDENTIAL CLEAN AND SIMPLE INGREDIENTS 14 Customer Co-Creation and Consumer Preferred Innovation VALUE CREATION VALUE CREATION DRIVINGROWTH CLEAN AND SIMPLE FOOD INGREDIENTS INGREDION’S STRENGTH: A LEADER IN GLOBAL CLEAN LABEL STARCH SOLUTIONS ~$100M REVENUE GROWTH OPPORTUNITY OF CONSUMERS WILLING TO PAY MORE FOR FOODS AND DRINKS THAT DON’T CONTAIN “UNDESIRABLE” INGREDIENTS2 68% LAST FIVE YEAR CAGR (2013-2017) OF GLOBAL NEW PRODUCT LAUNCHES WITH CLEAN LABEL CLAIMS1 12% 1 Innova, 2018 (excludes Alcohol, Pet Food, Soft Drinks and Supplements) 2 Nielsen Product Insider (US) 3 Ingredion Proprietary Global Clean Label Study 2017 (Top Two Box, Very/Quite Important) GLOBAL CONSUMERS WHO WANT TO BUY F&B PRODUCTS WITH “SHORT AND SIMPLE” INGREDIENT LISTS3 79%
  • 15. CONFIDENTIAL PLANT-BASED PROTEINS 15 Customer Co-Creation and Consumer Preferred Innovation VALUE CREATION VALUE CREATION 1, 2, 3 Innova 2018 DRIVINGROWTH PLANT-BASED PROTEINS INGREDION’S STRENGTH: NUTRITIONAL AND TEXTURAL FORMULATING CAPABILITIES UNDERPINNED BY SUPPLY CHAIN EXCELLENCE AND SUSTAINABLE SOURCING ~$100M REVENUE OPPORTUNITY LAST THREE YEAR U.S. CAGR OF PLANT-BASED NON-SOY PROTEIN CONSUMPTION2 51% 2012-2017 INCREASE OF FOOD LAUNCHES WITH DRY MILLED PULSE INGREDIENTS1 19% PERCEIVE PLANT-BASED PROTEINS AS BETTER FOR THE ENVIRONMENT3 57%
  • 16. CONFIDENTIAL 16 Customer Co-Creation and Consumer Preferred Innovation VALUE CREATION VALUE CREATION SUGAR REDUCTION AND SPECIALTY SWEETENERS 1 Innova 2018 2 Nielsen Product Insider 52 weeks ending 12/30/2017 3 Mintel DRIVINGROWTH SUGAR REDUCTION AND SPECIALTY SWEETENERS INGREDION’S STRENGTH: LOW/NO SUGAR, NATURE-BASED SOLUTIONS ENABLED BY WORLD-CLASS SENSORY AND FORMULATING CAPABILITIES >$100M REVENUE OPPORTUNITY 2013-2017 CAGR OF NEW PRODUCT LAUNCHES WITH NO/LOW SUGAR CLAIMS2 17% 2015-2018 CAGR OF NEW PRODUCT LAUNCHES CONTAINING STEVIA1 16% OF NORTH AMERICAN CONSUMERS REDUCED SUGAR INTAKE IN 20173 84%
  • 17. CONFIDENTIAL FOOD SYSTEMS Customer Co-Creation and Consumer Preferred Innovation VALUE CREATION VALUE CREATION DRIVINGROWTH FOOD SYSTEMS INGREDION’S STRENGTH: ABILITY TO COMBINE DEEP UNDERSTANDING OF INGREDIENT FUNCTIONALITY WITH FORMULATION SCIENCE TO CREATE UNIQUE, VALUE-ADDED SOLUTIONS ~$85M REVENUE GROWTH OPPORTUNITY CAGR 2013-18 OF SYSTEMS USED BY SMALL, FAST-GROWING FOOD COMPANIES (<$200M)1 17% VALUE VS. INGREDION SPECIALTY AVERAGE 2X OF TOTAL SIZE OF OPPORTUNITY FOR STARCH / HYDROCOLLOID SYSTEMS2 $2.5B 1 Innova 2018 2 Ingredion Proprietary Study 2017 17
  • 18. CONFIDENTIAL Fusing culinary arts and food science are key customer enablers for growth 18 VALUE CREATION VALUE CREATION DRIVINGROWTH Customer Co-Creation and Consumer Preferred Innovation SENSORY SCIENCE CONSUMER INSIGHTS APPLICATIONS KNOW-HOW FOOD SCIENCE CULINARY SKILLS
  • 19. CONFIDENTIAL SUGAR REDUCTION AND SPECIALTY SWEETENERS 19 Customer Co-Creation and Consumer Preferred Innovation Customer Co-Creation and Consumer Preferred Innovation VALUE CREATION VALUE CREATION LOW-SUGAR DRINKABLE YOGURT Accelerating customer co-creation and consumer-preferred innovation DRIVINGROWTH CREATION CHALLENGE: A reduced sugar solution that helps maintains texture and taste, avoiding “added sugar” label Stevia/functional ingredient system, combined with formulation and sensory expertise to deliver required mouthfeel FOOD SYSTEMS CONSUMER-PREFERRED SOLUTION:
  • 20. CONFIDENTIAL CLEAN AND SIMPLE INGREDIENTS 20 Customer Co-Creation and Consumer Preferred Innovation Customer Co-Creation and Consumer Preferred Innovation VALUE CREATION VALUE CREATION INDULGENT SPREADABLE CHEESE Accelerating customer co-creation and consumer-preferred innovation DRIVINGROWTH Grocery store brand looking to reduce costs in spreadable cheese while maintaining taste and imparting a creamy texture Replaced milk fat with a specialty starch with an indulgent taste while delivering an affordable recipe CREATION CHALLENGE: CONSUMER-PREFERRED SOLUTION:
  • 21. CONFIDENTIAL 21 Customer Co-Creation and Consumer Preferred Innovation STARCH-BASED TEXTURIZERS Customer Co-Creation and Consumer Preferred Innovation VALUE CREATION VALUE CREATION GLUTEN-FREE FROZEN PIZZA DOUGH Accelerating customer co-creation and consumer-preferred innovation DRIVINGROWTH A fast food chain wanted to prevent its frozen gluten-free pizza dough from cracking Introduced nature-based functional ingredients which imparted dough elasticity CREATION CHALLENGE: CONSUMER-PREFERRED SOLUTION:
  • 22. CONFIDENTIAL CLEAN AND SIMPLE INGREDIENTS 22 Customer Co-Creation and Consumer Preferred Innovation Customer Co-Creation and Consumer Preferred Innovation VALUE CREATION VALUE CREATION FIBER-ADDED MULTIGRAIN BREAD Accelerating customer co-creation and consumer-preferred innovation DRIVINGROWTH Impart desirable texture and taste while improving the fiber content of multigrain bread Added a clean label, high-fiber starch that imparts dietary fiber and delivers on taste CREATION CHALLENGE: CONSUMER-PREFERRED SOLUTION: STARCH-BASED TEXTURIZERS
  • 23. CONFIDENTIAL PLANT-BASED PROTEINS 23 Customer Co-Creation and Consumer Preferred Innovation Customer Co-Creation and Consumer Preferred Innovation VALUE CREATION VALUE CREATION NON-GMO CHICKPEA FLOUR PASTA Accelerating customer co-creation and consumer-preferred innovation DRIVINGROWTH A grocery store brand pasta seeking functional and nutritious non-GMO and clean label ingredients that were sustainably sourced Chickpea flour was used along with Ingredion's formulation expertise to maintain the desired pasta cooking and eating experience CREATION CHALLENGE: CONSUMER-PREFERRED SOLUTION:
  • 24. CONFIDENTIAL 24 Customer Co-Creation and Consumer Preferred Innovation Purpose and Performance Driven Culture Sustainable and Trusted Sourcing VALUE CREATION VALUE CREATION METRIC TONS OF CROPS SUSTAINABLY SOURCED GLOBALLY IN 2018 100% OF MANUFACTURING SITES WITH 3RD-PARTY RESPONSIBLE SOURCING AUDITS 2M Over a decade of supplying sustainable, identity-preserved ingredients DRIVINGROWTH
  • 25. CONFIDENTIAL 25 Customer Co-Creation and Consumer Preferred Innovation Purpose and Performance Driven Culture Sustainable and Trusted Sourcing Supply Chain and Operational Excellence VALUE CREATION VALUE CREATION NET SALES: $3,511 M, 60% OF INGREDION POPULATION: 493 M, 7% OF WORLD CUSTOMERS: 39% OF INGREDION NET SALES: $943 M, 16% OF INGREDION POPULATION: 424 M, 6% OF WORLD CUSTOMERS: 21% OF INGREDION NET SALES: $584 M, 10% OF INGREDION POPULATION: 2.2 B, 30% OF WORLD CUSTOMERS: 15% OF INGREDION NET SALES: $803 M, 14% OF INGREDION POPULATION: 4.3 B, 57% OF WORLD CUSTOMERS: 25% OF INGREDION We are excited about the breadth of our global opportunities DRIVINGROWTH
  • 26. Value Creation and Financial Outlook James Gray EVP and CFO 26
  • 27. CONFIDENTIAL Finance recap 27 2017 2018 2019 Net Sales $5.8B $5.8B flat Net sales expected up Adjusted Operating Income $878MM* $767MM* (13%) Adj. Op Inc expected flat to slightly up Reported Operating Income $836MM* $703MM* (16%) • North America – Lower sweetener volumes – Higher supply chain costs • Commodity margin pressures • FX devaluations
  • 28. CONFIDENTIAL Cost Smart working to mitigate inflation 28 • Cessation of wet milling in Stockton, CA – Reduced HFCS manufacturing footprint • Global procurement • Freight bid process redesign • Organizational reviews • Shared Service Centers in Tulsa, OK and Guadalajara, Mexico • Zero-based budgeting on all other SG&A (excluding comp and benefits)
  • 29. CONFIDENTIAL Specialty growth platforms are sources of profit growth 29 Net sales in billions 71% 29% 33%-36% Starch-Based Texturizers Clean & Simple Ingredients Sugar Reduction & Specialty Sweeteners Food Systems Specialty Remaining Percent of Expected Adj. Op Income* 2018 2022 Plant-Based Proteins Specialty Remaining 53%-56% 44%-47% 48% 52% $5.8 $6.4 Specialty Remaining Total Note: See appendix for a reconciliation of these non-GAAP financial measures to U.S. GAAP measures The company’s long-term objectives are considered internal goals and as such, do not represent guidance Represents real gross margin absolute dollar growth; actual margins vary due to pass-through of changes in raw material costs and FX Net sales growth objective assumes constant currency and corn/raw material costs equivalent to 2018 Mid Single Digit to High Single Digit 1% - 4% Flat to Low Single Digit 2018 – 2022 CAGR x *Items below gross profit were allocated between Core and Specialty using either net sales or judgmentally based on nature of costs 67%-64%
  • 30. CONFIDENTIAL Four-year profit growth outlook 30 The company’s long-term objectives are considered internal goals and as such, do not represent guidance Represents real gross margin absolute dollar growth; actual margins vary due to pass-through of changes in raw material costs and FX Net sales growth objective assumes constant currency and corn/raw material costs equivalent to 2018 Net Sales Adjusted EPS Operating Income 1% 4% Mid Single Digit High Single Digit 1%
  • 31. CONFIDENTIAL Consistent cash generation provides fuel to deploy toward strategic growth 31 $700 $650 Cash Flow from Operations CapEx Dividends Free Cash Flow After Dividends $ Millions 2019E Annual Cash Flows - ~$200 - $115 ~$175 $360- $330 Note: See appendix for a reconciliation of these non-GAAP financial measures to U.S. GAAP measures. Cash principles • Invest in growth projects and specialty CapEx • Pursue value-enhancing acquisitions • Maintain investment-grade status
  • 32. CONFIDENTIAL Room within strong balance sheet to enable acquisitions 32 2016 2017 2018 Investment Grade Rating - S&P and Fitch - Moody’s BBB Baa2 BBB Baa2 BBB Baa1 Net Debt / Adjusted EBITDA* 1.4x 1.2x 1.8x Net Debt to Capitalization* 34% 29% 40% *Note: See appendix for a reconciliation of these non-GAAP financial measures to U.S. GAAP measures.
  • 33. CONFIDENTIAL Purpose-driven M&A to accelerate our Specialty Growth Platforms 33 NAME CHANGE PORTFOLIO EXPANSION POTATO-BASED INGREDIENTS PORTFOLIO EXPANSION FRUIT AND VEGETABLE INGREDIENTS PORTFOLIO EXPANSION RICE-BASED INGREDIENTS SHANDONG HUANONG CAPACITY EXPANSION IN ASIA-PACIFIC 2010 2012 2015 2016 PORTFOLIO EXPANSION HYDROCOLLOID INGREDIENTS TRANSFORMATIVE TRANSACTION PORTFOLIO EXPANSION 2017 (BANGLEN) 2018 SOUTH SIOUX CITY CAPACITY EXPANSION IN NORTH AMERICA JOINT VENTURE PLANT-BASED PROTEINS STRATEGIC ALLIANCE SUGAR REDUCTION ALLULOSE ®* *ASTRAEA® is trademark of Matsutani Chemical Industry Co., Ltd. Used with permission
  • 34. CONFIDENTIAL 2009* 2010* 2011* 2012* 2013 2014* 2015* 2016* 2017* 2018* 2019* 2020 2022 Delivering adjusted EPS growth toward long-term target 34 Note: CAGR is calculated based on adjusted EPS for 2009 – 2012, and 2014 - 2018. CAGR are calculated based on 2018. See appendix for a reconciliation of these non-GAAP financial measures to U.S. GAAP measures. 2019 Adj. EPS Guidance $6.80 - $7.50 10Year Adj. EPS CAGR: 7% 5 Year Adj. EPS CAGR: 7% 4 Year Profit Growth Outlook High Single Digit Adjusted EPS 2020- 2021
  • 35. CONFIDENTIAL Four-year profit growth outlook (2018-2022) 35 • Specialty ingredients target >$2 billion of net sales • Specialty ingredients target of 33-36% of net sales • One percentage point margin expansion target* • High single-digit targeted adjusted EPS Growth • Target ROCE greater than 10% Note: The company’s long-term objectives are considered internal goals based on 2018 year-end and as such, do not represent guidance * Represents real margin absolute dollar growth; actual margins vary due to pass-through of changes in raw material costs and FX
  • 36. CONFIDENTIAL 36 Customer Co-Creation and Consumer Preferred Innovation Purpose and Performance Driven Culture Customer Co-Creation and Consumer Preferred Innovation Sustainable and Trusted Sourcing Supply Chain and Operational Excellence Core Food and Industrial Ingredients Specialty Growth Platforms VALUE CREATION VALUE CREATION CLEAN AND SIMPLE INGREDIENTS FOOD SYSTEMS PLANT-BASED PROTEINS STARCH-BASED TEXTURIZERS SUGAR REDUCTION AND SPECIALTY SWEETENERS DRIVINGROWTH Ingredion’s roadmap for value creation
  • 37. CONFIDENTIAL Questions and Answers 37 We bring the potential of people, nature, and technology together to create ingredient solutions that make life better.
  • 39. CONFIDENTIAL Solid returns and financial performance 39 2016 2017 2018 Specialty % of Net Sales 26% 28% 29% Gross Profit Margin % 25% 25% 23% Return on Capital Employed* 12.6% 12.3% 11.0% Dividends Paid per Share $1.85 $2.10 $2.43 Total Shareholder Payout* 21% 47% 167% *See appendix for a reconciliation of these non-GAAP financial measures to U.S. GAAP measures.
  • 40. CONFIDENTIAL Reconciliation of non-GAAP net income and earnings per share 40 (in millions) EPS (in millions) EPS (in millions) EPS (in millions) EPS (in millions) EPS (in millions) EPS (in millions) EPS (in millions) EPS (in millions) EPS (in millions) EPS Net income attributable to Ingredion $41 $0.54 $169 $2.20 $416 $5.32 $428 $5.47 $396 $5.05 $355 $4.74 $402 $5.51 $485 $6.55 $519 $7.06 $443 $6.17 Add back (deduct): $110 1.47 $22 0.29 $6 0.08 $23 0.29 - - $33 0.44 $19 0.25 $14 0.20 $31 0.42 $51 0.71 - - $26 0.34 $20 0.26 $2 0.03 - - $1 0.02 $7 0.10 $2 0.03 $3 0.04 - - - - $18 0.23 - - - - - - - - $7 0.09 - - $6 0.08 - - Bridge loan fees, net of income tax benefit of $6.9 million $13 0.16 - - - - - - - - - - - - - - $1 0.02 - - - - - - - - - - - - - - - - - - ($18) (0.23) ($3) (0.04) - - - - - - - - - - NAFTA award - - - - ($58) (0.75) - - - - - - - - - - - - Reversal of Korean deferred tax asset valuation allowance - - - - - - ($13) (0.16) - - - - - - - - - - - - - - - - ($2) (0.02) - - - - (9) (0.12) - - - - Litigation settlement, net of income tax benefit of $2.5 million 4 0.06 - - Income tax settlement 27 0.36 (10) (0.14) - - Income tax reform 23 0.31 3 0.04 Insurance proceeds, net of income tax benefit of $3.3 million (6) (0.08) - - Non-GAAP adjusted net income $151 $2.01 $249 $3.24 $366 $4.68 $435 $5.57 $396 $5.05 $389 $5.20 $430 $5.88 $528 7.13 $566 $7.70 $497 $6.92 EPS may not foot or recalculate due to rounding. December 31, 2009 December 31, 2010 Other acquisition-related financing costs, net of income tax benefit of $0.8 million Gain from change in benefit plans, net of income tax of $11.4 million and $1.4 million for the years ended December 31, 2011 and December 31, 2012, respectively Gain from sale of land/plant, net of income tax of $0.4 million and $0.9 million for the yeas ended December 31, 2012 and December 31, 2015, respectively Restructuring/impairment charges, net of income tax benefit of $14.7 million, $2.7 million, $3.5 million, $12.8 million, $0, $0, 9.7 million, $4.7 million, $7.4 million, and $13.0 million for the years ended December 31, 2009, December 31, 2010, December 31, 2011, December 31, 2012, December 31, 2013, December 31, 2014, December 31, 2015, December 31, 2016, December 31, 2017, and December 31, 2018, respectively. December 31, 2014 Year Ended Year Ended December 31, 2015 Year Ended December 31, 2018 Year Ended December 31, 2017 Charge for fair value mark-up of acquired inventory, net of income tax benefit of $9.3 million, $3.8 million, and $3.4 million for the years ended December 31, 2010, December 31, 2015, and December 31, 2017, respectively Acquisition/integration costs, net of income tax benefit of $9.0 million, $10.2 million, $1.6 million, $0, $0.4 million, $2.9 million, $1.1 million, and $1.3 million for the years ended December 31, 2010, December 31, 2011, December 31, 2012, December 31, 2013, December 31, 2014, December 31, 2015, December 31, 2016, and December 31, 2017, respectively Year Ended December 31, 2016 Year Ended Year Ended Year Ended Year Ended Year Ended December 31, 2011 December 31, 2012 December 31, 2013 40
  • 41. CONFIDENTIAL Reconciliation of non-GAAP adjusted operating income 41 41 Year Ended Year Ended Year Ended Year Ended Year Ended (in millions, pre-tax) December 31, 2014 December 31, 2015 December 31, 2016 December 31, 2017 December 31, 2018 Operating income 581 $ 653 $ 806 $ 836 $ 703 $ Add back: Restructuring/impairment charges 33 28 19 38 64 Acquisition/integration costs 2 10 3 4 - Charge for fair value mark-up of acquired inventory - 10 - 9 - Insurance proceeds - - - (9) - Litigation settlement - 7 - - - Gain on sale of plant - (10) - - - Non-GAAP adjusted operating income 616 $ 698 $ 828 $ 878 $ 767 $
  • 43. CONFIDENTIAL 43 Reconciliation of non-GAAP ROCE metric Return on Capital Employed (dollars in millions)      Total equity * $ 2,180 $ 2,595 $ 2,917 Add: Cumulative translation adjustment *   1,025   1,008   951 Share-based payments subject to redemption*   24   30   36 Total debt *   1,838   1,956   1,864 Less: Cash and cash equivalents *   (434)   (512)   (595) Capital employed * (a) $ 4,633 $ 5,077 $ 5,173 Operating income $ 806 $ 836 $ 703 Adjusted for: Restructuring/impairment charges   19   38   64 Acquisition/integration costs   3   4   - Charge for fair value mark-up of acquired inventory   —   9   — Insurance proceeds — (9) - Litigation settlement   —   —   — Gain on sale of plant   —   —   — Adjusted operating income $ 828 $ 878 $ 767 Income taxes (at effective tax rates of 28.6%, 29.4%, and 27.5% in 2015, 2016, and 2017, respectively)   (243)   (251)   (198) Adjusted operating income, net of tax (b) $ 585 $ 627 $ 569 Return on Capital Employed (b/a)   12.6%   12.3%   11.0% 2018 * Balance sheet amounts used in computing capital employed represent beginning of period balances. 2017 2016
  • 44. CONFIDENTIAL 44 Reconciliation of non-GAAP adjusted effective income tax rate to GAAP effective income tax rate Income Before Income Taxes (a) Provision for Income Taxes (b) Effective Income Tax Rate (b/a) Income Before Income Taxes (a) Provision for Income Taxes (b) Effective Income Tax Rate (b/a) Income Before Income Taxes (a) Provision for Income Taxes (b) Effective Income Tax Rate (b/a) As Reported 742 $ 246 $ 33.1% 769 $ 237 $ 30.8% 621 $ 167 $ 26.9% Add (deduct): Restructuring/impairment charges 19 5 38 7 64 13 Acquisition/integration costs 3 1 4 1 - - Charge for fair value mark- up of acquired inventory - - 9 3 - - Insurance proceeds (9) (3) - - Litigation settlement - - - - - - Gain on sale of plant - - - - - - Income tax settlement - (27) - 10 - - Income tax reform (23) -3 Adjusted non-GAAP 764 $ 225 $ 29.4% 811 $ 232 $ 28.6% 685 $ 177 $ 25.8% Net income and tax rates may not foot or recalculate due to rounding. 2018 2016 2017
  • 45. CONFIDENTIAL Reconciliation of non-GAAP credit metrics – Net debt to adjusted EBITDA ratio 45 Net Debt to Adjusted EBITDA ratio (dollars in millions)      Short-term debt $ 106 $ 120 $ 169 Long-term debt   1,850   1,744   1,931 Less: Cash and cash equivalents   (512)   (595)   (327) Short-term investments   (4)   (9)   (7) Total net debt (a) $ 1,440 $ 1,260 $ 1,766 Net income attributable to Ingredion $ 485 $ 519 443 Add back (deduct): Restructuring/impairment charges (i)   19   38   30 Acquisition/integration costs   3   4   — Charge for fair value mark-up of acquired inventory   —   9   — Insurance proceeds (9)   — Litigation settlement   —   —   — Gain on sale of plant   —   —   — Net income attributable to non-controlling interest   11   13   11 Provision for income taxes   246   237 167 Financing costs, net of interest income of $11, $10, and $11, respectively   66   73 86 Depreciation and amortization   196   209 247 Adjusted EBITDA (b) $ 1,026 $ 1,093 $ 984 Net debt to adjusted EBITDA ratio (a/b)   1.4   1.2 1.8 i) 2018 restructuring / impairment charge is reduced above by $34 million to exclude the accelerated depreciation from cessation of wet-milling at the Stockton, California plant. The accelerated depreciation is included within in Depreciation and amortization above, and to include in restructuring / impairment charge would include the charge twice. See Note 5 for reconciliation to the $64 million restructuring charges 2018 2016 2017
  • 46. CONFIDENTIAL Reconciliation of non-GAAP credit metrics – Net debt to capitalization percentage 46 Net Debt to Capitalization percentage (dollars in millions)        Short-term debt $ 106 $ 120 $ 169 Long-term debt   1,850   1,744 1,931 Less: Cash and cash equivalents   (512)   (595) (327) Short-term investments   (4)   (9) (7) Total net debt (a) $ 1,440 $ 1,260 $ 1,766 Deferred income tax liabilities $ 171 $ 199 $ 189 Share-based payments subject to redemption   30   36   37 Total equity   2,595   2,917   2,408 Total capital $ 2,796 $ 3,152 $ 2,634 Total net debt and capital (b) $ 4,236 $ 4,412 $ 4,400 Net debt to capitalization percentage (a/b)   34.0 %   28.6 %   40.1 %   December 31, 2017 December 31, 2018 December 31, 2016
  • 47. CONFIDENTIAL 47 Reconciliation of non-GAAP total shareholder payout metric Total Shareholder Payout (in Millions)           Dividends paid to Ingredion shareholders* $ 134 $ 150 $ 173 Add:   Repurchase of common stock   8 123 657 Less:   Issuance of common stock for share-based compensation, net of settlements (29) (9) (1) Total shareholder payments (a) $ 113 $ 264 $ 829 Non-GAAP adjusted net income (b)   528   566   497       Total shareholder payout (a/b)   21%   47%   167% 2018 2016 2017 *Dividends paid per Consolidated Statements of Cash Flows less dividends declared to non-controlling interests