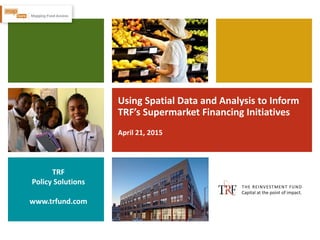
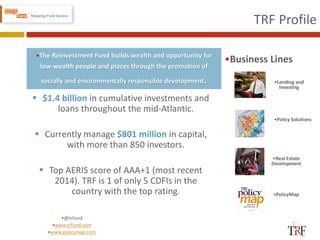
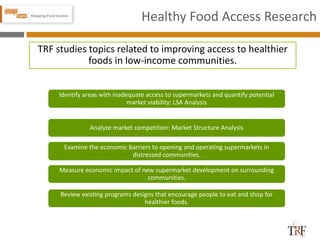
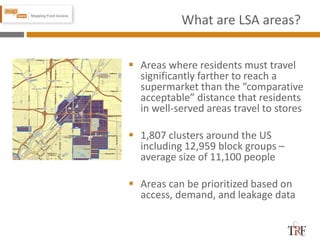
Lance Loethen
Using Spatial Data and Analysis to Inform
TRF’s Supermarket Financing Initiatives
April 21, 2015
TRF
Policy Solutions
www.trfund.com
TRF Profile
•Real Estate
Development
•Policy Solutions
•Business Lines
 $1.4 billion in cumulative investments and
loans throughout the mid-Atlantic.
 Currently manage $801 million in capital,
with more than 850 investors.
 Top AERIS score of AAA+1 (most recent
2014). TRF is 1 of only 5 CDFIs in the
country with the top rating.
•Lending and
Investing
•PolicyMap
•The Reinvestment Fund builds wealth and opportunity for
low-wealth people and places through the promotion of
socially and environmentally responsible development.
•@trfund
•www.trfund.com
•www.policymap.com
TRF and Supermarkets
TRF works to reduce inequitable access to healthy foods by:
• Financing viable, mission-fit food retail options
• Advocating to increase public awareness of food access
• Conducting policy research related to supermarket
development, food systems, and free and reduced price lunch
programs
• Providing technical assistance to CDFIs, foundations, and
other organizations to close the gap in access/knowledge
Healthy Food Access Research
TRF studies topics related to improving access to healthier
foods in low-income communities.
Identify areas with inadequate access to supermarkets and quantify potential
market viability: LSA Analysis
Analyze market competition: Market Structure Analysis
Examine the economic barriers to opening and operating supermarkets in
distressed communities.
Measure economic impact of new supermarket development on surrounding
communities.
Review existing programs designs that encourage people to eat and shop for
healthier foods.
Timeline
 FFFI launched in December 2004
 Early version of LSA created in 2007 (collaboration with The Food Trust)
 Impact assessment for CDFI Fund completed in 2008
 First LSA analysis released; FFFI winds down in 2010
 HFFI, NJFAI, and other initiatives launched in 2011
 Second LSA analysis and report released in October 2011
 TRF ReFresh initiative formed in 2014
 Most recent LSA analysis released in December 2014
 LSA Summary Brief published in April 2015
What are LSA areas?
 Areas where residents must travel
significantly farther to reach a
supermarket than the “comparative
acceptable” distance that residents
in well-served areas travel to stores
 1,807 clusters around the US
including 12,959 block groups –
average size of 11,100 people
 Areas can be prioritized based on
access, demand, and leakage data
8
Why identify LSA areas?
9
 Establish a consistent and reliable method for
measuring supermarket access nationwide
 Locate areas with the most limited access, yet
adequate demand for food retail development
 Identify priority areas for CDFIs and policymakers
operating at the city, state, regional or national level
 Deliver data in an easy to use tool that includes other
relevant social, demographic, and economic data
What do the results tell me?
10
Example:
Block Group #: 080310035003
Value:.64
This block group’s travel distance
would have to be decreased by 64%
to equal the distance traveled by its
non-LMI counterparts.
•LSA Score
•% reduction needed to
equal benchmark
What do the results tell me?
•Grocery Leakage
equals Demand minus
Sales
LSA Grocery Assessment
Retail Demand: $70,734,000
# of Limited Service Stores: 3
Existing Store Sales: $354,900
Retail Leakage:$70,379,100
Leakage Rate: 99%
# of Retail Sq Ft
Leaked:103,601
All numbers are estimated.
12
Disparity Ratios
LSA Figures for Top 5 and Bottom 5 Major Metro Areas, Based on Income Disparity
Sorted in Descending Order by Low-Income Area Disparity Ratios
Place Name
Total
Population
(2010)
Population
in LSA
% of
Pop in
LSA
% of LSA
Pop in
Low
Income
Area
Low-
Income
Area
Ratio*
Minority
Race/
Ethnicity
Ratio*
US
Rank
(51)
Major CBSA Average 3,276,224 234,397 7% 40% 1.3 1.3
Nation (Lower 48) 306,675,006 20,102,395 7% 36% 1.2 1.2
Buffalo, NY 1,135,509 82,385 7% 81% 2.9 2.7 1
Cleveland, OH 2,077,240 128,266 6% 61% 2.1 1.6 2
Pittsburgh, PA 2,356,285 208,968 9% 58% 2.1 2.4 3
Louisville, KY-IN 1,283,566 53,623 4% 60% 2.1 2.4 4
Rochester, NY 1,054,323 80,744 8% 56% 2.1 2.3 5
Las Vegas, NV 1,951,269 142,680 7% 21% 0.8 1.0 47
Seattle, WA 3,439,809 173,232 5% 17% 0.6 0.9 48
Sacramento, CA 2,149,127 181,925 8% 19% 0.6 1.2 49
San Diego, CA 3,095,313 138,186 4% 18% 0.6 0.7 50
Oklahoma City, OK 1,252,987 90,241 7% 13% 0.4 0.8 51
Sources: Trade Dimensions, 2013; TRF, 2014.
*Low-Income Area Ratios are calculated by dividing the % ofLSAresidents living in low-income communities
by the metro area's % ofall residents living in such communities. For Minority Race/Ethnicity Ratios,
substitute % ofpopulation ofminority race/ethnicity.
Industry and Current Trends
 Low-margin industry (averages 3%)
 Average supermarket has $14 million in annual sales
 Highly competitive and competes with other retail
categories
 Market share concentration can affect a new
operator’s ability to enter a market or expand
 Costs are higher in distressed communities – both
start up and operating (e.g. land assembly, staffing,
security).
Cannot
support a new
store;
consider
alternative
sources of
fresh food
such as
farmers’
markets
Yes
Cannot
support a
new store,
work with
existing
stores on
product
availability
Area can
potentially
support
small new
store*
Can
potentially
support small
new store or
expand size,
products in
existing
stores; if new
store consider
the economic
impact on
small stores*
Area can
potentially
support full
service
stores*
Area can
potentially
support full
service
super-
markets;
consider the
economic
impact of a
new store on
existing
small stores*
Area can
potentially
support
multiple full
service super-
markets;
consider the
economic
impact of a
new store on
existing small
stores*
Area can
potentially
support
multiple full
service
stores*
No intervention
needed*
No
What is the level of leakage in the
Limited Supermarket Access area?
< $7
million
No Yes
$7 - 14
million
$14-28
million
>$28
million
Is a small
store present?
No Yes
No Yes YesNo
Is a small store
present?
Is a small store
present?
Is a small store
present?
How to evaluate an LSA area?
* TRF’s analysis does not look at quality, local in-store assessments will complement this study. Practitioner may find stores that are included in the study but not providers of fresh,
healthy foods.
Market Structure Analysis
Market Structure Analysis - Major Metropolitan Areas
Florida Major Metropolitan Areas vs. Top/Middle/Bottom 10 Peer Areas
Metro Area Name 2010 Pop
CR-1
Rank
(51) CR-1
Owner w/ Highest
Market Share CR-2
Owner w/ 2nd
Highest Market
Share
Orlando 2,134,411 27 29% Publix/Jax 43% Wal Mart Sprctr
Jacksonville 1,345,596 34 33% Publix/Jax 57% Winn Dixie/Orlando
Tampa-St. Petersburg 2,783,243 40 40% Publix/Lakeland 51% Sweetbay Smkts
Miami-Fort Lauderdale 5,564,635 45 47% Publix/Miami 59% Winn Dixie/Miami
Nationwide Average 3,276,224 31% 46%
New York, NY 18,897,109 1 12% Stop & Shop/Metro 19% Costco/NE Reg
Kansas City, MO-KS 2,035,334 2 15% Hy Vee Food Stores 29% Balls Food Stores
Los Angeles, CA 12,828,837 3 15% Ralphs Grocery Co 26% Safeway/Vons Div
Philadelphia, PA 5,965,343 4 15% SuperValu/Acme 26% Giant Food Stores/PA
Dallas, TX 6,371,773 5 17% Wal Mart Sprctr 35% Kroger Co/Southwest
Las Vegas, NV 1,951,269 6 21% Smiths Food & Drug 38% SuperValu/Albertsons
Sacramento, CA 2,149,127 7 21% Safeway/NoCal 36% Raleys Smkts
Minneapolis MN 3,279,833 8 21% SuperValu/Cub Foods 33% Rainbow Foods
San Diego, CA 3,095,313 9 21% Safeway/Vons Div 35% SuperValu/Albertsons
New Orleans, LA 1,167,764 10 22% Winn Dixie/NOLA 39% Rouse Enterprises
Detroit, MI 4,296,250 21 27% Kroger Co/MI 41% Meijer
Seattle, WA 3,439,809 22 27% Safeway/Seattle 38% Quality Food Centers
Riverside, CA 4,224,851 23 27% Stater Bros Markets 35% SuperValu/Albertsons
Charlotte, NC 1,758,038 24 27% Harris Teeter 47% Food Lion/Southwest
Salt Lake City, UT 1,124,197 25 27% Smiths Food & Drug 39% Wal Mart Sprctr
St. Louis, MO-IL 2,812,896 26 29% Schnuck Markets 44% Shop N Save
San Jose, CA 1,836,911 28 29% Safeway/NoCal 45% Costco/N CA
Washington, DC 5,582,170 30 30% Giant Food/MD 45% Safeway/Eastern
Indianapolis, IN 1,756,241 31 31% Kroger Co/Central 48% Marsh Smkts/C&S
San Francisco, CA 4,335,391 32 31% Safeway/NoCal 44% Costco/N CA
Columbus, OH 1,836,536 42 40% Kroger Co/Columbus Div60% Giant Eagle
Memphis, TN 1,316,100 43 40% Kroger Co/Delta Area 54% Wal Mart Sprctr
Providence, RI 1,600,852 44 41% Stop & Shop/NE 56% SuperValu/Shaws
Rochester, NY 1,054,323 46 48% Wegmans 64% Tops Markets
Milwaukee, WI 1,555,908 47 49% Roundys Smkts 56% Wal Mart Sprctr
Louisville, KY 1,283,566 48 53% Kroger Co/MidSouth 64% Wal Mart Sprctr
Cincinnati, OH 2,130,151 49 58% Kroger Co/Cincinnati 67% Wal Mart Sprctr
Austin, TX 1,716,289 50 61% H E Butt Grocery Co 70% Wal Mart Sprctr
San Antonio, TX 2,142,508 51 63% H E Butt Grocery Co 76% Wal Mart Sprctr
FFFI Logic Model
Measure Outcomes & Assess Impacts
 Establishing clear expectations for borrowers, funders,
public and lending staff on each organization’s priorities
 Measure and document your results to attract additional
funders and share your success
 Establish realistic goals and assess progress on regular
intervals:
How many loans? What type of projects? Who are your
borrowers? Who is benefiting? LSA population effected?
LSA Population Trends
Top 10 and Bottom 10 States, Based on Percentage Decrease in LSA Population from 2005 to 2013
Sorted in Descending Order by the % Chg 2005-2013 column.
State 2005 2008 2011 2013
% Chg
2005-
2008
% Chg
2008-
2011
% Chg
2011-
2013
% Chg
2005-
2013 Rank
NORTH DAKOTA 155,145 115,722 83,178 42,155 -25% -28% -49% -73% 1
MAINE 147,991 104,101 47,638 46,037 -30% -54% -3% -69% 2
NEW YORK 2,376,253 1,796,972 1,362,938 806,701 -24% -24% -41% -66% 3
WYOMING 35,989 26,721 16,474 12,940 -26% -38% -21% -64% 4
IOWA 180,757 155,321 102,706 65,886 -14% -34% -36% -64% 5
INDIANA 817,198 686,586 474,690 334,330 -16% -31% -30% -59% 6
ARKANSAS 278,356 218,656 157,418 115,958 -21% -28% -26% -58% 7
MISSISSIPPI 330,752 224,317 167,476 144,697 -32% -25% -14% -56% 8
PENNSYLVANIA 1,798,185 1,472,406 1,004,854 792,571 -18% -32% -21% -56% 9
WISCONSIN 600,020 439,834 347,160 266,050 -27% -21% -23% -56% 10
WASHINGTON 562,750 495,459 417,774 375,821 -12% -16% -10% -33% 39
MISSOURI 522,298 443,256 381,403 358,758 -15% -14% -6% -31% 40
LOUISIANA 652,798 589,496 489,279 455,434 -10% -17% -7% -30% 41
MARYLAND 744,010 657,507 533,163 524,524 -12% -19% -2% -30% 42
COLORADO 481,586 453,784 392,874 360,848 -6% -13% -8% -25% 43
KANSAS 194,018 157,046 166,975 146,134 -19% 6% -12% -25% 44
ARIZONA 987,570 775,004 771,367 750,978 -22% 0% -3% -24% 45
NEBRASKA 164,053 150,489 139,568 132,722 -8% -7% -5% -19% 46
RHODE ISLAND 130,719 126,989 113,826 107,573 -3% -10% -5% -18% 47
WASHINGTON, DC 107,723 106,934 94,657 94,423 -1% -11% 0% -12% 48
Impact Assessment
Impact Assessment
Impact Assessment
Impact Assessment
Additional Market Analysis
Huff Trade Area Model
 Identifies a supermarket’s primary trade area (PTA)
Accounts for nearby, competing stores
Uses square feet and distance as gravitational coefficients
 Can be analyzed for new or existing supermarkets
 Areas where PTA and LSA area boundaries intersect
Intersections represent populations that are both underserved
and likely to shop at proposed/renovated store
Contact Information
Lance Loethen
Research Associate
Policy Solutions, TRF
lance.loethen@trfund.com
TRF Policy Solutions

Mapchats: Mapping Food Access - Lance Loethen

  • 2.
  • 3.
    Using Spatial Dataand Analysis to Inform TRF’s Supermarket Financing Initiatives April 21, 2015 TRF Policy Solutions www.trfund.com
  • 4.
    TRF Profile •Real Estate Development •PolicySolutions •Business Lines  $1.4 billion in cumulative investments and loans throughout the mid-Atlantic.  Currently manage $801 million in capital, with more than 850 investors.  Top AERIS score of AAA+1 (most recent 2014). TRF is 1 of only 5 CDFIs in the country with the top rating. •Lending and Investing •PolicyMap •The Reinvestment Fund builds wealth and opportunity for low-wealth people and places through the promotion of socially and environmentally responsible development. •@trfund •www.trfund.com •www.policymap.com
  • 5.
    TRF and Supermarkets TRFworks to reduce inequitable access to healthy foods by: • Financing viable, mission-fit food retail options • Advocating to increase public awareness of food access • Conducting policy research related to supermarket development, food systems, and free and reduced price lunch programs • Providing technical assistance to CDFIs, foundations, and other organizations to close the gap in access/knowledge
  • 6.
    Healthy Food AccessResearch TRF studies topics related to improving access to healthier foods in low-income communities. Identify areas with inadequate access to supermarkets and quantify potential market viability: LSA Analysis Analyze market competition: Market Structure Analysis Examine the economic barriers to opening and operating supermarkets in distressed communities. Measure economic impact of new supermarket development on surrounding communities. Review existing programs designs that encourage people to eat and shop for healthier foods.
  • 7.
    Timeline  FFFI launchedin December 2004  Early version of LSA created in 2007 (collaboration with The Food Trust)  Impact assessment for CDFI Fund completed in 2008  First LSA analysis released; FFFI winds down in 2010  HFFI, NJFAI, and other initiatives launched in 2011  Second LSA analysis and report released in October 2011  TRF ReFresh initiative formed in 2014  Most recent LSA analysis released in December 2014  LSA Summary Brief published in April 2015
  • 8.
    What are LSAareas?  Areas where residents must travel significantly farther to reach a supermarket than the “comparative acceptable” distance that residents in well-served areas travel to stores  1,807 clusters around the US including 12,959 block groups – average size of 11,100 people  Areas can be prioritized based on access, demand, and leakage data 8
  • 9.
    Why identify LSAareas? 9  Establish a consistent and reliable method for measuring supermarket access nationwide  Locate areas with the most limited access, yet adequate demand for food retail development  Identify priority areas for CDFIs and policymakers operating at the city, state, regional or national level  Deliver data in an easy to use tool that includes other relevant social, demographic, and economic data
  • 10.
    What do theresults tell me? 10 Example: Block Group #: 080310035003 Value:.64 This block group’s travel distance would have to be decreased by 64% to equal the distance traveled by its non-LMI counterparts. •LSA Score •% reduction needed to equal benchmark
  • 11.
    What do theresults tell me? •Grocery Leakage equals Demand minus Sales LSA Grocery Assessment Retail Demand: $70,734,000 # of Limited Service Stores: 3 Existing Store Sales: $354,900 Retail Leakage:$70,379,100 Leakage Rate: 99% # of Retail Sq Ft Leaked:103,601 All numbers are estimated.
  • 12.
    12 Disparity Ratios LSA Figuresfor Top 5 and Bottom 5 Major Metro Areas, Based on Income Disparity Sorted in Descending Order by Low-Income Area Disparity Ratios Place Name Total Population (2010) Population in LSA % of Pop in LSA % of LSA Pop in Low Income Area Low- Income Area Ratio* Minority Race/ Ethnicity Ratio* US Rank (51) Major CBSA Average 3,276,224 234,397 7% 40% 1.3 1.3 Nation (Lower 48) 306,675,006 20,102,395 7% 36% 1.2 1.2 Buffalo, NY 1,135,509 82,385 7% 81% 2.9 2.7 1 Cleveland, OH 2,077,240 128,266 6% 61% 2.1 1.6 2 Pittsburgh, PA 2,356,285 208,968 9% 58% 2.1 2.4 3 Louisville, KY-IN 1,283,566 53,623 4% 60% 2.1 2.4 4 Rochester, NY 1,054,323 80,744 8% 56% 2.1 2.3 5 Las Vegas, NV 1,951,269 142,680 7% 21% 0.8 1.0 47 Seattle, WA 3,439,809 173,232 5% 17% 0.6 0.9 48 Sacramento, CA 2,149,127 181,925 8% 19% 0.6 1.2 49 San Diego, CA 3,095,313 138,186 4% 18% 0.6 0.7 50 Oklahoma City, OK 1,252,987 90,241 7% 13% 0.4 0.8 51 Sources: Trade Dimensions, 2013; TRF, 2014. *Low-Income Area Ratios are calculated by dividing the % ofLSAresidents living in low-income communities by the metro area's % ofall residents living in such communities. For Minority Race/Ethnicity Ratios, substitute % ofpopulation ofminority race/ethnicity.
  • 13.
    Industry and CurrentTrends  Low-margin industry (averages 3%)  Average supermarket has $14 million in annual sales  Highly competitive and competes with other retail categories  Market share concentration can affect a new operator’s ability to enter a market or expand  Costs are higher in distressed communities – both start up and operating (e.g. land assembly, staffing, security).
  • 14.
    Cannot support a new store; consider alternative sourcesof fresh food such as farmers’ markets Yes Cannot support a new store, work with existing stores on product availability Area can potentially support small new store* Can potentially support small new store or expand size, products in existing stores; if new store consider the economic impact on small stores* Area can potentially support full service stores* Area can potentially support full service super- markets; consider the economic impact of a new store on existing small stores* Area can potentially support multiple full service super- markets; consider the economic impact of a new store on existing small stores* Area can potentially support multiple full service stores* No intervention needed* No What is the level of leakage in the Limited Supermarket Access area? < $7 million No Yes $7 - 14 million $14-28 million >$28 million Is a small store present? No Yes No Yes YesNo Is a small store present? Is a small store present? Is a small store present? How to evaluate an LSA area? * TRF’s analysis does not look at quality, local in-store assessments will complement this study. Practitioner may find stores that are included in the study but not providers of fresh, healthy foods.
  • 15.
    Market Structure Analysis MarketStructure Analysis - Major Metropolitan Areas Florida Major Metropolitan Areas vs. Top/Middle/Bottom 10 Peer Areas Metro Area Name 2010 Pop CR-1 Rank (51) CR-1 Owner w/ Highest Market Share CR-2 Owner w/ 2nd Highest Market Share Orlando 2,134,411 27 29% Publix/Jax 43% Wal Mart Sprctr Jacksonville 1,345,596 34 33% Publix/Jax 57% Winn Dixie/Orlando Tampa-St. Petersburg 2,783,243 40 40% Publix/Lakeland 51% Sweetbay Smkts Miami-Fort Lauderdale 5,564,635 45 47% Publix/Miami 59% Winn Dixie/Miami Nationwide Average 3,276,224 31% 46% New York, NY 18,897,109 1 12% Stop & Shop/Metro 19% Costco/NE Reg Kansas City, MO-KS 2,035,334 2 15% Hy Vee Food Stores 29% Balls Food Stores Los Angeles, CA 12,828,837 3 15% Ralphs Grocery Co 26% Safeway/Vons Div Philadelphia, PA 5,965,343 4 15% SuperValu/Acme 26% Giant Food Stores/PA Dallas, TX 6,371,773 5 17% Wal Mart Sprctr 35% Kroger Co/Southwest Las Vegas, NV 1,951,269 6 21% Smiths Food & Drug 38% SuperValu/Albertsons Sacramento, CA 2,149,127 7 21% Safeway/NoCal 36% Raleys Smkts Minneapolis MN 3,279,833 8 21% SuperValu/Cub Foods 33% Rainbow Foods San Diego, CA 3,095,313 9 21% Safeway/Vons Div 35% SuperValu/Albertsons New Orleans, LA 1,167,764 10 22% Winn Dixie/NOLA 39% Rouse Enterprises Detroit, MI 4,296,250 21 27% Kroger Co/MI 41% Meijer Seattle, WA 3,439,809 22 27% Safeway/Seattle 38% Quality Food Centers Riverside, CA 4,224,851 23 27% Stater Bros Markets 35% SuperValu/Albertsons Charlotte, NC 1,758,038 24 27% Harris Teeter 47% Food Lion/Southwest Salt Lake City, UT 1,124,197 25 27% Smiths Food & Drug 39% Wal Mart Sprctr St. Louis, MO-IL 2,812,896 26 29% Schnuck Markets 44% Shop N Save San Jose, CA 1,836,911 28 29% Safeway/NoCal 45% Costco/N CA Washington, DC 5,582,170 30 30% Giant Food/MD 45% Safeway/Eastern Indianapolis, IN 1,756,241 31 31% Kroger Co/Central 48% Marsh Smkts/C&S San Francisco, CA 4,335,391 32 31% Safeway/NoCal 44% Costco/N CA Columbus, OH 1,836,536 42 40% Kroger Co/Columbus Div60% Giant Eagle Memphis, TN 1,316,100 43 40% Kroger Co/Delta Area 54% Wal Mart Sprctr Providence, RI 1,600,852 44 41% Stop & Shop/NE 56% SuperValu/Shaws Rochester, NY 1,054,323 46 48% Wegmans 64% Tops Markets Milwaukee, WI 1,555,908 47 49% Roundys Smkts 56% Wal Mart Sprctr Louisville, KY 1,283,566 48 53% Kroger Co/MidSouth 64% Wal Mart Sprctr Cincinnati, OH 2,130,151 49 58% Kroger Co/Cincinnati 67% Wal Mart Sprctr Austin, TX 1,716,289 50 61% H E Butt Grocery Co 70% Wal Mart Sprctr San Antonio, TX 2,142,508 51 63% H E Butt Grocery Co 76% Wal Mart Sprctr
  • 16.
  • 17.
    Measure Outcomes &Assess Impacts  Establishing clear expectations for borrowers, funders, public and lending staff on each organization’s priorities  Measure and document your results to attract additional funders and share your success  Establish realistic goals and assess progress on regular intervals: How many loans? What type of projects? Who are your borrowers? Who is benefiting? LSA population effected?
  • 18.
    LSA Population Trends Top10 and Bottom 10 States, Based on Percentage Decrease in LSA Population from 2005 to 2013 Sorted in Descending Order by the % Chg 2005-2013 column. State 2005 2008 2011 2013 % Chg 2005- 2008 % Chg 2008- 2011 % Chg 2011- 2013 % Chg 2005- 2013 Rank NORTH DAKOTA 155,145 115,722 83,178 42,155 -25% -28% -49% -73% 1 MAINE 147,991 104,101 47,638 46,037 -30% -54% -3% -69% 2 NEW YORK 2,376,253 1,796,972 1,362,938 806,701 -24% -24% -41% -66% 3 WYOMING 35,989 26,721 16,474 12,940 -26% -38% -21% -64% 4 IOWA 180,757 155,321 102,706 65,886 -14% -34% -36% -64% 5 INDIANA 817,198 686,586 474,690 334,330 -16% -31% -30% -59% 6 ARKANSAS 278,356 218,656 157,418 115,958 -21% -28% -26% -58% 7 MISSISSIPPI 330,752 224,317 167,476 144,697 -32% -25% -14% -56% 8 PENNSYLVANIA 1,798,185 1,472,406 1,004,854 792,571 -18% -32% -21% -56% 9 WISCONSIN 600,020 439,834 347,160 266,050 -27% -21% -23% -56% 10 WASHINGTON 562,750 495,459 417,774 375,821 -12% -16% -10% -33% 39 MISSOURI 522,298 443,256 381,403 358,758 -15% -14% -6% -31% 40 LOUISIANA 652,798 589,496 489,279 455,434 -10% -17% -7% -30% 41 MARYLAND 744,010 657,507 533,163 524,524 -12% -19% -2% -30% 42 COLORADO 481,586 453,784 392,874 360,848 -6% -13% -8% -25% 43 KANSAS 194,018 157,046 166,975 146,134 -19% 6% -12% -25% 44 ARIZONA 987,570 775,004 771,367 750,978 -22% 0% -3% -24% 45 NEBRASKA 164,053 150,489 139,568 132,722 -8% -7% -5% -19% 46 RHODE ISLAND 130,719 126,989 113,826 107,573 -3% -10% -5% -18% 47 WASHINGTON, DC 107,723 106,934 94,657 94,423 -1% -11% 0% -12% 48
  • 19.
  • 20.
  • 21.
  • 22.
  • 23.
    Additional Market Analysis HuffTrade Area Model  Identifies a supermarket’s primary trade area (PTA) Accounts for nearby, competing stores Uses square feet and distance as gravitational coefficients  Can be analyzed for new or existing supermarkets  Areas where PTA and LSA area boundaries intersect Intersections represent populations that are both underserved and likely to shop at proposed/renovated store
  • 24.
    Contact Information Lance Loethen ResearchAssociate Policy Solutions, TRF lance.loethen@trfund.com TRF Policy Solutions