SlideShare a Scribd company logo
1 of 13
Download to read offline
Adam Steinberg                           financial Research


    adam
steinberg

Building intuition into the Macro Environment
    [Type
the
abstract
of
the
document
here.
The
abstract
is
typically
a
short
summary
of
the

and understanding the earnings discrepancy
    contents
of
the
document.]

July/Aug 2009


      [Company
Address]


                                                          1
Introduction

Simply put: Where will the company earnings, buying power and credit come
from to support our ideas of normal in relation to index averages, asset prices
and GDP?

To build intuition into a look at the past two decades in the US economy, it’s
natural to want to understand

a) The conditions that appeared constant, abnormal, and/or correlated
(uniquely or otherwise) to the period in question (roughly 1993 to present day
2009).

b) The link between those conditions and the corresponding values for assets.

And, importantly, eventually to ask what factors in the study would serve as
determinants for the future.

Plainly, would the gradations between prosperity and despair be dependent or
independent of the factors that created them in the past.

If credit fueled growth and prosperity for a given era, would credit be needed
for the same level of prosperity in the future?

If consumer spending has fueled US GDP in the post WWII era, does that mean
it’s necessary in the future for the same levels of domestic prosperity? And could
said spending levels be possible without generous amounts of leverage offered
to the consumer?

Think of it this way
The growth of the U.S. economy in the last decade was fueled by consumer
spending (70% of GDP)—and enabled through the credit expanding
phenomenon that increasing demand for Home and Auto loans by individual
households, quantitative easing, and the repeal of the Glass-Steagall act (Nov
12 ,1999) created.
                                        2
On the front end of the credit lifecycle was the extension of money to the
consumer; the life cycle tapered off with dispersion of those loans as securities
globally, and then finally through derivatives and multiple re-distributions as the
money flow multiplied to exponentially.

This cycle has been irrevocably altered across the socio-economic, as well as
macro-economic food chain—with the consumers attitude to home buying
irrevocably altered and an inevitable move to the upside in interest rates
pending, the overall participation rates will be lower than average.


This view is only compounded by the demand dampening occurring through
decreasing wages, currency values, and employment.

Most simply said, a demand slump in the desire for new homes—and the sheer
lack of mortgages to make up CDOs not only serves as a dampening factor in
asset prices and GDP but cool off (if not breaks) the consumer credit/spending
bubble that the new American prosperity hinged itself on.

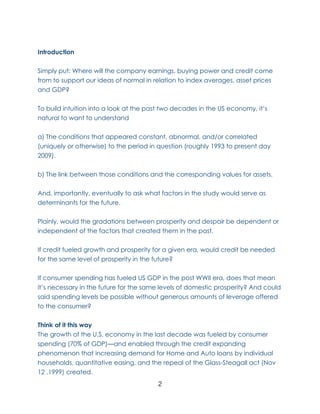
As the recession/depression seeped into the real economy in 2008, spending
began to reflect reality.


                                         3
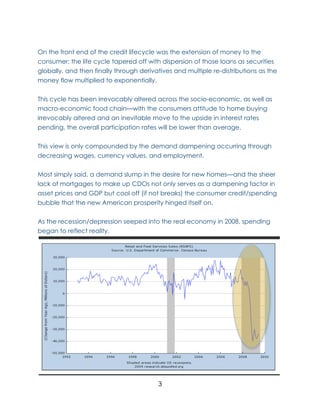
Previous to 2008, access to personal lines of credit enabled the consumer to
funnel trillions of dollars into industry via equity withdrawals.


Where did that money go?
To name a few: Home Depot, Starbucks, Las Vegas, Vacationing, Whole Foods,
The high end goods industry boomed with names like Pottery Barn and Apple.

As home equity withdrawals peaked between 04’ and 07’
So did the earnings of America’s ruling retail players. This could bring up a
conversation surrounding just how good business was at doing business in this
period. Pointedly, could anyone make money in this era just by virtue of showing
up?


                                       4
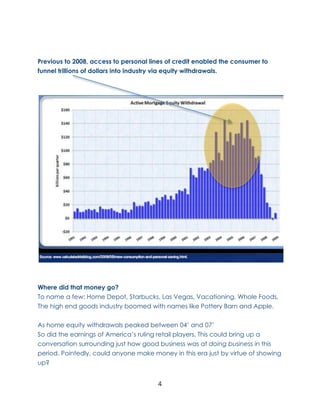
Consumer favorite Starbucks’ stock price peaked in unison with the equity
withdrawals.


Outspending Prosperity

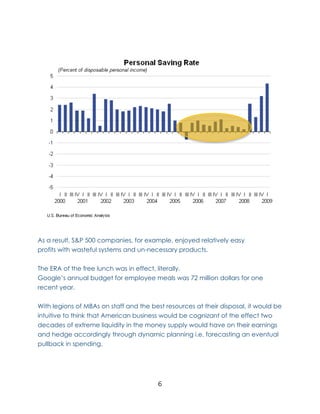
As the amount of wealth in the economy started to peak in 05’ the national
savings rate turned negative.

The consumer had little discretion in discretionary spending, and obviously felt
compelled by aforementioned retail good providers to go into further debt.


                                        5
As a result, S&P 500 companies, for example, enjoyed relatively easy
profits with wasteful systems and un-necessary products.

The ERA of the free lunch was in effect, literally.
Google’s annual budget for employee meals was 72 million dollars for one
recent year.

With legions of MBAs on staff and the best resources at their disposal, it would be
intuitive to think that American business would be cognizant of the effect two
decades of extreme liquidity in the money supply would have on their earnings
and hedge accordingly through dynamic planning i.e. forecasting an eventual
pullback in spending.


                                        6
Alas, this wasn’t the case as legions of CEOs cited the “Macro” environment
catching them off guard vis-à-vis an exotic and villainous set of rogues from Wall
Street.

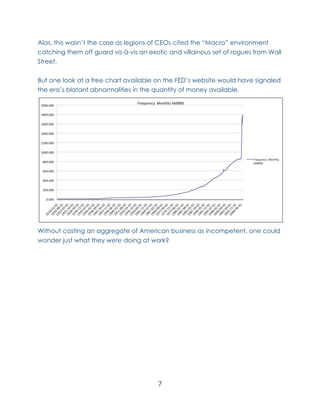
But one look at a free chart available on the FED’s website would have signaled
the era’s blatant abnormalities in the quantity of money available.


Without casting an aggregate of American business as incompetent, one could
wonder just what they were doing at work?


                                        7
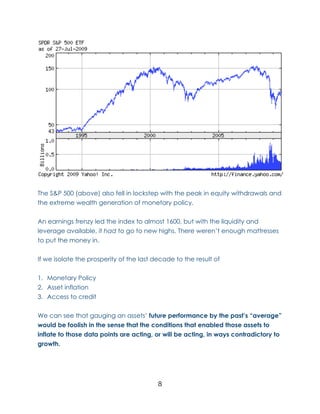
The S&P 500 (above) also fell in lockstep with the peak in equity withdrawals and
the extreme wealth generation of monetary policy.

An earnings frenzy led the index to almost 1600, but with the liquidity and
leverage available, it had to go to new highs. There weren’t enough mattresses
to put the money in.

If we isolate the prosperity of the last decade to the result of

1. Monetary Policy
2. Asset inflation
3. Access to credit

We can see that gauging an assets’ future performance by the past’s “average”
would be foolish in the sense that the conditions that enabled those assets to
inflate to those data points are acting, or will be acting, in ways contradictory to
growth.


                                          8
The reality
A. Monetary policy will have to get tighter, eventually, which will constrict
enterprise and credit lines.

B. Asset valuations are deflating. And even if they stabilize, a “normal” year over
year appreciation seems unlikely.

C. Lines of credit are shrinking drastically, why would “normal” be “normal” (e.g.
El Erian’s new normal). What will replace those equity withdrawals?

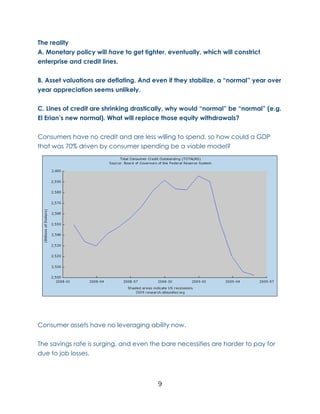
Consumers have no credit and are less willing to spend, so how could a GDP
that was 70% driven by consumer spending be a viable model?


Consumer assets have no leveraging ability now.

The savings rate is surging, and even the bare necessities are harder to pay for
due to job losses.


                                         9
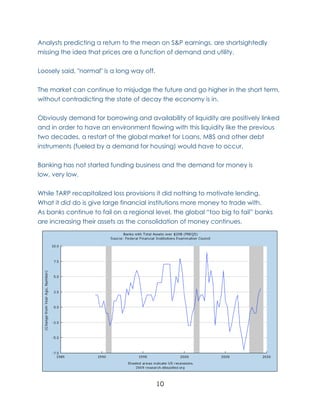
Analysts predicting a return to the mean on S&P earnings, are shortsightedly
missing the idea that prices are a function of demand and utility.

Loosely said, "normal" is a long way off.

The market can continue to misjudge the future and go higher in the short term,
without contradicting the state of decay the economy is in.

Obviously demand for borrowing and availability of liquidity are positively linked
and in order to have an environment flowing with this liquidity like the previous
two decades, a restart of the global market for Loans, MBS and other debt
instruments (fueled by a demand for housing) would have to occur.

Banking has not started funding business and the demand for money is
low, very low.

While TARP recapitalized loss provisions it did nothing to motivate lending.
What it did do is give large financial institutions more money to trade with.
As banks continue to fail on a regional level, the global “too big to fail” banks
are increasing their assets as the consolidation of money continues.


                                            10
While wall street priced in a robust recovery from March to Aug 09’, resulting in
earnings multiples of 16 and counting, they discounted the coming CRE and
prime loan defaults—and are no longer pricing any considerable risk into stocks
or US economy in general.

Underestimating the coming impact, overestimating the Governments
effectiveness in dealing with the coming issues, and assuming a return to
business as usual has lead equity prices too high and too fast.

That's one problem: but Wall Street priced these stocks from an
Inflation perspective, while all signs (in the shorter term) lead to a
deflation or stagflation environment.

As asset prices begin to reflect real earnings, top-line sales, and restricted credit
conditions, where will the market find optimism and upward pressure?

Does American business have any more rabbits in the hat?

After the lay-offs, cost cutting, and efficiency measures, will there be demand
for their products in the face of worsening macro data?

The question, simply, remains: Where will the money come from?


                                          11
8/2/09 5:06 PM


12
8/2/09 5:06 PM


                13
Adam Steinberg, Research 2009
 Adamsteinberg1@gmail.com

More Related Content

What's hot

Cardinal Quarterly July 2012
Cardinal Quarterly July 2012Cardinal Quarterly July 2012
Cardinal Quarterly July 2012KimGibson
 
BrandShelter - July 2011 Update
BrandShelter - July 2011 UpdateBrandShelter - July 2011 Update
BrandShelter - July 2011 UpdateLeo Burnett
 
2009 By Niall Ferguson
2009 By Niall Ferguson2009 By Niall Ferguson
2009 By Niall FergusonLuis Orozco
 
US Real Estate Housing Market: A Case For Reasonable Optimisim?
US Real Estate Housing Market:   A Case For Reasonable Optimisim?US Real Estate Housing Market:   A Case For Reasonable Optimisim?
US Real Estate Housing Market: A Case For Reasonable Optimisim?Markets Beyond
 
Jg letter shortest_letterever_3q11
Jg letter shortest_letterever_3q11Jg letter shortest_letterever_3q11
Jg letter shortest_letterever_3q11Frank Ragol
 
Residential Builder Seminar Presentation
Residential Builder Seminar PresentationResidential Builder Seminar Presentation
Residential Builder Seminar Presentationdougiemac1
 
OXBOW ADVISORS APRIL 2017 MARKET COMMENTS
OXBOW ADVISORS APRIL 2017 MARKET COMMENTSOXBOW ADVISORS APRIL 2017 MARKET COMMENTS
OXBOW ADVISORS APRIL 2017 MARKET COMMENTSKeys Oakley
 
11 This Month In Real Estate November Canada
11 This Month In Real Estate   November   Canada11 This Month In Real Estate   November   Canada
11 This Month In Real Estate November CanadaKeller Williams Careers
 
Matthew Cunningham Sept Newsletter
Matthew Cunningham Sept NewsletterMatthew Cunningham Sept Newsletter
Matthew Cunningham Sept Newslettermjcunny
 
Setting the Record Straight
Setting the Record StraightSetting the Record Straight
Setting the Record StraightPeter Graf
 
Analysis Of Credit Crisis of 2008 - 2010
Analysis Of Credit Crisis of 2008 - 2010Analysis Of Credit Crisis of 2008 - 2010
Analysis Of Credit Crisis of 2008 - 2010Robert Malvin
 
Ricardo V Lago Business Forum University Of Miami 15 Jan 2009
Ricardo V Lago  Business Forum  University Of Miami  15  Jan  2009Ricardo V Lago  Business Forum  University Of Miami  15  Jan  2009
Ricardo V Lago Business Forum University Of Miami 15 Jan 2009neiracar
 
This Month in Real Estate for Canada - Feb. 2010
This Month in Real Estate for Canada - Feb. 2010This Month in Real Estate for Canada - Feb. 2010
This Month in Real Estate for Canada - Feb. 2010Keller Williams Careers
 
Greenlight q3-2013
Greenlight q3-2013Greenlight q3-2013
Greenlight q3-2013Frank Ragol
 
Greybriar Partners Presentations V
Greybriar Partners Presentations VGreybriar Partners Presentations V
Greybriar Partners Presentations Vdgfoxus
 
Leading_through_complexity_A_view_from_hospitality_CEOs
Leading_through_complexity_A_view_from_hospitality_CEOsLeading_through_complexity_A_view_from_hospitality_CEOs
Leading_through_complexity_A_view_from_hospitality_CEOsSophy Gurney
 

What's hot (17)

Cardinal Quarterly July 2012
Cardinal Quarterly July 2012Cardinal Quarterly July 2012
Cardinal Quarterly July 2012
 
BrandShelter - July 2011 Update
BrandShelter - July 2011 UpdateBrandShelter - July 2011 Update
BrandShelter - July 2011 Update
 
2009 By Niall Ferguson
2009 By Niall Ferguson2009 By Niall Ferguson
2009 By Niall Ferguson
 
US Real Estate Housing Market: A Case For Reasonable Optimisim?
US Real Estate Housing Market:   A Case For Reasonable Optimisim?US Real Estate Housing Market:   A Case For Reasonable Optimisim?
US Real Estate Housing Market: A Case For Reasonable Optimisim?
 
Jg letter shortest_letterever_3q11
Jg letter shortest_letterever_3q11Jg letter shortest_letterever_3q11
Jg letter shortest_letterever_3q11
 
Residential Builder Seminar Presentation
Residential Builder Seminar PresentationResidential Builder Seminar Presentation
Residential Builder Seminar Presentation
 
OXBOW ADVISORS APRIL 2017 MARKET COMMENTS
OXBOW ADVISORS APRIL 2017 MARKET COMMENTSOXBOW ADVISORS APRIL 2017 MARKET COMMENTS
OXBOW ADVISORS APRIL 2017 MARKET COMMENTS
 
11 This Month In Real Estate November Canada
11 This Month In Real Estate   November   Canada11 This Month In Real Estate   November   Canada
11 This Month In Real Estate November Canada
 
Matthew Cunningham Sept Newsletter
Matthew Cunningham Sept NewsletterMatthew Cunningham Sept Newsletter
Matthew Cunningham Sept Newsletter
 
Setting the Record Straight
Setting the Record StraightSetting the Record Straight
Setting the Record Straight
 
Analysis Of Credit Crisis of 2008 - 2010
Analysis Of Credit Crisis of 2008 - 2010Analysis Of Credit Crisis of 2008 - 2010
Analysis Of Credit Crisis of 2008 - 2010
 
Ricardo V Lago Business Forum University Of Miami 15 Jan 2009
Ricardo V Lago  Business Forum  University Of Miami  15  Jan  2009Ricardo V Lago  Business Forum  University Of Miami  15  Jan  2009
Ricardo V Lago Business Forum University Of Miami 15 Jan 2009
 
This Month in Real Estate for Canada - Feb. 2010
This Month in Real Estate for Canada - Feb. 2010This Month in Real Estate for Canada - Feb. 2010
This Month in Real Estate for Canada - Feb. 2010
 
Greenlight q3-2013
Greenlight q3-2013Greenlight q3-2013
Greenlight q3-2013
 
Recession
RecessionRecession
Recession
 
Greybriar Partners Presentations V
Greybriar Partners Presentations VGreybriar Partners Presentations V
Greybriar Partners Presentations V
 
Leading_through_complexity_A_view_from_hospitality_CEOs
Leading_through_complexity_A_view_from_hospitality_CEOsLeading_through_complexity_A_view_from_hospitality_CEOs
Leading_through_complexity_A_view_from_hospitality_CEOs
 

Similar to Macroresearch

2010 Financial Markets Outlook_2010_With Cover_2010 vf
2010 Financial Markets Outlook_2010_With Cover_2010 vf2010 Financial Markets Outlook_2010_With Cover_2010 vf
2010 Financial Markets Outlook_2010_With Cover_2010 vfAndrew Kessler
 
Measuring the market
Measuring the marketMeasuring the market
Measuring the marketSocial MEDIA
 
Secular StagnationWhy Might Equilibriu.docx
Secular StagnationWhy Might Equilibriu.docxSecular StagnationWhy Might Equilibriu.docx
Secular StagnationWhy Might Equilibriu.docxedgar6wallace88877
 
Secular StagnationWhy Might Equilibriu.docx
Secular StagnationWhy Might Equilibriu.docxSecular StagnationWhy Might Equilibriu.docx
Secular StagnationWhy Might Equilibriu.docxjeffreye3
 
MT-Fundamental Recap 2007-2009 Final
MT-Fundamental Recap  2007-2009 FinalMT-Fundamental Recap  2007-2009 Final
MT-Fundamental Recap 2007-2009 FinalJim Welsh
 
Outlook For Commodities
Outlook For CommoditiesOutlook For Commodities
Outlook For CommoditiesRusNewton
 
Michael Durante Western Reserve March 2011- Camel Race
Michael Durante Western Reserve March 2011- Camel RaceMichael Durante Western Reserve March 2011- Camel Race
Michael Durante Western Reserve March 2011- Camel RaceMichael Durante
 
Michael Durante Western Reserve Blackwall Partners Camel Race
Michael Durante Western Reserve Blackwall Partners Camel RaceMichael Durante Western Reserve Blackwall Partners Camel Race
Michael Durante Western Reserve Blackwall Partners Camel RaceMichael Durante
 
Deloitte reports consumer 2020
Deloitte reports   consumer 2020Deloitte reports   consumer 2020
Deloitte reports consumer 2020Rajon-Shagufta
 
FMA of NH: Safeguarding Cash
FMA of NH: Safeguarding CashFMA of NH: Safeguarding Cash
FMA of NH: Safeguarding Cashtravismd
 
Michael Durante Western Reserve Blackwall Partners 2011 outlook primer- final
Michael Durante Western Reserve Blackwall Partners   2011 outlook primer- finalMichael Durante Western Reserve Blackwall Partners   2011 outlook primer- final
Michael Durante Western Reserve Blackwall Partners 2011 outlook primer- finalMichael Durante
 
Occam\'s Razor - Inflation (Sept. 2009)
Occam\'s Razor - Inflation (Sept. 2009)Occam\'s Razor - Inflation (Sept. 2009)
Occam\'s Razor - Inflation (Sept. 2009)MAMC84
 
Occam\'s Razor on Inflation
Occam\'s Razor on InflationOccam\'s Razor on Inflation
Occam\'s Razor on InflationMAMC84
 
The Hourglass Effect - A Decade of Displacement
The Hourglass Effect - A Decade of DisplacementThe Hourglass Effect - A Decade of Displacement
The Hourglass Effect - A Decade of DisplacementFrank Rotman
 
American crises in 2007 hard copy
American crises in 2007 hard copyAmerican crises in 2007 hard copy
American crises in 2007 hard copyDharmik
 
Us economy goldilocks- 4th oct 2007 published in singapore times
Us economy   goldilocks- 4th oct 2007 published in singapore timesUs economy   goldilocks- 4th oct 2007 published in singapore times
Us economy goldilocks- 4th oct 2007 published in singapore timessatya saurabh khosla
 
Polymetis White Paper 200901
Polymetis White Paper 200901Polymetis White Paper 200901
Polymetis White Paper 200901tpkcfa
 

Similar to Macroresearch (20)

2009 Market Outlook
2009 Market Outlook2009 Market Outlook
2009 Market Outlook
 
2010 Financial Markets Outlook_2010_With Cover_2010 vf
2010 Financial Markets Outlook_2010_With Cover_2010 vf2010 Financial Markets Outlook_2010_With Cover_2010 vf
2010 Financial Markets Outlook_2010_With Cover_2010 vf
 
Measuring the market
Measuring the marketMeasuring the market
Measuring the market
 
Secular StagnationWhy Might Equilibriu.docx
Secular StagnationWhy Might Equilibriu.docxSecular StagnationWhy Might Equilibriu.docx
Secular StagnationWhy Might Equilibriu.docx
 
Secular StagnationWhy Might Equilibriu.docx
Secular StagnationWhy Might Equilibriu.docxSecular StagnationWhy Might Equilibriu.docx
Secular StagnationWhy Might Equilibriu.docx
 
MT-Fundamental Recap 2007-2009 Final
MT-Fundamental Recap  2007-2009 FinalMT-Fundamental Recap  2007-2009 Final
MT-Fundamental Recap 2007-2009 Final
 
CASPAR BENSONGETTY IMA
CASPAR BENSONGETTY IMACASPAR BENSONGETTY IMA
CASPAR BENSONGETTY IMA
 
Outlook For Commodities
Outlook For CommoditiesOutlook For Commodities
Outlook For Commodities
 
Michael Durante Western Reserve March 2011- Camel Race
Michael Durante Western Reserve March 2011- Camel RaceMichael Durante Western Reserve March 2011- Camel Race
Michael Durante Western Reserve March 2011- Camel Race
 
Michael Durante Western Reserve Blackwall Partners Camel Race
Michael Durante Western Reserve Blackwall Partners Camel RaceMichael Durante Western Reserve Blackwall Partners Camel Race
Michael Durante Western Reserve Blackwall Partners Camel Race
 
Deloitte reports consumer 2020
Deloitte reports   consumer 2020Deloitte reports   consumer 2020
Deloitte reports consumer 2020
 
FMA of NH: Safeguarding Cash
FMA of NH: Safeguarding CashFMA of NH: Safeguarding Cash
FMA of NH: Safeguarding Cash
 
Michael Durante Western Reserve Blackwall Partners 2011 outlook primer- final
Michael Durante Western Reserve Blackwall Partners   2011 outlook primer- finalMichael Durante Western Reserve Blackwall Partners   2011 outlook primer- final
Michael Durante Western Reserve Blackwall Partners 2011 outlook primer- final
 
Occam\'s Razor - Inflation (Sept. 2009)
Occam\'s Razor - Inflation (Sept. 2009)Occam\'s Razor - Inflation (Sept. 2009)
Occam\'s Razor - Inflation (Sept. 2009)
 
Occam\'s Razor on Inflation
Occam\'s Razor on InflationOccam\'s Razor on Inflation
Occam\'s Razor on Inflation
 
The Hourglass Effect - A Decade of Displacement
The Hourglass Effect - A Decade of DisplacementThe Hourglass Effect - A Decade of Displacement
The Hourglass Effect - A Decade of Displacement
 
American crises in 2007 hard copy
American crises in 2007 hard copyAmerican crises in 2007 hard copy
American crises in 2007 hard copy
 
Us economy goldilocks- 4th oct 2007 published in singapore times
Us economy   goldilocks- 4th oct 2007 published in singapore timesUs economy   goldilocks- 4th oct 2007 published in singapore times
Us economy goldilocks- 4th oct 2007 published in singapore times
 
Strategy in a structural break
Strategy in a structural breakStrategy in a structural break
Strategy in a structural break
 
Polymetis White Paper 200901
Polymetis White Paper 200901Polymetis White Paper 200901
Polymetis White Paper 200901
 

Macroresearch

  • 1. Adam Steinberg financial Research adam
steinberg
 Building intuition into the Macro Environment [Type
the
abstract
of
the
document
here.
The
abstract
is
typically
a
short
summary
of
the
 and understanding the earnings discrepancy contents
of
the
document.]
 July/Aug 2009 [Company
Address]
 1
  • 2. Introduction Simply put: Where will the company earnings, buying power and credit come from to support our ideas of normal in relation to index averages, asset prices and GDP? To build intuition into a look at the past two decades in the US economy, it’s natural to want to understand a) The conditions that appeared constant, abnormal, and/or correlated (uniquely or otherwise) to the period in question (roughly 1993 to present day 2009). b) The link between those conditions and the corresponding values for assets. And, importantly, eventually to ask what factors in the study would serve as determinants for the future. Plainly, would the gradations between prosperity and despair be dependent or independent of the factors that created them in the past. If credit fueled growth and prosperity for a given era, would credit be needed for the same level of prosperity in the future? If consumer spending has fueled US GDP in the post WWII era, does that mean it’s necessary in the future for the same levels of domestic prosperity? And could said spending levels be possible without generous amounts of leverage offered to the consumer? Think of it this way The growth of the U.S. economy in the last decade was fueled by consumer spending (70% of GDP)—and enabled through the credit expanding phenomenon that increasing demand for Home and Auto loans by individual households, quantitative easing, and the repeal of the Glass-Steagall act (Nov 12 ,1999) created. 2
  • 3. On the front end of the credit lifecycle was the extension of money to the consumer; the life cycle tapered off with dispersion of those loans as securities globally, and then finally through derivatives and multiple re-distributions as the money flow multiplied to exponentially. This cycle has been irrevocably altered across the socio-economic, as well as macro-economic food chain—with the consumers attitude to home buying irrevocably altered and an inevitable move to the upside in interest rates pending, the overall participation rates will be lower than average. This view is only compounded by the demand dampening occurring through decreasing wages, currency values, and employment. Most simply said, a demand slump in the desire for new homes—and the sheer lack of mortgages to make up CDOs not only serves as a dampening factor in asset prices and GDP but cool off (if not breaks) the consumer credit/spending bubble that the new American prosperity hinged itself on. As the recession/depression seeped into the real economy in 2008, spending began to reflect reality. 3
  • 4. Previous to 2008, access to personal lines of credit enabled the consumer to funnel trillions of dollars into industry via equity withdrawals. Where did that money go? To name a few: Home Depot, Starbucks, Las Vegas, Vacationing, Whole Foods, The high end goods industry boomed with names like Pottery Barn and Apple. As home equity withdrawals peaked between 04’ and 07’ So did the earnings of America’s ruling retail players. This could bring up a conversation surrounding just how good business was at doing business in this period. Pointedly, could anyone make money in this era just by virtue of showing up? 4
  • 5. Consumer favorite Starbucks’ stock price peaked in unison with the equity withdrawals. Outspending Prosperity As the amount of wealth in the economy started to peak in 05’ the national savings rate turned negative. The consumer had little discretion in discretionary spending, and obviously felt compelled by aforementioned retail good providers to go into further debt. 5
  • 6. As a result, S&P 500 companies, for example, enjoyed relatively easy profits with wasteful systems and un-necessary products. The ERA of the free lunch was in effect, literally. Google’s annual budget for employee meals was 72 million dollars for one recent year. With legions of MBAs on staff and the best resources at their disposal, it would be intuitive to think that American business would be cognizant of the effect two decades of extreme liquidity in the money supply would have on their earnings and hedge accordingly through dynamic planning i.e. forecasting an eventual pullback in spending. 6
  • 7. Alas, this wasn’t the case as legions of CEOs cited the “Macro” environment catching them off guard vis-à-vis an exotic and villainous set of rogues from Wall Street. But one look at a free chart available on the FED’s website would have signaled the era’s blatant abnormalities in the quantity of money available. Without casting an aggregate of American business as incompetent, one could wonder just what they were doing at work? 7
  • 8. The S&P 500 (above) also fell in lockstep with the peak in equity withdrawals and the extreme wealth generation of monetary policy. An earnings frenzy led the index to almost 1600, but with the liquidity and leverage available, it had to go to new highs. There weren’t enough mattresses to put the money in. If we isolate the prosperity of the last decade to the result of 1. Monetary Policy 2. Asset inflation 3. Access to credit We can see that gauging an assets’ future performance by the past’s “average” would be foolish in the sense that the conditions that enabled those assets to inflate to those data points are acting, or will be acting, in ways contradictory to growth. 8
  • 9. The reality A. Monetary policy will have to get tighter, eventually, which will constrict enterprise and credit lines. B. Asset valuations are deflating. And even if they stabilize, a “normal” year over year appreciation seems unlikely. C. Lines of credit are shrinking drastically, why would “normal” be “normal” (e.g. El Erian’s new normal). What will replace those equity withdrawals? Consumers have no credit and are less willing to spend, so how could a GDP that was 70% driven by consumer spending be a viable model? Consumer assets have no leveraging ability now. The savings rate is surging, and even the bare necessities are harder to pay for due to job losses. 9
  • 10. Analysts predicting a return to the mean on S&P earnings, are shortsightedly missing the idea that prices are a function of demand and utility. Loosely said, "normal" is a long way off. The market can continue to misjudge the future and go higher in the short term, without contradicting the state of decay the economy is in. Obviously demand for borrowing and availability of liquidity are positively linked and in order to have an environment flowing with this liquidity like the previous two decades, a restart of the global market for Loans, MBS and other debt instruments (fueled by a demand for housing) would have to occur. Banking has not started funding business and the demand for money is low, very low. While TARP recapitalized loss provisions it did nothing to motivate lending. What it did do is give large financial institutions more money to trade with. As banks continue to fail on a regional level, the global “too big to fail” banks are increasing their assets as the consolidation of money continues. 10
  • 11. While wall street priced in a robust recovery from March to Aug 09’, resulting in earnings multiples of 16 and counting, they discounted the coming CRE and prime loan defaults—and are no longer pricing any considerable risk into stocks or US economy in general. Underestimating the coming impact, overestimating the Governments effectiveness in dealing with the coming issues, and assuming a return to business as usual has lead equity prices too high and too fast. That's one problem: but Wall Street priced these stocks from an Inflation perspective, while all signs (in the shorter term) lead to a deflation or stagflation environment. As asset prices begin to reflect real earnings, top-line sales, and restricted credit conditions, where will the market find optimism and upward pressure? Does American business have any more rabbits in the hat? After the lay-offs, cost cutting, and efficiency measures, will there be demand for their products in the face of worsening macro data? The question, simply, remains: Where will the money come from? 11
  • 13. 8/2/09 5:06 PM 13 Adam Steinberg, Research 2009 Adamsteinberg1@gmail.com