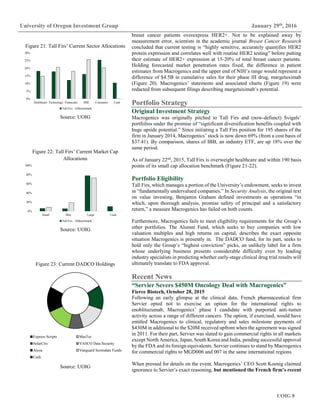
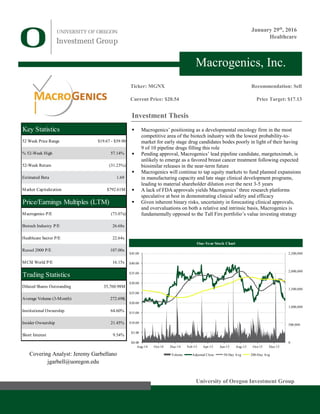
This document analyzes biopharmaceutical company Macrogenics and recommends selling its stock. Key points include:
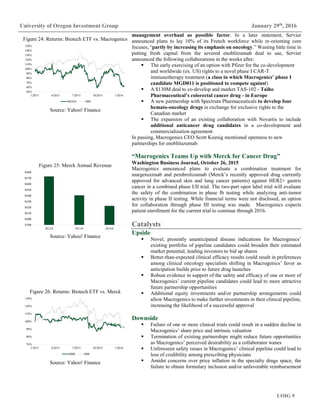
- Macrogenics focuses on developmental oncology which has low success rates and faces competition from biosimilars.
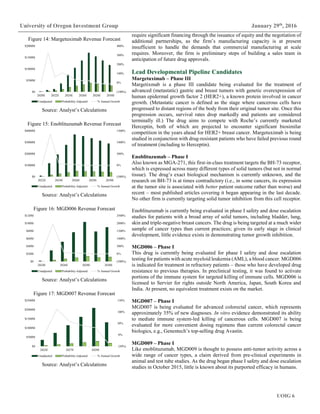
- Its lead drug margetuximab faces uncertainty due to expected biosimilar competition for breast cancer treatments.
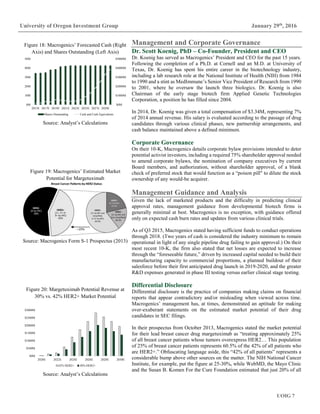
- Macrogenics will need to continue dilutive equity offerings to fund clinical programs and manufacturing expansions.
- The company's platforms are speculative without FDA approvals demonstrating safety and efficacy.
- Macrogenics is overvalued and does not align with the investor's value strategy due to binary risks and clinical uncertainty.
![UOIG 5
University of Oregon Investment Group January 29th
, 2016
Macro factors
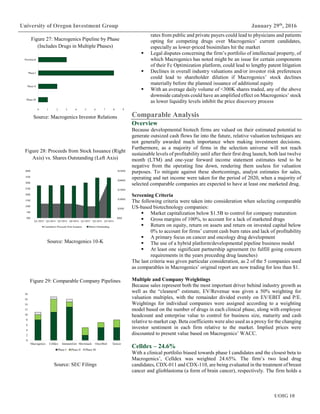
External factors influencing the biotechnology industry tend to be based in
demographics and government policy. The largest demand driver for immuno-
oncology treatments, for example, is growth in over-65s (Figure 11), the age-
cohort most likely to develop cancer. Furthermore, the Affordable Care Act has
led to a marked decrease in the uninsured, increasing the addressable market for
cancer treatments.
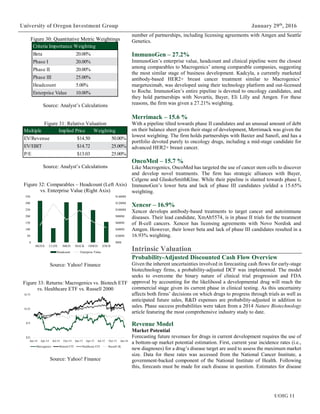
Recently, scrutiny over dramatic price increases of previously affordable generics
has led to political pressure to mitigate the rise of medical costs. One response has
been to whether to restrict government drug formularies based on drug pricing
and value-based efficacy. (Formularies refer to drugs approved for reimbursement
by insurers, government payers and pharmacy benefits managers.) Drug firms
unable to secure formulary approval risk losing physician coverage and hence,
sales to similar drugs eligible for reimbursement.
Strategic Positioning
Proprietary Technology Platform
Macrogenics’ proprietary technology platforms employ methods in protein
engineering to treat diseases by multiple theoretical mechanisms which seek to
fortify the body’s immune system and response to foreign threats. The firm keeps
an extensive library of 2,000+ purified antibodies aimed at a large number
of cell targets, allowing for the ability to simultaneously address multiple
theorized mechanisms against cancerous and other pathogenic cells. This library
is used in the drug discovery process by offering potential candidates for further
analysis.
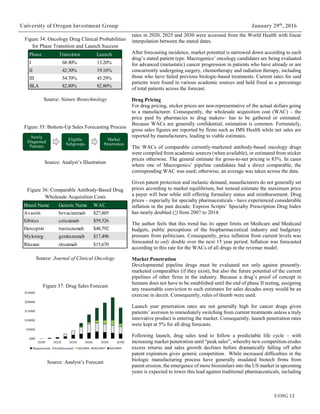
Dual Affinity Re-Targeting (DART)
The DART platform seeks to take advantage of the immune system’s natural
mechanisms towards targeting and destroying pathogens. The platform enables
antibody molecules to simultaneously bind to two targets at the cellular level with
the goal of creating “a more significant biological effect than binding [to] either
one of [them] separately.” This contrasts with most current antibody-based
treatments, which bind to a single target (“monoclonal”). Previous attempts by
researchers to create dual affinity antibodies were thwarted by manufacturing
inefficiencies.
Fc Optimization
Macrogenics’ Fc Optimization platform modifies the constant (“FC”) region of
the immune system’s existing antibodies. This modification enhances how
immune cells recognize therapeutic antibodies to better cooperate in destroying
cancerous cells.
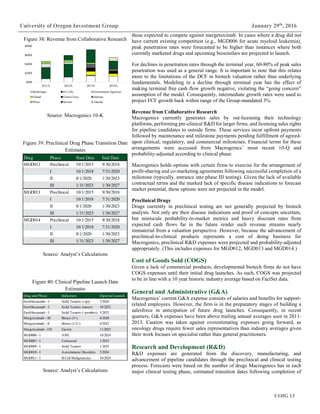
Cancer Stem-Like Cells (CSLC)
The CSLC platform is employed in discovering potential cancer cell attributes
that can be targeted using one of the above technologies. It aims to ascertain novel
cell targets not amenable to current antibody-based cancer treatments. This is
accomplished through the theorized notion that cancer stem cells serve as the basis
for tumor regrowth.
Business Growth Strategies
Overview
Macrogenics’ long-term objective is to be involved in all aspects of the drug-
making process, from discovery and development to manufacturing,
commercialization, marketing and sales. Prior to gaining drug approval, this will
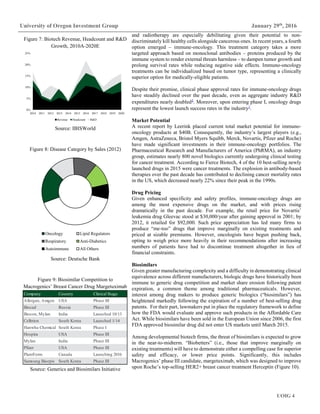
Figure 10: US Prescription Expenditure
Components, 2000-2014
Source: CMMS.gov
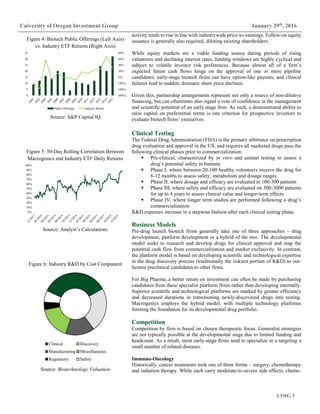
Figure 11: US Population Over-65, 2000A-2020E
Source: IBISWorld
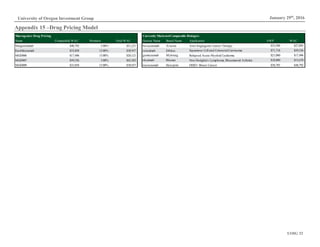
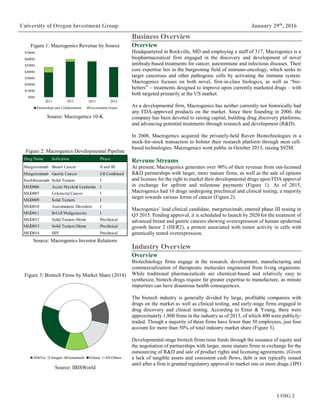
Figure 12: Macrogenics Pipeline by Platform
Source: Macrogenics Investor Relations
Figure 13: Platform Patent Expirations
Source: Macrogenics Investor Relations
$0B
$50B
$100B
$150B
$200B
$250B
$300B
2000 2002 2004 2006 2008 2010 2012 2014
Out of Pocket Private Health Insurance Medicare Medicaid
0%
1%
2%
3%
4%
5%
0
10
20
30
40
50
60
70
2000 2005 2010 2015 2020
Population Over-65 % Change
Drug Name Platform
Enoblituzumab Fc Optimization
Margetuximab Fc Optimization
MGD006 DART
MGD007 DART
MGD009 DART
MGD010 DART
MGD011 DART
MGD012 Fc Optimization
MGD013 DART
MGD014 DART
Platform Patent Expiration
CSLC 2028
DART 2026 - 2031
Fc Optimization 2024](https://image.slidesharecdn.com/mgnx-171111032653/85/Macrogenics-Equity-Research-Report-5-320.jpg)