This document summarizes Tanzania's macroeconomic performance from 2008-2011. Key points include:
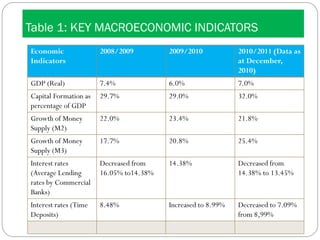
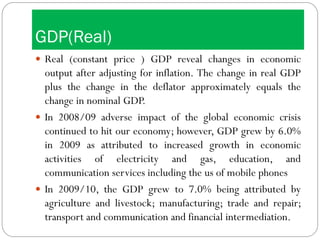
- GDP growth averaged 7.2% annually, driven by mining, financial services, transport, and manufacturing.
- Inflation remained under 10% until late 2008 when it rose to over 13% but fell back to 7% by 2010.
- Money supply and capital formation increased each year. Interest rates and exchange rates fluctuated.
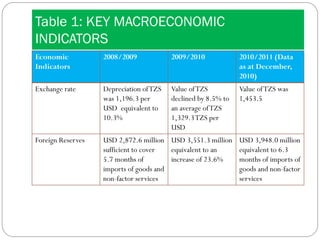
- Foreign reserves grew steadily, reaching over $3.9 billion in 2010, covering over 6 months of imports.
- Challenges implementing Tanzania's national development plan included insufficient funding and the global economic crisis.