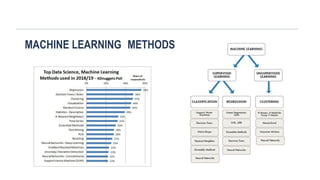
machine learning types methods classification regression decision tree
1.
Role of MachineLearning in
Telecommunication
Dr. Mohamad Abou Taam
2.
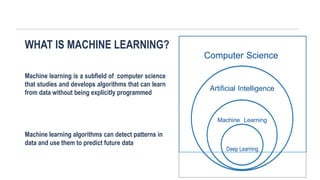
WHAT IS MACHINELEARNING?
Machine learning is a subfield of computer science
that studies and develops algorithms that can learn
from data without being explicitly programmed
Computer Science
Artificial Intelligence
Machine Learning
Deep Learning
Machine learning algorithms can detect patterns in
data and use them to predict future data
3.
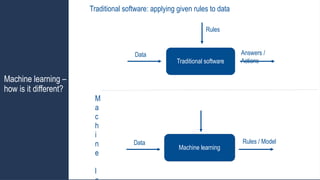
Machine learning
Data Rules/ Model
Traditional software: applying given rules to data
Traditional software
Rules
Data Answers /
Actions
Machine learning –
how is it different?
M
a
c
h
i
n
e
l
4.
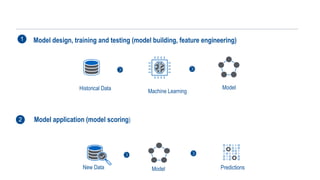
Model design, trainingand testing (model building, feature engineering)
Historical Data Machine Learning
Model
1
Model application (model scoring)
New Data Model Predictions
2
5.
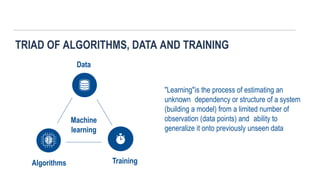
TRIAD OF ALGORITHMS,DATA AND TRAINING
Data
Machine
learning
Algorithms Training
"Learning"is the process of estimating an
unknown dependency or structure of a system
(building a model) from a limited number of
observation (data points) and ability to
generalize it onto previously unseen data
6.
Inferential Statistics
Descriptive
Statistics
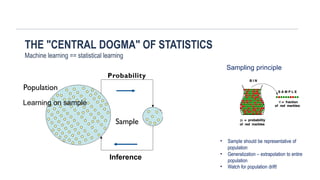
• Sampleshould be representative of
population
• Generalization – extrapolation to entire
population
• Watch for population drift!
Inference
THE "CENTRAL DOGMA" OF STATISTICS
Machine learning == statistical learning
Sampling principle
Probability
Population
Learning on sample
Sample
7.
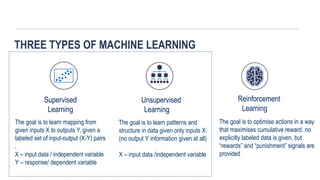
THREE TYPES OFMACHINE LEARNING
Reinforcement
Learning
The goal is to optimise actions in a way
that maximises cumulative reward. no
explicitly labeled data is given, but
“rewards” and “punishment” signals are
provided
X – input data /independent variable
Unsupervised
Learning
The goal is to learn patterns and
structure in data given only inputs X.
(no output Y information given at all)
Supervised
Learning
The goal is to learn mapping from
given inputs X to outputs Y, given a
labeled set of input-output (X-Y) pairs
.
X – input data / independent variable
Y – response/ dependent variable
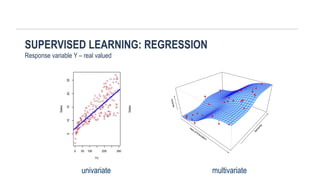
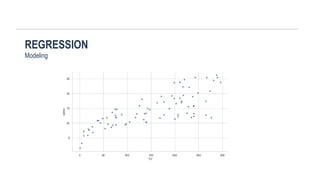
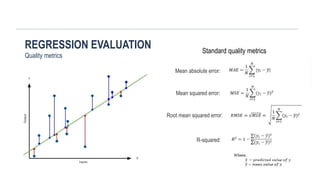
SUPERVISED LEARNING: REGRESSION
Responsevariable Y – real valued
Years of Education
S
e
n
i
o
r
i
t
y
I
n
c
o
m
e
0 50 100 200 300
5
10
15
20
25
TV
Sales
Sales
multivariate
univariate
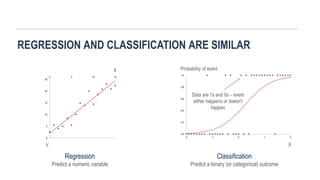
REGRESSION AND CLASSIFICATIONARE SIMILAR
Regression
Predict a numeric variable
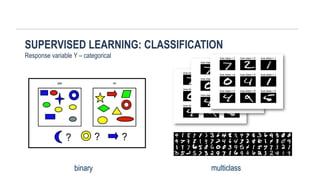
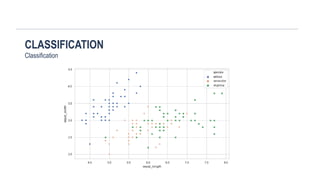
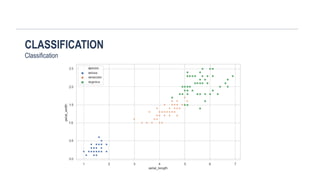
Classification
Predict a binary (or categorical) outcome
0
Y
5
10
15
20
25
X
15
5
0 10
0.0
0.2
0.4
0.6
0.8
1.0
-2 -1 0 1 2
X
Probability of event
Data are 1s and 0s – event
either happens or doesn't
happen
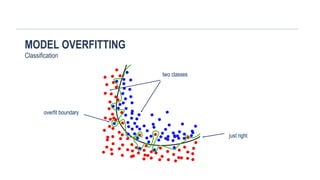
12.
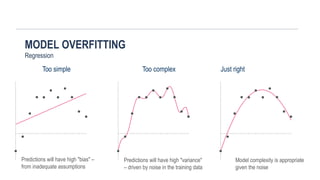
MODEL OVERFITTING
Regression
Too simpleToo complex Just right
Predictions will have high "bias" –
from inadequate assumptions
Predictions will have high "variance"
– driven by noise in the training data
Model complexity is appropriate
given the noise
14
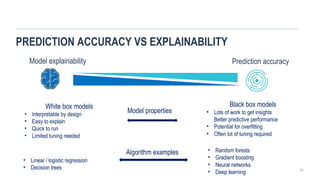
PREDICTION ACCURACY VSEXPLAINABILITY
Model explainability Prediction accuracy
White box models
• Interpretable by design
• Easy to explain
• Quick to run
• Limited tuning needed
Black box models
• Lots of work to get insights
Better predictive performance
• Potential for overfitting
• Often lot of tuning required
• Linear / logistic regression
• Decision trees
Model properties
Algorithm examples • Random forests
• Gradient boosting
• Neural networks
• Deep learning
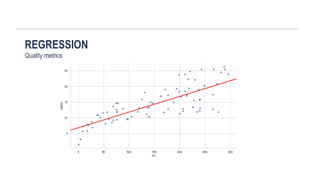
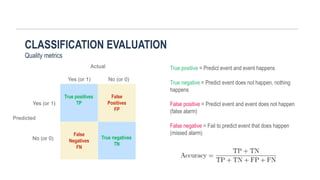
CLASSIFICATION EVALUATION
Quality metrics
Actual
Yes(or 1) No (or 0)
True positives
TP
False
Positives
FP
False
Negatives
FN
True negatives
TN
Predicted
Yes (or 1)
No (or 0)
True positive = Predict event and event happens
True negative = Predict event does not happen, nothing
happens
False positive = Predict event and event does not happen
(false alarm)
False negative = Fail to predict event that does happen
(missed alarm)
21.
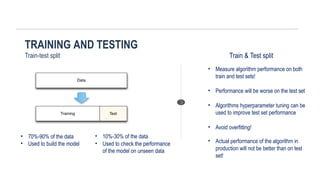
TRAINING AND TESTING
Train-testsplit
• 70%-90% of the data
• Used to build the model
• 10%-30% of the data
• Used to check the performance
of the model on unseen data
Train & Test split
• Measure algorithm performance on both
train and test sets!
• Performance will be worse on the test set
• Algorithms hyperparameter tuning can be
used to improve test set performance
• Avoid overfitting!
• Actual performance of the algorithm in
production will not be better than on test
set!
22.
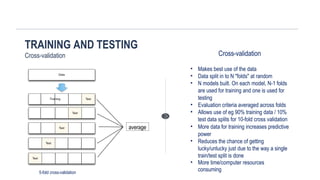
TRAINING AND TESTING
Cross-validation
•Makes best use of the data
• Data split in to N "folds" at random
• N models built. On each model, N-1 folds
are used for training and one is used for
testing
• Evaluation criteria averaged across folds
• Allows use of eg 90% training data / 10%
test data splits for 10-fold cross validation
• More data for training increases predictive
power
• Reduces the chance of getting
lucky/unlucky just due to the way a single
train/test split is done
• More time/computer resources
consuming
average
Cross-validation
5-fold cross-validation
23.
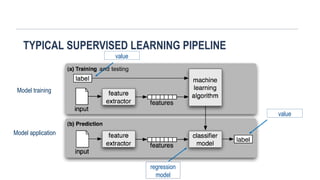
TYPICAL SUPERVISED LEARNINGPIPELINE
Model training
Model application
regression
model
value
value
and testing
24.
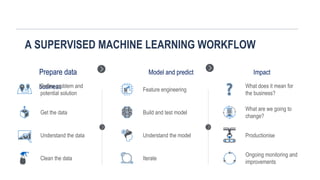
A SUPERVISED MACHINELEARNING WORKFLOW
Prepare data Model and predict Impact
business
Define problem and
potential solution
Get the data
Understand the data
Clean the data
Feature engineering
Build and test model
Understand the model
What does it mean for
the business?
What are we going to
change?
Productionise
Iterate
Ongoing monitoring and
improvements


![1_Introduction to Machine Learning [Autosaved].pptx](https://cdn.slidesharecdn.com/ss_thumbnails/1introductiontomachinelearningautosaved-250910004933-3913b711-thumbnail.jpg?width=640&height=640&fit=bounds)


