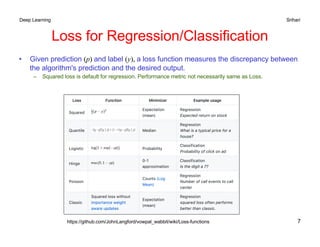
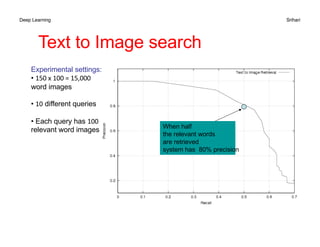
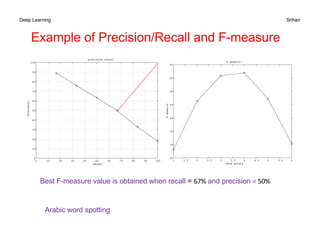
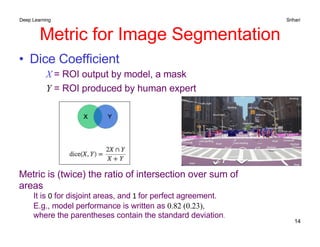
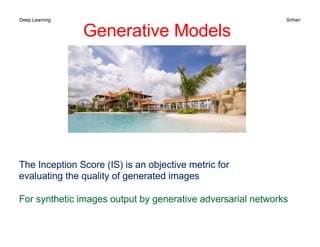
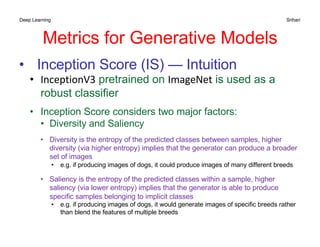
Deep Learning Srihari
1
Performance Metrics for
Machine Learning
Sargur N. Srihari
srihari@cedar.buffalo.edu
Deep Learning Srihari
Topics
1. Performance Metrics
2. Default Baseline Models
3. Determining whether to gather more data
4. Selecting hyperparamaters
5. Debugging strategies
6. Example: multi-digit number recognition
2
Deep Learning Srihari
Performance Metrics for ML Tasks
1. Regression: Squared error, RMS
2. Classification: Accuracy
– Unbalanced data: Loss, Specificity/Sensitivity
3. Density Estimation: KL divergence
4. Information Retrieval: Precision-Recall, F-Measure
5. Image Analysis and Synthesis
1. Image Segmentation: IOU, Dice
2. Generative Models: Inception Score, Frechet Inception Distance
6. Natural Language Processing
– Recognizing Textual Entailment
– Machine Translation: METEOR 3
Deep Learning Srihari
4
Metrics for Regression
• Linear Regression with feature
functions
• Sum of squares between predictions
y(xn,w) and targets in D ={(xn , tn)}, n=1,..,N
– where w has M parameters
• RMS error
– Allows comparing different size datasets
E(w) = {y(xn
,w) − tn
}2
n=1
N
∑
ERMS
= 2E(w)/N
y(x,w) = w0
+ wj
φj
(x)
j=1
M −1
∑
Deep Learning Srihari
Metrics for Classification
• Performance of model measured by
1. Accuracy
– Proportion of examples for which model
produces correct output
2. Error rate
– Proportion of examples for which model
produces incorrect output
• Error rate is referred to as expected 0-1 loss
• 0 if correctly classified and 1 if it is not 5
Deep Learning Srihari
Loss Function for Classification
• When one kind of mistake costlier
than another
– Ex: email spam detection
• Incorrectly classifying legitimate message
as spam
• Incorrectly allow spam message into in box
• Assign higher cost to one type of
error
– Ex: Cost of blocking legitimate message
is higher than allowing spam messages
6
Deep Learning Srihari
Loss for Regression/Classification
• Given prediction (p) and label (y), a loss function measures the discrepancy between
the algorithm's prediction and the desired output.
– Squared loss is default for regression. Performance metric not necessarily same as Loss.
7
https://github.com/JohnLangford/vowpal_wabbit/wiki/Loss-functions
Deep Learning Srihari
8
Metric for Density estimation
• K-L Divergence
– information required as a result
of using q(x) in place of p(x)
• Not a symmetrical quantity:
• K-L divergence satisfies KL(p||q)>0
with equality iff p(x)=q(x)
KL(p ||q) = − p(x)lnq(x)dx − p(x)ln p(x)dx
∫
( )
∫
= − p(x)ln
p(x)
q(x)
⎧
⎨
⎩
⎫
⎬
⎭
dx
∫
KL(p||q) ≠ KL(q||p)
Deep Learning Srihari
Information Retrieval: Precision and Recall
• Definitions for binary classification
Sample # Correct
Label
Classifier 1
Label
1 F F
2 F F
3 F F
4 F F
5 F T
6 T T
Correct
Label=T
Correct
Label=F
Classifier
Label=T
TP FP
Type1 error
Classifier
Label=F
FN
Type 2 error
TN
Correct
Label=T
Correct
Label=F
Classifier
Label=T
1 (TP) 1 (FP)
Classifier
Label=F
0 (FN) 4 (TN)
Accuracy =
TP +TN
TP +TN + FP + FN
Precision =
TP
TP + FP
Recall =
TP
TP + FN
F-measure ==
2
1
P
+
1
R
=
2PR
P + R
Accuracy = 5/ 6 = 83%
Precision = 1/ 2 = 50%
Recall = 1/1 = 100%
F-measure = 2/ 3 = 66%
• Compare 2 classifier outputs
Sample # Correct
Label
Classifier 2
Label
1 F F
2 F F
3 F F
4 F F
5 F F
6 T F
Accuracy = 83%
Precision = 0 / 0 = ?
Recall = 0 /1 = 0%
F-measure = ?
Correct
Label=T
Correct
Label=F
Classifier
Label=T
0 (TP) 0 (FP)
Classifier
Label=F
1 (FN) 5 (TN)
Classifier 2 is dumb: always outputs F.
Yet has same accuracy as Classifier 1
Precision and Recall are useful when the true class is rare, e.g., rare disease.
Same holds true in information retrieval when only a few of a large no. of
documents are relevant
Deep Learning Srihari
Precision-Recall in IR
Precision-Recall are evaluated
w.r.t. a set of queries
Recall
Precision
Precision-Recall Curve
Thresh method: threshold t on similarity measure
Rank Method: no of top choices presented
Typical inverse relationship
Relevant
to Q
Irrelevant
to Q
TN
TP
FP
Precision =
TP/TP+FP
Recall = TP/TP+FN
FN
Objects returned for query Q
Ideal Thresh
method
%
%
Ideal
Rank
method
Orange better than blue curve
Database
Deep Learning Srihari
Text to Image search
Experimental settings:
• 150 x 100 = 15,000
word images
• 10 different queries
• Each query has 100
relevant word images When half
the relevant words
are retrieved
system has 80% precision
Deep Learning Srihari
F =
2
1
P
+
1
R
=
2PR
P + R
Harmonic mean of precision and recall
High value when both P and R are high
uR
P
u
PR
R
u
P
u
E
+
-
-
=
-
+
-
=
)
1
(
1
1
1
1 u = measure of relative importance of P and R
Combined Precision-Recall
The coefficient u has range [0,1] and can be equivalently written as
)
1
/(
1 2
+
= v
u
R
P
v
PR
v
E
+
+
-
= 2
2
)
1
(
1
R
P
PR
R
P
v
PR
v
E
F
+
=
+
+
=
-
=
2
)
1
(
1 2
2
E-measure reduces to F-measure when precision and recall are
equally weighted, i.e. v=1 or u=0.5
Deep Learning Srihari
Example of Precision/Recall and F-measure
Best F-measure value is obtained when recall = 67% and precision = 50%
Arabic word spotting
Deep Learning Srihari
Metric for Image Segmentation
• Dice Coefficient
X = ROI output by model, a mask
Y = ROI produced by human expert
14
Metric is (twice) the ratio of intersection over sum of
areas
It is 0 for disjoint areas, and 1 for perfect agreement.
E.g., model performance is written as 0.82 (0.23),
where the parentheses contain the standard deviation.
Deep Learning Srihari
Generative Models
The Inception Score (IS) is an objective metric for
evaluating the quality of generated images
For synthetic images output by generative adversarial networks
Deep Learning Srihari
• Inception Score (IS) — Intuition
• InceptionV3 pretrained on ImageNet is used as a
robust classifier
• Inception Score considers two major factors:
• Diversity and Saliency
• Diversity is the entropy of the predicted classes between samples, higher
diversity (via higher entropy) implies that the generator can produce a broader
set of images
• e.g. if producing images of dogs, it could produce images of many different breeds
• Saliency is the entropy of the predicted classes within a sample, higher
saliency (via lower entropy) implies that the generator is able to produce
specific samples belonging to implicit classes
• e.g. if producing images of dogs, it would generate images of specific breeds rather
than blend the features of multiple breeds
Metrics for Generative Models
Inception Score (IS) — Formula
IS was the original method for measuring the quality of generated samples.
By applying an Inception-v3 network pre-trained on ImageNet to generated
samples and then comparing the conditional label distribution with the marginal
label distribution:
Inception-v3
pre-trained
on ImageNet
x ~ pg Class label y
Deep Learning Srihari
• Developed as an alternative to Inception Score, the traditional method for
measuring the quality of generated images
• Like IS, FID uses an InceptionV3 model pretrained on ImageNet, but they
sample from different layers of the network
• IS is a metric which only considers the properties of generated images,
whereas FID considers the difference between generated and real images
• In practice, FID is more resistant to noise and is sensitive to mode collapse
(artificially pruning modes produces significantly worse results)
Fréchet Inception Distance (FID)
Deep Learning Srihari
• InceptionV3 pretrained on ImageNet is already a very robust classifier, which
by extension makes it a very robust feature extractor
• Comparing the extracted features between generated images and real
images gives a better underlying idea of the differences which could not be
obtained simply by comparing the images directly, or by just examining the
generated images
• Use the 2048-dimensional activations of the final pooling layer in a pretrained
InceptionV3 network and compare the mean and covariance statistics
between generated and real images
Fréchet Inception Distance (FID) —
Intuition
Deep Learning Srihari
Fréchet Inception Distance (FID) —
Formula
Deep Learning Srihari
Recognizing Textual Entailment
Positive TE:
Text: If you help the needy, God will reward you.
Hypothesis: Giving money to a poor man has good consequences.
Negative TE:
Text: If you help the needy, God will reward you.
Hypothesis: Giving money to a poor man has no consequences
Non-TE:
Text: If you help the needy, God will reward you.
Hypothesis: Giving money to a poor man will make you a better person.
RTE-1 to RTE-5:
•Question answering (QA)
•Relation extraction
•Information retrieval
•Multi-document summarization
•RTE-6 and RTE-7:
Aims at a more natural distribution of positive and negative cases.
•Multi-document summarization
•Update summarization

Machine learning Performance Metrics.pdf

  • 1.
    Deep Learning Srihari 1 PerformanceMetrics for Machine Learning Sargur N. Srihari srihari@cedar.buffalo.edu
  • 2.
    Deep Learning Srihari Topics 1.Performance Metrics 2. Default Baseline Models 3. Determining whether to gather more data 4. Selecting hyperparamaters 5. Debugging strategies 6. Example: multi-digit number recognition 2
  • 3.
    Deep Learning Srihari PerformanceMetrics for ML Tasks 1. Regression: Squared error, RMS 2. Classification: Accuracy – Unbalanced data: Loss, Specificity/Sensitivity 3. Density Estimation: KL divergence 4. Information Retrieval: Precision-Recall, F-Measure 5. Image Analysis and Synthesis 1. Image Segmentation: IOU, Dice 2. Generative Models: Inception Score, Frechet Inception Distance 6. Natural Language Processing – Recognizing Textual Entailment – Machine Translation: METEOR 3
  • 4.
    Deep Learning Srihari 4 Metricsfor Regression • Linear Regression with feature functions • Sum of squares between predictions y(xn,w) and targets in D ={(xn , tn)}, n=1,..,N – where w has M parameters • RMS error – Allows comparing different size datasets E(w) = {y(xn ,w) − tn }2 n=1 N ∑ ERMS = 2E(w)/N y(x,w) = w0 + wj φj (x) j=1 M −1 ∑
  • 5.
    Deep Learning Srihari Metricsfor Classification • Performance of model measured by 1. Accuracy – Proportion of examples for which model produces correct output 2. Error rate – Proportion of examples for which model produces incorrect output • Error rate is referred to as expected 0-1 loss • 0 if correctly classified and 1 if it is not 5
  • 6.
    Deep Learning Srihari LossFunction for Classification • When one kind of mistake costlier than another – Ex: email spam detection • Incorrectly classifying legitimate message as spam • Incorrectly allow spam message into in box • Assign higher cost to one type of error – Ex: Cost of blocking legitimate message is higher than allowing spam messages 6
  • 7.
    Deep Learning Srihari Lossfor Regression/Classification • Given prediction (p) and label (y), a loss function measures the discrepancy between the algorithm's prediction and the desired output. – Squared loss is default for regression. Performance metric not necessarily same as Loss. 7 https://github.com/JohnLangford/vowpal_wabbit/wiki/Loss-functions
  • 8.
    Deep Learning Srihari 8 Metricfor Density estimation • K-L Divergence – information required as a result of using q(x) in place of p(x) • Not a symmetrical quantity: • K-L divergence satisfies KL(p||q)>0 with equality iff p(x)=q(x) KL(p ||q) = − p(x)lnq(x)dx − p(x)ln p(x)dx ∫ ( ) ∫ = − p(x)ln p(x) q(x) ⎧ ⎨ ⎩ ⎫ ⎬ ⎭ dx ∫ KL(p||q) ≠ KL(q||p)
  • 9.
    Deep Learning Srihari InformationRetrieval: Precision and Recall • Definitions for binary classification Sample # Correct Label Classifier 1 Label 1 F F 2 F F 3 F F 4 F F 5 F T 6 T T Correct Label=T Correct Label=F Classifier Label=T TP FP Type1 error Classifier Label=F FN Type 2 error TN Correct Label=T Correct Label=F Classifier Label=T 1 (TP) 1 (FP) Classifier Label=F 0 (FN) 4 (TN) Accuracy = TP +TN TP +TN + FP + FN Precision = TP TP + FP Recall = TP TP + FN F-measure == 2 1 P + 1 R = 2PR P + R Accuracy = 5/ 6 = 83% Precision = 1/ 2 = 50% Recall = 1/1 = 100% F-measure = 2/ 3 = 66% • Compare 2 classifier outputs Sample # Correct Label Classifier 2 Label 1 F F 2 F F 3 F F 4 F F 5 F F 6 T F Accuracy = 83% Precision = 0 / 0 = ? Recall = 0 /1 = 0% F-measure = ? Correct Label=T Correct Label=F Classifier Label=T 0 (TP) 0 (FP) Classifier Label=F 1 (FN) 5 (TN) Classifier 2 is dumb: always outputs F. Yet has same accuracy as Classifier 1 Precision and Recall are useful when the true class is rare, e.g., rare disease. Same holds true in information retrieval when only a few of a large no. of documents are relevant
  • 10.
    Deep Learning Srihari Precision-Recallin IR Precision-Recall are evaluated w.r.t. a set of queries Recall Precision Precision-Recall Curve Thresh method: threshold t on similarity measure Rank Method: no of top choices presented Typical inverse relationship Relevant to Q Irrelevant to Q TN TP FP Precision = TP/TP+FP Recall = TP/TP+FN FN Objects returned for query Q Ideal Thresh method % % Ideal Rank method Orange better than blue curve Database
  • 11.
    Deep Learning Srihari Textto Image search Experimental settings: • 150 x 100 = 15,000 word images • 10 different queries • Each query has 100 relevant word images When half the relevant words are retrieved system has 80% precision
  • 12.
    Deep Learning Srihari F= 2 1 P + 1 R = 2PR P + R Harmonic mean of precision and recall High value when both P and R are high uR P u PR R u P u E + - - = - + - = ) 1 ( 1 1 1 1 u = measure of relative importance of P and R Combined Precision-Recall The coefficient u has range [0,1] and can be equivalently written as ) 1 /( 1 2 + = v u R P v PR v E + + - = 2 2 ) 1 ( 1 R P PR R P v PR v E F + = + + = - = 2 ) 1 ( 1 2 2 E-measure reduces to F-measure when precision and recall are equally weighted, i.e. v=1 or u=0.5
  • 13.
    Deep Learning Srihari Exampleof Precision/Recall and F-measure Best F-measure value is obtained when recall = 67% and precision = 50% Arabic word spotting
  • 14.
    Deep Learning Srihari Metricfor Image Segmentation • Dice Coefficient X = ROI output by model, a mask Y = ROI produced by human expert 14 Metric is (twice) the ratio of intersection over sum of areas It is 0 for disjoint areas, and 1 for perfect agreement. E.g., model performance is written as 0.82 (0.23), where the parentheses contain the standard deviation.
  • 15.
    Deep Learning Srihari GenerativeModels The Inception Score (IS) is an objective metric for evaluating the quality of generated images For synthetic images output by generative adversarial networks
  • 16.
    Deep Learning Srihari •Inception Score (IS) — Intuition • InceptionV3 pretrained on ImageNet is used as a robust classifier • Inception Score considers two major factors: • Diversity and Saliency • Diversity is the entropy of the predicted classes between samples, higher diversity (via higher entropy) implies that the generator can produce a broader set of images • e.g. if producing images of dogs, it could produce images of many different breeds • Saliency is the entropy of the predicted classes within a sample, higher saliency (via lower entropy) implies that the generator is able to produce specific samples belonging to implicit classes • e.g. if producing images of dogs, it would generate images of specific breeds rather than blend the features of multiple breeds Metrics for Generative Models
  • 17.
    Inception Score (IS)— Formula IS was the original method for measuring the quality of generated samples. By applying an Inception-v3 network pre-trained on ImageNet to generated samples and then comparing the conditional label distribution with the marginal label distribution: Inception-v3 pre-trained on ImageNet x ~ pg Class label y
  • 18.
    Deep Learning Srihari •Developed as an alternative to Inception Score, the traditional method for measuring the quality of generated images • Like IS, FID uses an InceptionV3 model pretrained on ImageNet, but they sample from different layers of the network • IS is a metric which only considers the properties of generated images, whereas FID considers the difference between generated and real images • In practice, FID is more resistant to noise and is sensitive to mode collapse (artificially pruning modes produces significantly worse results) Fréchet Inception Distance (FID)
  • 19.
    Deep Learning Srihari •InceptionV3 pretrained on ImageNet is already a very robust classifier, which by extension makes it a very robust feature extractor • Comparing the extracted features between generated images and real images gives a better underlying idea of the differences which could not be obtained simply by comparing the images directly, or by just examining the generated images • Use the 2048-dimensional activations of the final pooling layer in a pretrained InceptionV3 network and compare the mean and covariance statistics between generated and real images Fréchet Inception Distance (FID) — Intuition
  • 20.
    Deep Learning Srihari FréchetInception Distance (FID) — Formula
  • 21.
    Deep Learning Srihari RecognizingTextual Entailment Positive TE: Text: If you help the needy, God will reward you. Hypothesis: Giving money to a poor man has good consequences. Negative TE: Text: If you help the needy, God will reward you. Hypothesis: Giving money to a poor man has no consequences Non-TE: Text: If you help the needy, God will reward you. Hypothesis: Giving money to a poor man will make you a better person. RTE-1 to RTE-5: •Question answering (QA) •Relation extraction •Information retrieval •Multi-document summarization •RTE-6 and RTE-7: Aims at a more natural distribution of positive and negative cases. •Multi-document summarization •Update summarization