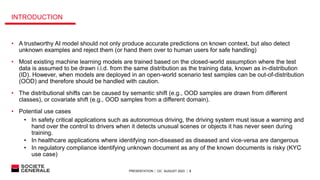
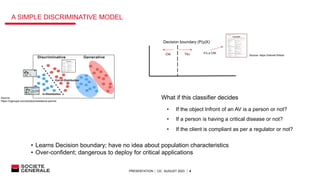
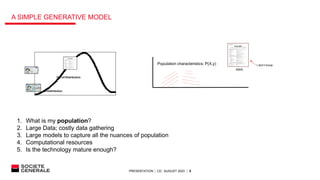
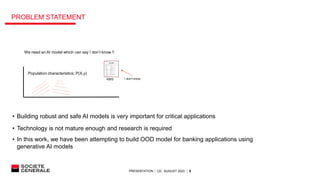
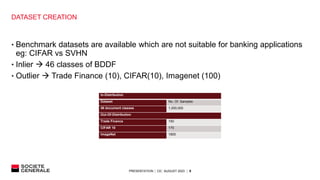
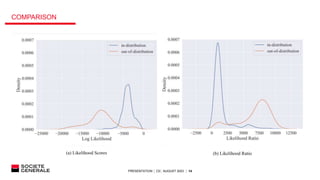
1. OUT OF THE DISTRIBUTION
DETECTION
C
0
Applied AI research
by
Data & AI Team
2. PRESENTATION │ C0│ AUGUST 2023 │ 2
INTRODUCTION
• AI models Critical applications
• AI Models Robustness and Safety
• Most of AI models Not safe; Overconfident
Source- https://researchleap.com/research-in-autonomous-driving-a-historic-
bibliometric-view-of-the-research-development-in-autonomous-driving/
Source- https://hexanika.com/ai-in-regulatory-compliance-if-you-are-not-in-then-
you-will-be-out/
Source-
https://health.economictimes.indiatimes.com/news/hospitals/th
e-importance-of-ai-for-future-ready-hospitals/97672951
3. PRESENTATION │ C0│ AUGUST 2023 │ 3
INTRODUCTION
• A trustworthy AI model should not only produce accurate predictions on known context, but also detect
unknown examples and reject them (or hand them over to human users for safe handling)
• Most existing machine learning models are trained based on the closed-world assumption where the test
data is assumed to be drawn i.i.d. from the same distribution as the training data, known as in-distribution
(ID). However, when models are deployed in an open-world scenario test samples can be out-of-distribution
(OOD) and therefore should be handled with caution.
• The distributional shifts can be caused by semantic shift (e.g., OOD samples are drawn from different
classes), or covariate shift (e.g., OOD samples from a different domain).
• Potential use cases
• In safety critical applications such as autonomous driving, the driving system must issue a warning and
hand over the control to drivers when it detects unusual scenes or objects it has never seen during
training.
• In healthcare applications where identifying non-diseased as diseased and vice-versa are dangerous
• In regulatory compliance identifying unknown document as any of the known documents is risky (KYC
use case)
4. PRESENTATION │ C0│ AUGUST 2023 │ 4
A SIMPLE DISCRIMINATIVE MODEL
Decision boundary (P(y|X)
CNI TSJ
• Learns Decision boundary; have no idea about population characteristics
• Over-confident; dangerous to deploy for critical applications
What if this classifier decides
• If the object Infront of an AV is a person or not?
• If a person is having a critical disease or not?
• If the client is compliant as per a regulator or not?
It’s a CNI
In-Distribution
Out-of-Distribution
Source- https://infonet.fr/kbis/
Source-
https://ingroupe.com/product/residence-permit/
5. PRESENTATION │ C0│ AUGUST 2023 │ 5
A SIMPLE GENERATIVE MODEL
KBIS
Population characteristics; P(X,y)
1. What is my population?
2. Large Data; costly data gathering
3. Large models to capture all the nuances of population
4. Computational resources
5. Is the technology mature enough?
I don’t know
In-Distribution
Out-of-Distribution
6. PRESENTATION │ C0│ AUGUST 2023 │ 6
PROBLEM STATEMENT
• Building robust and safe AI models is very important for critical applications
• Technology is not mature enough and research is required
• In this work, we have been attempting to build OOD model for banking applications using
generative AI models
KBIS
Population characteristics; P(X,y)
I don’t know
We need an AI model which can say I don’t know !!
7. PRESENTATION │ C0│ AUGUST 2023 │ 7
LITERATURE SURVEY
Generative Approaches
Discriminative
Approaches
OOD Approaches
VAEs
Likelihood
Ratio
GANs
SoftMax
score based
Distance
based
Energy
based
methods
Conformal
Scores
8. PRESENTATION │ C0│ AUGUST 2023 │ 8
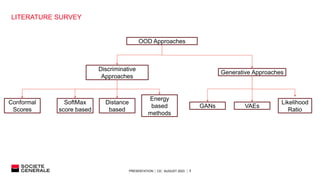
SUMMARY OF LITERATURE SURVEY
Two types of approaches: Discriminative and Generative
Classifier based approaches:
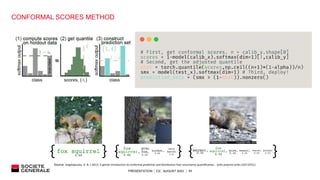
1. OOD inputs tend to have lower Soft-max scores (P(y|x)) than in-distribution data [Hendrycks & Gimpel]
2. High entropy of the predicted class distribution, and therefore a high predictive uncertainty, which suggests that the input may be
OOD.
3. The ODIN method proposed by Liang et al. (2017). ODIN uses temperature scaling (Guo et al., 2017), adds small perturbations to
the input, and applies a threshold to the resulting predicted class to distinguish in- and out-of- distribution inputs. This method is an
improvement over Hendrycks & Gimpel
4. The Mahalanobis distance of the input to the nearest class-conditional Gaussian distribution estimated from the in-distribution data.
Lee et al. (2018) fit class-conditional Gaussian distributions to the activations from the last layer of the neural network.
5. The classifier-based ensemble method that uses the average of the predictions from multiple independently trained models with
random initialization of network parameters and random shuffling of training inputs (Lakshminarayanan et al., 2017).
6. The log-odds of a binary classifier trained to distinguish between in-distribution inputs from all classes as one class and randomly
perturbed in-distribution inputs as the other.
7. The maximum class probability over K in-distribution classes of a (K +1)-class classifier where the additional class is perturbed in-
distribution.
Generative model based approaches
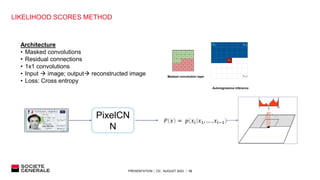
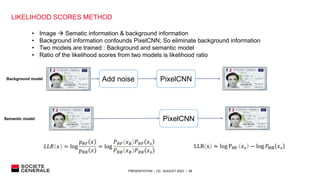
1. Auto-regressive models: PixelCNN (likelihood ratio)
2. VAE
3. GAN
9. PRESENTATION │ C0│ AUGUST 2023 │ 9
DATASET CREATION
• Benchmark datasets are available which are not suitable for banking applications
eg: CIFAR vs SVHN
• Inlier 46 classes of BDDF
• Outlier Trade Finance (10), CIFAR(10), Imagenet (100)
In-Distribution
Dataset No. Of. Samples
46 document classes 1,000,000
Out-Of-Distribution
Trade Finance 150
CIFAR 10 170
ImageNet 1800
10. PRESENTATION │ C0│ AUGUST 2023 │ 10
DISCRIMINATIVE APPROACHES
1. Softmax scores method
• 𝑠𝑜𝑓𝑡𝑚𝑎𝑥 𝑥𝑖 =
e𝑥𝑝(𝑃)
e𝑥𝑝(𝑃)
• Not true probabilities; overconfident
• Lack of uncertainty estimation
2. Temperature scaling
• 𝑠𝑜𝑓𝑡𝑚𝑎𝑥 𝑥𝑖 =
e𝑥𝑝(
𝑃𝑖
𝑇
)
e𝑥𝑝(
𝑃𝑗
𝑇
)
• T>1 softmax probabilities become smoother; T<1 softmax probabilities become sharper
3. Energy =− 𝑙𝑜𝑔(𝑃)
• Higher energy values higher uncertainty or lower confidence; lower energy values higher
confidence
• Sensitivity to small changes
• Robustness to calibration issues
4. Entropy = − 𝑃 ∗ log 𝑃
• Sensitivity to uncertainty high entropy indicates a more uncertain or ambiguous prediction
• Invariance to temperature scaling softmax scores are affected by temperature scaling whereas
entropy is invariant to temperature scaling
• Considers all classes
•
11. PRESENTATION │ C0│ AUGUST 2023 │ 11
CONFORMAL SCORES METHOD
Source- Angelopoulos, A. N. ( 2021). A gentle introduction to conformal prediction and distribution-free uncertainty quantification. . arXiv preprint arXiv:2107.07511.
13. PRESENTATION │ C0│ AUGUST 2023 │ 13
LIKELIHOOD SCORES METHOD
PixelCNN
Add noise
PixelCNN
• Image Sematic information & background information
• Background information confounds PixelCNN; So eliminate background information
• Two models are trained : Background and semantic model
• Ratio of the likelihood scores from two models is likelihood ratio
𝐿𝐿𝑅 𝑥 = log
𝑝𝜃𝐹 𝑥
𝑝𝜃𝐵 𝑥
= log
𝑃𝜃𝐹 𝑥𝐵 𝑃𝜃𝐹 𝑥𝑠
𝑃𝜃𝐵 𝑥𝐵 𝑃𝜃𝐵 𝑥𝑠
LLR x ≈ log PθF 𝑥𝑠 − log 𝑃ΘB 𝑥𝑠
Background model
Semantic model
15. PRESENTATION │ C0│ AUGUST 2023 │ 15
EXPERIMENTS & RESULTS
Approach True Positive Rate False positive Rate
Likelihood Score 98 13.75
Likelihood Ratio 98.15 35.19
Conformal Scores 97.28 37.3
Energy Scores 98 43.68
Entropy Scores 98 38.82
Softmax Scores 98 64.33
**True Positive Rate: Inliers being correctly predicted as inliers.(should be as high as possible)
False Positive Rate: Outliers being incorrectly predicted as inliers.(should be as low as possible)
FPR@TPRx is the commonly-used metric for evaluating OOD
models
16. PRESENTATION │ C0│ AUGUST 2023 │ 16
CONCLUSION
• We observe that likelihood method rather than likelihood ratio method performs better.
• This observation is in line with our hypothesis that the document images are fundamentally different from
real world images such as CIFAR and ImageNet.
• In real-world images low level or high-frequency features are irrelevant and adds noise in image
classification.
• However, for document data, high frequency features are more important and hence cancelling out these
features will deteriorate the performance of the model.
17. PRESENTATION │ C0│ AUGUST 2023 │ 17
• Exploration of other generative approaches Like VAEs, GANs
• Industrialization of the model Adding it to our document AI pipeline
FUTURE WORK
18. PRESENTATION │ C0│ AUGUST 2023 │ 18
REFERENCES
1. Angelopoulos, A. N. ( 2021). A gentle introduction to conformal prediction and distribution-free uncertainty
quantification. . arXiv preprint arXiv:2107.07511.
2. Hendrycks, D. &. ( 2016). A baseline for detecting misclassified and out-of-distribution examples in neural
networks. arXiv preprint arXiv:1610.02136.
3. Nalisnick, E. M. (2018). Do deep generative models know what they don't know? arXiv preprint arXiv:1810.09136.
4. Ren, J. L. ((2019)). Likelihood ratios for out-of-distribution detection.
5. Van den Oord, A. K. ( 2016). Conditional image generation with pixelcnn decoders. . Advances in neural information
processing systems.
Plots etc need to be present here, show plots to gradually bring people to above results, add extra slides, add support as well.Also add conclusions and observations here, e.g.. Why the likelihood scores work better, intuition behind, explain here, need to establish conclusive results here