SlideShare a Scribd company logo
1 of 10
Download to read offline
Microplastics in the Dutch portion of the Meuse River
Author: Marie Goddard a
Supervisor: Marcel van der Perk b
a
MSc Earth Sciences program, Utrecht University, PO Box 80115, 3508 TC Utrecht, The
Netherlands
b Faculty of Geosciences, Department of Physical Geography, Utrecht University, PO Box
80115, 3508 TC Utrecht, The Netherlands
_________________________________________________________________________
Abstract
To determine presence or absence of micro-plastics in the Dutch portion of the Meuse River
five surface water samples were collected. A total of 18.7 m3 of river water was collected and
filtered, in which a total of 279 specimens of plastic were identified. The majority of the
specimens were very thin multi-coloured fibres, and a minority were multi-coloured flakes and
pieces. The abundance ranged from a high of 26 count/m3
at a mid-stream location to a low
of 4 count/m3 at the furthest down-stream location, closest to the delta. The mean abundance
was 15 count/m3. The abundance of fibers and flakes decreased in the downstream direction
which is mostly likely due to entrainment and deposition. In contrast, the abundance of pieces
increased downstream, indicating that these remain suspended in the water column and will
be discharged into the delta, and possibly into the sea. It was calculated that approximately
19 billion specimens of microplastic are being discharged annually from the Meuse into the
delta using the 50 % probability discharge rate.
Introduction
The presence of plastics in the environment has been known since it was reported in 1972
(Carpenter et al. 1972), however the topic has been slow to grow in the public conscious and
only recently have there been an increasing number of studies to quantify the volume in the
world’s water bodies. Much of the work has concentrated on near shore oceanic waterbodies
for microplastics (Dubaish et al. 2013; Lattin et al., 2004; Magnusson, 2014; Sadry and
Thompson, 2014; Yonkos et al., 2014). Several summary and review papers have been written
on marine microplastics (Cole et al., 2011; Moore, 2008; Sul and Costa, 2013). Fewer studies
have researched freshwater bodies such as lakes (Erikson et al., 2013; Faure et al., 2012;
Free et al. 2015, Klein et al. 2015) and rivers (Lechner et al., 2014; Moore et al., 2011) which
should be considered as pathways for plastic migration from inland locations to the oceans.
Only one very recent paper summarizes microplastics in freshwater systems (Medrano et al.
2015).
While the effects of macroplastics have been documented for many years (Moore, 2008),
microplastics have recently come to attention as they are ingestible by invertebrates and fish
(Medrano et al., 2015; Moore, 2008) and may become sinks for hydrophobic pollutants (Moore
et al. 2008; Sul and Costa, 2013).
The term “microplastic” is not well defined in the literature with ranges between < 10 mm to <
1 mm (Cole et al., 2011) used. However, several recent papers selected, or suggested, 5 mm
as the upper limit and at, or around, 0.3 mm as the lower limit (Magnusson, 2013; Moore,
MICROPLASTICS IN THE DUTCH PORTION OF THE MEUSE RIVER Page 2
2008; Sadri and Thompson, 2014; Sul and Costa, 2014; Yonkos et al., 2014) and this was
chosen as the limits for this study.
The concentration of microplastics has not been previously reported for any of the Dutch
rivers. Both the Meuse and Rhine terminate in the Netherlands after journeying through heavily
industrialized and populated areas of neighboring countries and the Netherlands, therefore it
was anticipated that microplastics would be present in the river water.
The objective of this study was to: (a) indicate the presence or absence of microplastics; (b)
to count the abundance and composition of any microplastic specimens; and (c) determine if
there was a spatial distribution to the abundance and composition. This paper will cover the
methods and materials used to collect, filter, and process the samples. The results are
tabulated and graphed and followed by a discussion and a conclusion section.
Methods and Materials
The Meuse is a rain-fed controlled river that originates in France and passes through Belgium
before entering the Netherlands near the city of Maastricht, in the extreme south eastern
corner of the country. It flows generally northwards parallel to the German border until just
south of the city of Nijmegen where it turns westwards. It then flows for approximately 60 km
where it converges with the Rhine and Scheldt Rivers before it discharges into the North Sea.
Approximately 8.8 million people live within the Meuse basin (Rijkswaterstaat, 2009) and it
passes through the heavily industrialized areas around Maastricht and Liege.
The Meuse has an average annual discharge rate of 230 m3
/s (Rijkswaterstaat, datasheets)
as measured in the villages of Well and Grave, but can vary substantially depending upon the
season. Statistics indicate that 36 % of the time1 this flow rate has been exceeded in the
recorded flow data. For more than half the time (50 %) a flow rate of 155 m3/s has been
measured; and very rarely (10 %) has the flow rate exceeded 600 m3
/s.
The Maas is a busy shipping waterway which has been significantly altered to accommodate
and expedite traffic. Within the Netherlands it has seven control weirs (and associated locks),
several by-pass canals, and is connected to the Rhine and to three major shipping canals
(Rijkswaterstaat, 2011).
Five samples were collected spanning the length of the Dutch portion of the Meuse from the
Belgium border to the delta. Locations were chosen based upon access to the main channel
which allowed for deployment of the pump and sampling equipment into the fast flowing
portion of the river. The locations are illustrated on Figure 1 and the sample data are
summarized on Table 1. A total of 18.7 m3 of river water was collected and filtered.
1 Rijkswaterstaat data spanning 1951-2010 (59 years)
MICROPLASTICS IN THE DUTCH PORTION OF THE MEUSE RIVER Page 3
Figure 1 Figure 2
Sample Location Plan Sampling setup at location B
Rijkswaterstaat 2011
Table 1
Sample data
Sample
ID
Sample
Town
Sample Location
(description)
Sample Location
(coordinates)
Sample
Date
Sample
time
(minutes)
Sample
Volume
(m3)
A Berg aan de
Maas
East side of river
ferry crossing
51°00'22.1" N
5°46'02.6" E
27/2/2015 30 4.0
B Kessel West side of river
just north of ferry crossing
51°17'16.1" N
6°02'56.9" E
27/2/2015 31 3.4
C Broekhuizen West side of river, ferry
crossing
51°29'08.6" N
6°09'58.5" E
2/3/2015 32 4.3
D Grave South side of river,
concrete wharf
51°45'38.3" N
5°44'32.1" E
2/3/2015 24 3.2
E Ammerzoden North side of river
abandoned ferry dock
51°44'38.8" N
5°13'14.4" E
18/2/2015 35 3.8
MICROPLASTICS IN THE DUTCH PORTION OF THE MEUSE RIVER Page 4
Sampling Procedure
Water samples were collected using a high capacity submersible pump powered by a portable
gasoline generator. At each location approximately 3.5-4.0 m3 of river water was filtered
through a 280 µm mesh size filter. The filter was conical in shape and measured 12 cm wide
at the mouth and 65 cm long and is shown in Figure 2. The pump was deployed such that the
inlet was located approximately 0.5 m below the water’s surface and placed within the fast
flowing portion of the river. Prior to each sample collection, the pump rate was determined
using a metered bucket and a stop watch. This also served to rinse the pump and the hose of
any potential debris remaining from the previous sample location or acquired during transport.
After calculating the sample time, the hose was attached to the filter and the sample was
collected. The sample time at location D was shorter due to malfunctioning of the portable
generator.
The samples were collected from the bottom of the filter and transferred into glass containers
taking care to rinse off any particles stuck to the filter. The containers were closed with spill-
proof glass lids and a rubber seal. In addition, one blank sample was collected using tap water
to determine if there was any cross-contamination from the filter
The above described sampling procedure was developed by the authors as a suitable one
was not found in the reference literature. Other researchers have reported the following
methods for the collection of river, lake, and influent samples:
• a manta trawl towed by a vessel (Free et al., 2014)
• a Ruttner sampler and vacuum filtration (Magnusson et al., 2014)
• stationary conical driftnets (Lechner et al., 2013)
• a stationary manta trawl deployed with a crane (Moore et al., 2011)
• a heavily weighted rectangular net deployed from a bridge (Moore et al., 2011)
• hand nets used at the river’s edge (Moore et al., 2011)
On the sampling days the Meuse had the following average discharge at the Eijsden
monitoring station2
. The probability of this flow rate is indicated in brackets:
• 281 m3/s on February 18, 2015, (29 %)
• 756 m3/s on February 27, 2015, (6 %)
• 606 m3
/s on March 2, 2015, (10 %)
Sample processing and analysis
In the laboratory, the samples were first filtered through the same 280 µm filter material to
reduce the water volume, dried in an oven, soaked in 30 % hydrogen peroxide (H2O2) solution
to remove any organics, filtered again and lightly rinsed with distilled water, and dried again in
an oven. The samples were stored in small glass vials until they could be analysed. All the
equipment used in processing was either metal or glass to mitigate cross contamination.
2
Eijsden is located at the Belgium/Netherlands border, 50°45’06.00” N, 5°41’16.2” E
MICROPLASTICS IN THE DUTCH PORTION OF THE MEUSE RIVER Page 5
The samples were characterized and counted using an optical stereo microscope with either
50x or 60x magnification.
Results
All five samples contained plastic fibres and particles, except for the blank sample (Table 2).
No plastic fibers or particles were found in the blank. A total of 279 specimens of plastic were
identified which varied greatly in colour. The average abundance over all five samples was
14.93 count/m3. A particle was defined as any plastic that was not a fibre and was further
subdivided into flakes (flat and thin) or pieces (evenly dimensioned). These designations were
subjective names given by the authors as no standardized classification system was found in
the reference literature.
Table 2
Type of plastic particles
Sample ID No. of
Fibers
Total fibers
length
(mm)
No. of
flakes
No. of
pieces
Total
Count
Total
Abundance
(count/m3)
A 84 166 6 3 92 23.06
B 66 59.5 20 1 87 25.59
C 29 76.5 9 0 38 8.84
D 38 72 2 7 47 14.69
E 5 3 0 10 15 3.95
Blank 0 0 0 0 0 0
TOTAL 222 377 37 21 279 14.93 (mean)
The distribution of the fibers and particles was 80 % and 20 %, respectively. The abundance
of fibers and particles (flakes and pieces) is illustrated on Figure 4. The abundance of fibers
decreased in the downstream direction, with no flakes found at the most downstream location
(sample E). The abundance of particles was relatively the same at all samples except for at
sample B which was roughly three times higher than the other locations. The data also shows
that the number of flakes decreased in the downstream direction, whereas pieces increased.
The fibers outnumbered the particles, except at location E, as illustrated on Figure 4. The total
length of the fibres at each location is illustrated on Figure 5.
Figure 4 Figure 5
Abundance of fibres and particles Total length of fibre by location
0.00
5.00
10.00
15.00
20.00
25.00
30.00
A B C D E
Abundance(count/m3)
Fibre Particles Total
0
50
100
150
200
A B C D E
Totallengthoffibers
(mm)
MICROPLASTICS IN THE DUTCH PORTION OF THE MEUSE RIVER Page 6
The colour of the fibres were (in order of decreasing count): blue, black; red; green; pink; pale
yellow; orange; and purple. The most abundant colour by count was blue (115) followed by
black (47). By length, the most abundant fiber colour was also blue (165 mm) followed by
green (46 mm). The fibres were very thin such that their thickness could not be accuracy
measured using the available equipment, but were approximated to be between 5 and 10 µm.
The fibres were consistent in their thickness across all the samples. Blue coloured fibers were
most abundant in samples A and D, whereas black coloured fibers were most abundant at
locations B and C. Sample E hardly had any fibers (5 total), most of which (4) were green.
The colour of the particles were (in order of decreasing count): black; blue; pink; green; grey;
fluorescent yellow; turquoise; and yellow. The most abundant particle colour was black (18)
followed by blue (12). Particles ranged from opaque to translucent, rounded to angular, with
most of the flakes having a ragged and crumpled appearance.
The colour distribution of the particles varied between samples. For the flakes, black was the
most abundance in sample B and was almost exclusively found at this location, except for one
similar particle that was found in sample C. In sample C, blue was co-abundant with pink,
whereas green was the most abundant in sample A.
For the pieces, the colour distribution also varied between the locations. Blue was co-abundant
in samples A and D, with yellow and pink, respectively. There was only one piece found in
sample B and it was green. In sample E, grey was the most abundant colour and accounted
for all the grey pieces found in the study.
Figure 6
Colour composition of fibers and particles
One ribbon of macro-plastic was identified in the sample from location A. It was weathered,
blue and clear in colour, and approximately 20 mm long and 2 mm wide. It resembled a strip
of flexible plastic like that used for shopping bags. As it was bigger than 5 mm it was not
counted for this study.
Apart from the microplastic particles, the samples also contained non-plastic particles of shiny
angular black coal, semi-angular to angular quartz grains, rusted metal flakes, flat fish scales,
and wood-like material (assumed to be undigested organic material).
0
10
20
30
40
50
60
70
80
90
100
110
120
Count
Fiber Particle
MICROPLASTICS IN THE DUTCH PORTION OF THE MEUSE RIVER Page 7
Discussion
The location closest to the Belgium border (location A) had the highest fiber count and the
lowest particle count. Other than the high particle count at location B, for which there were 20
flakes and 1 piece, the number of particles was generally consistent. Of those 20 flakes, 17
were identified as the same black material which was somewhat fragile, and which could have
broken down into smaller flakes during processing and handling, creating a potential bias high
for particles at location B. Samples often had one colour of fiber being more abundant,
therefore it is also possible that the fibers were larger at the time of collection and were broken
during processing. On the other hand, the colour made them easy to recognize as plastic but
there is a biased low as white or colourless fibers and pieces were not identified and may have
been overlooked.
In comparison to other studies (Table 4), the concentration of microplastics in the Meuse was
found to be generally higher than those of marine waters, with the exception of the Desforges
et al. study in the NE Pacific Ocean, and the storm event in California (Lattin et al., 2004). This
is logical due to dilution. In comparison to the Danube River, the mean for the Meuse was
higher, or at the lower end of the range (4.98 particles/m3), however the maximum number of
particles was at least five times higher in the Danube (Lechner et al., 2014). The Danube has
an average discharge rate of 6444 m3/s (Lechner et al., 2014) which is 28 times the average
annual flow rate of the Meuse, which could account for the lesser mean count via dilution. In
comparison to the LA rivers, the Meuse had considerably fewer particles, and the LA rivers
were dominated by fragments and foam which indicates differential sources of plastic in
comparison to the Meuse.
Table 4
Abundance, other studies
Study Location Abundance
Freshwater
Lechner et al., 2014 Danube River Max: 141,647.7 items/1000 m3
Mean: 316.8 (± 4664.6) items/1000 m3
Moore et al., 2011 California Max: 12,932 items/m3
Mean 25-hr count on date of greatest abundance:
Coyote creek: 4999.71 items
San Gabriel river: 51,603.00 items
Los Angeles River: 1,293,972.29 items
Marine water
Desforges et al., 2014 NE Pacific Ocean Range: 8 to 9180 particles/m3
Mean: 2080 ± 2190 particles/m3
Dubaish et al. 2013 Jade Bay, North Sea, Germany Max fiber: 650/L
Mean fiber: 88 ± 82 particles/L
Max granular: 1,770/L
Mean granular: 64 ± 194 particles/L
Lattin et al., 2004 Santa Monica Bay, California Max: 18 /m3 (storm)
Range: 0.1 to 6 pieces/m3
Magnusson, 2014 Near shore, Sweden Range: 0 to 0.48 items/m3
Magnusson and Noren, 2014 Near shore, effluent plume, Sweden Range: 1.1 to 1.8 fibers/m3
Sadre and Thompson, 2014 Tamar Estuary, UK Max: 204 pieces of suspected plastic
Mean: 0.028 /m3
MICROPLASTICS IN THE DUTCH PORTION OF THE MEUSE RIVER Page 8
Other studies, such as those carried out in the Chesapeake Bay (Yonkos et al., 2014), Lake
Hovsgol (Free et al. 2014), Great Lakes (Erikson et al., 2013), and Lake Geneva (Faure et al.,
2012) reported plastic as a count per square kilometre so it was not possible to compare the
data. The results for these studies, and others, are summarized by Medrano et al. (2015).
The source of the fibers is most likely household laundry, as they are too small to be caught
by the Waste Water Treatment Plants (WWTP) (Driedger et al., 2015; Magnusson et al., 2014)
and therefore pass through the plant and are discharged into the river with the effluent. As
blue and black were the most abundant fiber colours, it is likely they originate from blue and
black coloured clothing either from domestic, commercial, or industrial laundries. No obvious
pattern could be discerned in the spatial distribution in the colour of the fibers.
The microplastic flakes and pieces have a less definite origin, but given the high level of
industrialization and usage of the river, plastic litter is the most likely one source. Although the
Netherlands and Belgium have plastic recycling programs, plastic litter is common place. This
litter can find its way into the river by either being windblown, or by overland flow. Shrubbery
along the river banks may contribute by capturing and entraining this debris which is then
subsequently released into the river during high flow conditions. Other sources are likely, but
which would require further investigation into industrial activities on and around the Maas.
The decreasing abundance of fiber and flake microplastics in the downstream direction
indicates entrainment and deposition in bottom sediments, groyne fields, weir impoundments,
and/or gravel pits. These entrained microplastics may be remobilized during high flow
conditions or during dredging operations. Meuse river dredgeate may contain microplastics
which could impact upon its use as an aggregate; further study is recommended. The
microplastic fiber abundance in sample D, located just above the Grave weir and locks,
showed an increase, contrary to the downward trend. This could be due to the retention effect
of the weir and locks.
The increase in microplastic pieces in the downstream direction may be an indication of
accumulation due to inputs or a lack of entrainment, or a combination of the two. Perhaps their
size and/shape favors suspension rather than deposition.
Conclusions
The results of this study indicates that the Meuse River has a moderate abundance of
microplastics which is dominated by fibers. The fiber and flake abundance decreased in the
downstream direction, whereas the abundance of pieces increased. The most likely
explanation for this finding is that the fibers and flakes are being entrained and deposited,
while the pieces remain suspended in the water column. Based upon the microplastics
abundance in sample E, the furthest downstream location, and using the 50 % probable
discharge rate of 155 m3/s, there is approximately 612 specimens of microplastic per second
of discharge, or 19 billion specimens of microplastic per year. Using the average annual
discharge of 230 m3/s results in 908 specimens of microplastic per second of discharge, or 28
billion specimens of microplastic per year. While these microplastics are very small in size,
these vast numbers mean that they will have an impact on the receiving environment.
MICROPLASTICS IN THE DUTCH PORTION OF THE MEUSE RIVER Page 9
Additional Information
This study was undertaken as a Guided Research project worth 7.5 European Credit Transfer
and Accumulation System (ECTS) which contributed to a Masters of Geoscience degree at
Utrecht University.
References
Carpenter, E.J., Smith, K.L., 1972. Science. Vol. 175, No. 4027 (Mar. 17, 1972), pp. 1240-
1241.
Cole, M., Lindeque, P., Halsband, C., Galloway, T.S., 2001. Microplastics as contaminants in
the marine environment: A review. Marine Pollution Bulletin. 62, 2588-2597.
Desforges, J.P.W., Galbraith, M., Dangerfield, N., Ross, P.S., 2014. Widespread distribution
of microplastics in subsurface seawater in the NE Pacific Ocean. Mar. Pollut. Bull. 79,
94–99.
Dubaish, F., Liebezeit, G., 2013. Suspended microplastics and black carbon particles in the
jade system, Southern North Sea. Water Air Soil Pollut. 224, 1352.
Eriksen, M., Mason, S., Wilson, S., Box., C., Zellers, A., Edwards, W., Farley, H., Amato., S.,
2013. Microplastic pollution in the surface waters of the Laurentian Great Lakes.
Marine Pollution Bulletin. 77, 177-182.
Faure, F., Corbaz, M., Baecher, H., de Alencastro, L., 2012. Pollution due to plastics and
microplastics in Lake Geneva and in the Mediterranean Sea. Arch. Des. Sci. 65, 157
e164.
Free, C.M., Jensen, O.P., Mason, S.A., Eriksen, M., Williamson, N.J., Boldgiv, B., 2014. High-
levels of microplastic pollution in a large, remote, mountain lake. Mar. Pollut. Bull. 85
(1), 156 e163.
Jambeck, J.R., Geyer, R., Wilcox, C., Siegler, T.R., Perryman, M., Andrady, A., Narayan, R.,
Law, K.L., 2015. Plastic waste inputs from land into the ocean. Science research
report, sciencemag.org., Vol 347, Issue 6223.
Klein, S., Worch, E., Knepper, T.P., 2015. Occurrence and Spatial Distribution of micro-
plastics in River Shore Sediments of the Rhine-Main Area in Germany. Environ. Sci.
Technol., 49 (10), pp 6070-6076.
Lattin, G.L., Moore, C.J., Zellers, A.F., Moore, S.L., Weisberg, S.B., 2004. A comparison of
neustonic plastic and zooplankton at different depths near the southern
California shore. Mar. Pollut. Bull. 49, 291 - 294.
Lechner, A., Keckeis, H., Lumesberger-Loisl F., Zens, B., Krusch, R., Tritthart, M., Glas, M.,
Schludermann, E., 2014. The Danube so colourful: A potpourri of plastic litter out
numbers fish larvae in Europe’s second largest river. Environmental Pollution. 188,
177-181.
Medrano D., Richard C. Thompson, R.C., Aldridge, D.C., 2015. Microplastics in freshwater
systems: A review of the emerging threats, identification of knowledge
gaps and prioritisation of research needs. Water Research 75, 63-82.
Magnusson, K., February 2014. Microlitter and other microscopic anthropogenic particles in
the sea area off Rauma and Turku, Finland. IVL Swedish Environmental Research
Institute.
Magnusson, K., January 24, 2013. Microscopic anthropogenic particles – methods for
monitoring and results from a survey. GES-REG conference on Marine
Litter/Underwater Noise Seminar, Tallinn, Estontia. IVL Swedish Environmental
Research Institute.
Magnusson, K., Norén, F., 2014. Screening of microplastic particles in and down-stream a
wastewater treatment plant. IVL Swedish Environmental Research Institute.
Moore, C.J., 2008. Synthetic polymers in the marine environment: a rapidly increasing, long-
term threat. Environ. Res. 108, 131 e139.
MICROPLASTICS IN THE DUTCH PORTION OF THE MEUSE RIVER Page
10
Moore, C.J., Lattin, G.L., Zellers, A.F., 2011. Quantity and type of plastic debris flowing from
two urban rivers to coastal waters and beaches of Southern California. J. Integr. Coast.
Zone Manag. 11 (1), 65 e73.
Rijkswaterstaat. December 2009. 2009-2015 River basin management plans, Ems, Meuse,
Rhine Delta and Scheldt – a summary.
Rijkswaterstaat. February 2011. Water Management in the Netherlands.
Rijkswaterstaat. March 2015. Interactive map for waterafvoer.
http://www.rijkswaterstaat.nl/geotool/geotool_afvoer_stroomsnelheid.aspx?cookieloa
d=true
Rech, S., Macaya-Caquilpán, V., Pantoja, J.F., Rivadeneira, M.M., Madariaga, D.J., Thiel,
M., 2014. Rivers as a source of marine litter – A study from the SE Pacific. Marine
Pollution Bulletin. 82, 66-75.
Sadri, S.S., Thompson, R.C., 2014. On the quantity and composition of floating plastic debris
entering and leaving the Tamar Estuary, Southwest England. Marine Pollution Bulletin.
81, 55-60.
Sul, J.A. I., Costa, M.F., 2014. The present and future of microplastic pollution in the marine
environment. Environmental Pollution. 185, 352-364.
Yonkos, L.T., Friedel, E.A., Perez-Reyes, A.C., Ghosal, S., Arthur, C.D., 2014. Microplastics
in Four Estuarine Rivers in the Chesapeake Bay, U.S.A. Environmental Science and
Technology. 48, 14195-14202.

More Related Content

What's hot

Study of the Sediments Metallic Contamination in Oum Er-Rbia Estuary
Study of the Sediments Metallic Contamination in Oum Er-Rbia EstuaryStudy of the Sediments Metallic Contamination in Oum Er-Rbia Estuary
Study of the Sediments Metallic Contamination in Oum Er-Rbia EstuaryIOSRJAC
 
Hydraulic conductivity( Darcy's law)
Hydraulic conductivity( Darcy's law)Hydraulic conductivity( Darcy's law)
Hydraulic conductivity( Darcy's law)Ravi Kant Sahu
 
Monitoring of trace metals and metalloids in natural
Monitoring of trace metals and metalloids in naturalMonitoring of trace metals and metalloids in natural
Monitoring of trace metals and metalloids in naturalShumail Sajid
 
SPE-177709 LRP_Paper
SPE-177709 LRP_PaperSPE-177709 LRP_Paper
SPE-177709 LRP_Papermid13
 
DSD-INT 2015 - The river basin explorer – Marieke Fennema, Witteveen+Bos, Cla...
DSD-INT 2015 - The river basin explorer – Marieke Fennema, Witteveen+Bos, Cla...DSD-INT 2015 - The river basin explorer – Marieke Fennema, Witteveen+Bos, Cla...
DSD-INT 2015 - The river basin explorer – Marieke Fennema, Witteveen+Bos, Cla...Deltares
 
High-precision Ultrasonic Flowmeter for Mining Applications based on Velocity...
High-precision Ultrasonic Flowmeter for Mining Applications based on Velocity...High-precision Ultrasonic Flowmeter for Mining Applications based on Velocity...
High-precision Ultrasonic Flowmeter for Mining Applications based on Velocity...TELKOMNIKA JOURNAL
 
DSD-INT 2016 Assessment of hydrologic alterations using floodplain connectivi...
DSD-INT 2016 Assessment of hydrologic alterations using floodplain connectivi...DSD-INT 2016 Assessment of hydrologic alterations using floodplain connectivi...
DSD-INT 2016 Assessment of hydrologic alterations using floodplain connectivi...Deltares
 
Water Sampling and analysis instruments
Water Sampling and analysis instruments Water Sampling and analysis instruments
Water Sampling and analysis instruments Muhammad Abdullah
 
DSD-INT 2015 - identification of mixing zones in the EU – a tiered approach -...
DSD-INT 2015 - identification of mixing zones in the EU – a tiered approach -...DSD-INT 2015 - identification of mixing zones in the EU – a tiered approach -...
DSD-INT 2015 - identification of mixing zones in the EU – a tiered approach -...Deltares
 
Advanced_Materials_Interfaces - Jolie McLane et al 2015 (Published)
Advanced_Materials_Interfaces - Jolie McLane et al 2015 (Published)Advanced_Materials_Interfaces - Jolie McLane et al 2015 (Published)
Advanced_Materials_Interfaces - Jolie McLane et al 2015 (Published)Jolie McLane
 

What's hot (13)

Study of the Sediments Metallic Contamination in Oum Er-Rbia Estuary
Study of the Sediments Metallic Contamination in Oum Er-Rbia EstuaryStudy of the Sediments Metallic Contamination in Oum Er-Rbia Estuary
Study of the Sediments Metallic Contamination in Oum Er-Rbia Estuary
 
Hydraulic conductivity( Darcy's law)
Hydraulic conductivity( Darcy's law)Hydraulic conductivity( Darcy's law)
Hydraulic conductivity( Darcy's law)
 
Monitoring of trace metals and metalloids in natural
Monitoring of trace metals and metalloids in naturalMonitoring of trace metals and metalloids in natural
Monitoring of trace metals and metalloids in natural
 
SPE-177709 LRP_Paper
SPE-177709 LRP_PaperSPE-177709 LRP_Paper
SPE-177709 LRP_Paper
 
DSD-INT 2015 - The river basin explorer – Marieke Fennema, Witteveen+Bos, Cla...
DSD-INT 2015 - The river basin explorer – Marieke Fennema, Witteveen+Bos, Cla...DSD-INT 2015 - The river basin explorer – Marieke Fennema, Witteveen+Bos, Cla...
DSD-INT 2015 - The river basin explorer – Marieke Fennema, Witteveen+Bos, Cla...
 
High-precision Ultrasonic Flowmeter for Mining Applications based on Velocity...
High-precision Ultrasonic Flowmeter for Mining Applications based on Velocity...High-precision Ultrasonic Flowmeter for Mining Applications based on Velocity...
High-precision Ultrasonic Flowmeter for Mining Applications based on Velocity...
 
Resistivity Log
Resistivity LogResistivity Log
Resistivity Log
 
SILTFLUX Data
SILTFLUX DataSILTFLUX Data
SILTFLUX Data
 
DSD-INT 2016 Assessment of hydrologic alterations using floodplain connectivi...
DSD-INT 2016 Assessment of hydrologic alterations using floodplain connectivi...DSD-INT 2016 Assessment of hydrologic alterations using floodplain connectivi...
DSD-INT 2016 Assessment of hydrologic alterations using floodplain connectivi...
 
Water Sampling and analysis instruments
Water Sampling and analysis instruments Water Sampling and analysis instruments
Water Sampling and analysis instruments
 
DSD-INT 2015 - identification of mixing zones in the EU – a tiered approach -...
DSD-INT 2015 - identification of mixing zones in the EU – a tiered approach -...DSD-INT 2015 - identification of mixing zones in the EU – a tiered approach -...
DSD-INT 2015 - identification of mixing zones in the EU – a tiered approach -...
 
Advanced_Materials_Interfaces - Jolie McLane et al 2015 (Published)
Advanced_Materials_Interfaces - Jolie McLane et al 2015 (Published)Advanced_Materials_Interfaces - Jolie McLane et al 2015 (Published)
Advanced_Materials_Interfaces - Jolie McLane et al 2015 (Published)
 
Future trends in desalination WEX2015
Future trends in desalination WEX2015Future trends in desalination WEX2015
Future trends in desalination WEX2015
 

Viewers also liked

Outlook support services
Outlook support servicesOutlook support services
Outlook support servicesVivek Kumar
 
Los tres patitos!
Los tres patitos!Los tres patitos!
Los tres patitos!JUULY92
 
Mercy Joshi - Reference Letter
Mercy Joshi - Reference LetterMercy Joshi - Reference Letter
Mercy Joshi - Reference LetterMercy Joshi
 
schrijven voor het web rws 2016
schrijven voor het web rws 2016schrijven voor het web rws 2016
schrijven voor het web rws 2016hpvl
 
System and procedure
System and procedureSystem and procedure
System and procedureTyler
 
ICT for Disaster Risk Management-Managing Disaster Information-Global Risk Id...
ICT for Disaster Risk Management-Managing Disaster Information-Global Risk Id...ICT for Disaster Risk Management-Managing Disaster Information-Global Risk Id...
ICT for Disaster Risk Management-Managing Disaster Information-Global Risk Id...Global Risk Forum GRFDavos
 

Viewers also liked (11)

Outlook support services
Outlook support servicesOutlook support services
Outlook support services
 
Internet en la nube
Internet en la nubeInternet en la nube
Internet en la nube
 
Less is More
Less is MoreLess is More
Less is More
 
Los tres patitos!
Los tres patitos!Los tres patitos!
Los tres patitos!
 
Mercy Joshi - Reference Letter
Mercy Joshi - Reference LetterMercy Joshi - Reference Letter
Mercy Joshi - Reference Letter
 
schrijven voor het web rws 2016
schrijven voor het web rws 2016schrijven voor het web rws 2016
schrijven voor het web rws 2016
 
Stem Cell en Castilla y León Económica
Stem Cell en Castilla y León EconómicaStem Cell en Castilla y León Económica
Stem Cell en Castilla y León Económica
 
Fattoria Sociale Moro
Fattoria Sociale MoroFattoria Sociale Moro
Fattoria Sociale Moro
 
презентація на тему вулиця
презентація на тему вулицяпрезентація на тему вулиця
презентація на тему вулиця
 
System and procedure
System and procedureSystem and procedure
System and procedure
 
ICT for Disaster Risk Management-Managing Disaster Information-Global Risk Id...
ICT for Disaster Risk Management-Managing Disaster Information-Global Risk Id...ICT for Disaster Risk Management-Managing Disaster Information-Global Risk Id...
ICT for Disaster Risk Management-Managing Disaster Information-Global Risk Id...
 

Similar to Maas Plastic Final for web2

DSD-INT 2019 - Plastics transport in rivers - what is below the water surface...
DSD-INT 2019 - Plastics transport in rivers - what is below the water surface...DSD-INT 2019 - Plastics transport in rivers - what is below the water surface...
DSD-INT 2019 - Plastics transport in rivers - what is below the water surface...Deltares
 
The Natural Logarithm and beach litter
The Natural Logarithm and beach litterThe Natural Logarithm and beach litter
The Natural Logarithm and beach litterRoger Erismann
 
DSD-INT 2022 Modelling the transport and resuspension of fine sediments in da...
DSD-INT 2022 Modelling the transport and resuspension of fine sediments in da...DSD-INT 2022 Modelling the transport and resuspension of fine sediments in da...
DSD-INT 2022 Modelling the transport and resuspension of fine sediments in da...Deltares
 
BrusséeT.J. - fieldwork report
BrusséeT.J. - fieldwork reportBrusséeT.J. - fieldwork report
BrusséeT.J. - fieldwork reportTimo Brussée
 
Coupling of Surface water and Groundwater Models
Coupling of Surface water and Groundwater Models Coupling of Surface water and Groundwater Models
Coupling of Surface water and Groundwater Models TIPU SULTAN BADAGAN
 
Isotope Hydrology in the Middle Mohlapitsi Catchment, South Africa
Isotope Hydrology in the Middle Mohlapitsi Catchment, South AfricaIsotope Hydrology in the Middle Mohlapitsi Catchment, South Africa
Isotope Hydrology in the Middle Mohlapitsi Catchment, South AfricaIJERD Editor
 
Crimson Publishers-Experimental Study on the Settling Velocity of Coastal Mud...
Crimson Publishers-Experimental Study on the Settling Velocity of Coastal Mud...Crimson Publishers-Experimental Study on the Settling Velocity of Coastal Mud...
Crimson Publishers-Experimental Study on the Settling Velocity of Coastal Mud...Crimsonpublishers-Oceanography
 
Final Report NRM 495 FINAL
Final Report NRM 495 FINALFinal Report NRM 495 FINAL
Final Report NRM 495 FINALJared Sartini
 
jmse-09-01258.pdf
jmse-09-01258.pdfjmse-09-01258.pdf
jmse-09-01258.pdfBlue Sea
 
High-frequency monitoring of water fluxes hess-20-347-2016
High-frequency monitoring of water fluxes hess-20-347-2016High-frequency monitoring of water fluxes hess-20-347-2016
High-frequency monitoring of water fluxes hess-20-347-2016Meidan Winegram
 
A Case Study of Residents Perspectives on the Eutrophication in the Coastal ...
A Case Study of Residents  Perspectives on the Eutrophication in the Coastal ...A Case Study of Residents  Perspectives on the Eutrophication in the Coastal ...
A Case Study of Residents Perspectives on the Eutrophication in the Coastal ...Kathryn Patel
 
Regional Scale Modelling of Solid Waste Flow in Storm Drains of Urban Cities:...
Regional Scale Modelling of Solid Waste Flow in Storm Drains of Urban Cities:...Regional Scale Modelling of Solid Waste Flow in Storm Drains of Urban Cities:...
Regional Scale Modelling of Solid Waste Flow in Storm Drains of Urban Cities:...IJERA Editor
 
MAB-IHP Regional Symposium: Managing Water Resources in Biosphere Reserves in...
MAB-IHP Regional Symposium: Managing Water Resources in Biosphere Reserves in...MAB-IHP Regional Symposium: Managing Water Resources in Biosphere Reserves in...
MAB-IHP Regional Symposium: Managing Water Resources in Biosphere Reserves in...UNESCO Venice Office
 
TAF's Biobeer presentation
TAF's Biobeer presentationTAF's Biobeer presentation
TAF's Biobeer presentationGeoMedeelel
 
Effect of zeolite types ltx and lta on physicochemical parameters of drinking...
Effect of zeolite types ltx and lta on physicochemical parameters of drinking...Effect of zeolite types ltx and lta on physicochemical parameters of drinking...
Effect of zeolite types ltx and lta on physicochemical parameters of drinking...eSAT Journals
 
Effect of zeolite types ltx and lta on physicochemical parameters of drinking...
Effect of zeolite types ltx and lta on physicochemical parameters of drinking...Effect of zeolite types ltx and lta on physicochemical parameters of drinking...
Effect of zeolite types ltx and lta on physicochemical parameters of drinking...eSAT Publishing House
 
Application of Source Water Quantity and Quality Model to Dongshan Peninsula
Application of Source Water Quantity and Quality Model to Dongshan PeninsulaApplication of Source Water Quantity and Quality Model to Dongshan Peninsula
Application of Source Water Quantity and Quality Model to Dongshan PeninsulaeWater
 

Similar to Maas Plastic Final for web2 (20)

Predictive Regression Models of Water Quality Parameters for river Amba in Na...
Predictive Regression Models of Water Quality Parameters for river Amba in Na...Predictive Regression Models of Water Quality Parameters for river Amba in Na...
Predictive Regression Models of Water Quality Parameters for river Amba in Na...
 
DSD-INT 2019 - Plastics transport in rivers - what is below the water surface...
DSD-INT 2019 - Plastics transport in rivers - what is below the water surface...DSD-INT 2019 - Plastics transport in rivers - what is below the water surface...
DSD-INT 2019 - Plastics transport in rivers - what is below the water surface...
 
The Natural Logarithm and beach litter
The Natural Logarithm and beach litterThe Natural Logarithm and beach litter
The Natural Logarithm and beach litter
 
DSD-INT 2022 Modelling the transport and resuspension of fine sediments in da...
DSD-INT 2022 Modelling the transport and resuspension of fine sediments in da...DSD-INT 2022 Modelling the transport and resuspension of fine sediments in da...
DSD-INT 2022 Modelling the transport and resuspension of fine sediments in da...
 
BrusséeT.J. - fieldwork report
BrusséeT.J. - fieldwork reportBrusséeT.J. - fieldwork report
BrusséeT.J. - fieldwork report
 
Runoff estimation and water management for Holetta River, Awash subbasin, Eth...
Runoff estimation and water management for Holetta River, Awash subbasin, Eth...Runoff estimation and water management for Holetta River, Awash subbasin, Eth...
Runoff estimation and water management for Holetta River, Awash subbasin, Eth...
 
Coupling of Surface water and Groundwater Models
Coupling of Surface water and Groundwater Models Coupling of Surface water and Groundwater Models
Coupling of Surface water and Groundwater Models
 
Isotope Hydrology in the Middle Mohlapitsi Catchment, South Africa
Isotope Hydrology in the Middle Mohlapitsi Catchment, South AfricaIsotope Hydrology in the Middle Mohlapitsi Catchment, South Africa
Isotope Hydrology in the Middle Mohlapitsi Catchment, South Africa
 
Crimson Publishers-Experimental Study on the Settling Velocity of Coastal Mud...
Crimson Publishers-Experimental Study on the Settling Velocity of Coastal Mud...Crimson Publishers-Experimental Study on the Settling Velocity of Coastal Mud...
Crimson Publishers-Experimental Study on the Settling Velocity of Coastal Mud...
 
Final Report NRM 495 FINAL
Final Report NRM 495 FINALFinal Report NRM 495 FINAL
Final Report NRM 495 FINAL
 
jmse-09-01258.pdf
jmse-09-01258.pdfjmse-09-01258.pdf
jmse-09-01258.pdf
 
High-frequency monitoring of water fluxes hess-20-347-2016
High-frequency monitoring of water fluxes hess-20-347-2016High-frequency monitoring of water fluxes hess-20-347-2016
High-frequency monitoring of water fluxes hess-20-347-2016
 
A Case Study of Residents Perspectives on the Eutrophication in the Coastal ...
A Case Study of Residents  Perspectives on the Eutrophication in the Coastal ...A Case Study of Residents  Perspectives on the Eutrophication in the Coastal ...
A Case Study of Residents Perspectives on the Eutrophication in the Coastal ...
 
Regional Scale Modelling of Solid Waste Flow in Storm Drains of Urban Cities:...
Regional Scale Modelling of Solid Waste Flow in Storm Drains of Urban Cities:...Regional Scale Modelling of Solid Waste Flow in Storm Drains of Urban Cities:...
Regional Scale Modelling of Solid Waste Flow in Storm Drains of Urban Cities:...
 
Interpolation
InterpolationInterpolation
Interpolation
 
MAB-IHP Regional Symposium: Managing Water Resources in Biosphere Reserves in...
MAB-IHP Regional Symposium: Managing Water Resources in Biosphere Reserves in...MAB-IHP Regional Symposium: Managing Water Resources in Biosphere Reserves in...
MAB-IHP Regional Symposium: Managing Water Resources in Biosphere Reserves in...
 
TAF's Biobeer presentation
TAF's Biobeer presentationTAF's Biobeer presentation
TAF's Biobeer presentation
 
Effect of zeolite types ltx and lta on physicochemical parameters of drinking...
Effect of zeolite types ltx and lta on physicochemical parameters of drinking...Effect of zeolite types ltx and lta on physicochemical parameters of drinking...
Effect of zeolite types ltx and lta on physicochemical parameters of drinking...
 
Effect of zeolite types ltx and lta on physicochemical parameters of drinking...
Effect of zeolite types ltx and lta on physicochemical parameters of drinking...Effect of zeolite types ltx and lta on physicochemical parameters of drinking...
Effect of zeolite types ltx and lta on physicochemical parameters of drinking...
 
Application of Source Water Quantity and Quality Model to Dongshan Peninsula
Application of Source Water Quantity and Quality Model to Dongshan PeninsulaApplication of Source Water Quantity and Quality Model to Dongshan Peninsula
Application of Source Water Quantity and Quality Model to Dongshan Peninsula
 

Maas Plastic Final for web2

  • 1. Microplastics in the Dutch portion of the Meuse River Author: Marie Goddard a Supervisor: Marcel van der Perk b a MSc Earth Sciences program, Utrecht University, PO Box 80115, 3508 TC Utrecht, The Netherlands b Faculty of Geosciences, Department of Physical Geography, Utrecht University, PO Box 80115, 3508 TC Utrecht, The Netherlands _________________________________________________________________________ Abstract To determine presence or absence of micro-plastics in the Dutch portion of the Meuse River five surface water samples were collected. A total of 18.7 m3 of river water was collected and filtered, in which a total of 279 specimens of plastic were identified. The majority of the specimens were very thin multi-coloured fibres, and a minority were multi-coloured flakes and pieces. The abundance ranged from a high of 26 count/m3 at a mid-stream location to a low of 4 count/m3 at the furthest down-stream location, closest to the delta. The mean abundance was 15 count/m3. The abundance of fibers and flakes decreased in the downstream direction which is mostly likely due to entrainment and deposition. In contrast, the abundance of pieces increased downstream, indicating that these remain suspended in the water column and will be discharged into the delta, and possibly into the sea. It was calculated that approximately 19 billion specimens of microplastic are being discharged annually from the Meuse into the delta using the 50 % probability discharge rate. Introduction The presence of plastics in the environment has been known since it was reported in 1972 (Carpenter et al. 1972), however the topic has been slow to grow in the public conscious and only recently have there been an increasing number of studies to quantify the volume in the world’s water bodies. Much of the work has concentrated on near shore oceanic waterbodies for microplastics (Dubaish et al. 2013; Lattin et al., 2004; Magnusson, 2014; Sadry and Thompson, 2014; Yonkos et al., 2014). Several summary and review papers have been written on marine microplastics (Cole et al., 2011; Moore, 2008; Sul and Costa, 2013). Fewer studies have researched freshwater bodies such as lakes (Erikson et al., 2013; Faure et al., 2012; Free et al. 2015, Klein et al. 2015) and rivers (Lechner et al., 2014; Moore et al., 2011) which should be considered as pathways for plastic migration from inland locations to the oceans. Only one very recent paper summarizes microplastics in freshwater systems (Medrano et al. 2015). While the effects of macroplastics have been documented for many years (Moore, 2008), microplastics have recently come to attention as they are ingestible by invertebrates and fish (Medrano et al., 2015; Moore, 2008) and may become sinks for hydrophobic pollutants (Moore et al. 2008; Sul and Costa, 2013). The term “microplastic” is not well defined in the literature with ranges between < 10 mm to < 1 mm (Cole et al., 2011) used. However, several recent papers selected, or suggested, 5 mm as the upper limit and at, or around, 0.3 mm as the lower limit (Magnusson, 2013; Moore,
  • 2. MICROPLASTICS IN THE DUTCH PORTION OF THE MEUSE RIVER Page 2 2008; Sadri and Thompson, 2014; Sul and Costa, 2014; Yonkos et al., 2014) and this was chosen as the limits for this study. The concentration of microplastics has not been previously reported for any of the Dutch rivers. Both the Meuse and Rhine terminate in the Netherlands after journeying through heavily industrialized and populated areas of neighboring countries and the Netherlands, therefore it was anticipated that microplastics would be present in the river water. The objective of this study was to: (a) indicate the presence or absence of microplastics; (b) to count the abundance and composition of any microplastic specimens; and (c) determine if there was a spatial distribution to the abundance and composition. This paper will cover the methods and materials used to collect, filter, and process the samples. The results are tabulated and graphed and followed by a discussion and a conclusion section. Methods and Materials The Meuse is a rain-fed controlled river that originates in France and passes through Belgium before entering the Netherlands near the city of Maastricht, in the extreme south eastern corner of the country. It flows generally northwards parallel to the German border until just south of the city of Nijmegen where it turns westwards. It then flows for approximately 60 km where it converges with the Rhine and Scheldt Rivers before it discharges into the North Sea. Approximately 8.8 million people live within the Meuse basin (Rijkswaterstaat, 2009) and it passes through the heavily industrialized areas around Maastricht and Liege. The Meuse has an average annual discharge rate of 230 m3 /s (Rijkswaterstaat, datasheets) as measured in the villages of Well and Grave, but can vary substantially depending upon the season. Statistics indicate that 36 % of the time1 this flow rate has been exceeded in the recorded flow data. For more than half the time (50 %) a flow rate of 155 m3/s has been measured; and very rarely (10 %) has the flow rate exceeded 600 m3 /s. The Maas is a busy shipping waterway which has been significantly altered to accommodate and expedite traffic. Within the Netherlands it has seven control weirs (and associated locks), several by-pass canals, and is connected to the Rhine and to three major shipping canals (Rijkswaterstaat, 2011). Five samples were collected spanning the length of the Dutch portion of the Meuse from the Belgium border to the delta. Locations were chosen based upon access to the main channel which allowed for deployment of the pump and sampling equipment into the fast flowing portion of the river. The locations are illustrated on Figure 1 and the sample data are summarized on Table 1. A total of 18.7 m3 of river water was collected and filtered. 1 Rijkswaterstaat data spanning 1951-2010 (59 years)
  • 3. MICROPLASTICS IN THE DUTCH PORTION OF THE MEUSE RIVER Page 3
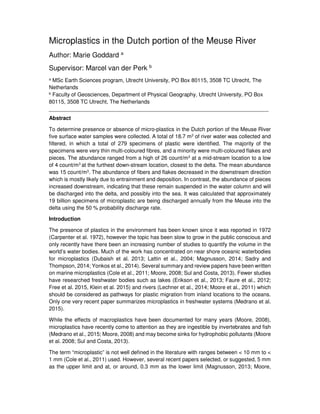
 Figure 1 Figure 2 Sample Location Plan Sampling setup at location B Rijkswaterstaat 2011 Table 1 Sample data Sample ID Sample Town Sample Location (description) Sample Location (coordinates) Sample Date Sample time (minutes) Sample Volume (m3) A Berg aan de Maas East side of river ferry crossing 51°00'22.1" N 5°46'02.6" E 27/2/2015 30 4.0 B Kessel West side of river just north of ferry crossing 51°17'16.1" N 6°02'56.9" E 27/2/2015 31 3.4 C Broekhuizen West side of river, ferry crossing 51°29'08.6" N 6°09'58.5" E 2/3/2015 32 4.3 D Grave South side of river, concrete wharf 51°45'38.3" N 5°44'32.1" E 2/3/2015 24 3.2 E Ammerzoden North side of river abandoned ferry dock 51°44'38.8" N 5°13'14.4" E 18/2/2015 35 3.8
  • 4. MICROPLASTICS IN THE DUTCH PORTION OF THE MEUSE RIVER Page 4 Sampling Procedure Water samples were collected using a high capacity submersible pump powered by a portable gasoline generator. At each location approximately 3.5-4.0 m3 of river water was filtered through a 280 µm mesh size filter. The filter was conical in shape and measured 12 cm wide at the mouth and 65 cm long and is shown in Figure 2. The pump was deployed such that the inlet was located approximately 0.5 m below the water’s surface and placed within the fast flowing portion of the river. Prior to each sample collection, the pump rate was determined using a metered bucket and a stop watch. This also served to rinse the pump and the hose of any potential debris remaining from the previous sample location or acquired during transport. After calculating the sample time, the hose was attached to the filter and the sample was collected. The sample time at location D was shorter due to malfunctioning of the portable generator. The samples were collected from the bottom of the filter and transferred into glass containers taking care to rinse off any particles stuck to the filter. The containers were closed with spill- proof glass lids and a rubber seal. In addition, one blank sample was collected using tap water to determine if there was any cross-contamination from the filter The above described sampling procedure was developed by the authors as a suitable one was not found in the reference literature. Other researchers have reported the following methods for the collection of river, lake, and influent samples: • a manta trawl towed by a vessel (Free et al., 2014) • a Ruttner sampler and vacuum filtration (Magnusson et al., 2014) • stationary conical driftnets (Lechner et al., 2013) • a stationary manta trawl deployed with a crane (Moore et al., 2011) • a heavily weighted rectangular net deployed from a bridge (Moore et al., 2011) • hand nets used at the river’s edge (Moore et al., 2011) On the sampling days the Meuse had the following average discharge at the Eijsden monitoring station2 . The probability of this flow rate is indicated in brackets: • 281 m3/s on February 18, 2015, (29 %) • 756 m3/s on February 27, 2015, (6 %) • 606 m3 /s on March 2, 2015, (10 %) Sample processing and analysis In the laboratory, the samples were first filtered through the same 280 µm filter material to reduce the water volume, dried in an oven, soaked in 30 % hydrogen peroxide (H2O2) solution to remove any organics, filtered again and lightly rinsed with distilled water, and dried again in an oven. The samples were stored in small glass vials until they could be analysed. All the equipment used in processing was either metal or glass to mitigate cross contamination. 2 Eijsden is located at the Belgium/Netherlands border, 50°45’06.00” N, 5°41’16.2” E
  • 5. MICROPLASTICS IN THE DUTCH PORTION OF THE MEUSE RIVER Page 5 The samples were characterized and counted using an optical stereo microscope with either 50x or 60x magnification. Results All five samples contained plastic fibres and particles, except for the blank sample (Table 2). No plastic fibers or particles were found in the blank. A total of 279 specimens of plastic were identified which varied greatly in colour. The average abundance over all five samples was 14.93 count/m3. A particle was defined as any plastic that was not a fibre and was further subdivided into flakes (flat and thin) or pieces (evenly dimensioned). These designations were subjective names given by the authors as no standardized classification system was found in the reference literature. Table 2 Type of plastic particles Sample ID No. of Fibers Total fibers length (mm) No. of flakes No. of pieces Total Count Total Abundance (count/m3) A 84 166 6 3 92 23.06 B 66 59.5 20 1 87 25.59 C 29 76.5 9 0 38 8.84 D 38 72 2 7 47 14.69 E 5 3 0 10 15 3.95 Blank 0 0 0 0 0 0 TOTAL 222 377 37 21 279 14.93 (mean) The distribution of the fibers and particles was 80 % and 20 %, respectively. The abundance of fibers and particles (flakes and pieces) is illustrated on Figure 4. The abundance of fibers decreased in the downstream direction, with no flakes found at the most downstream location (sample E). The abundance of particles was relatively the same at all samples except for at sample B which was roughly three times higher than the other locations. The data also shows that the number of flakes decreased in the downstream direction, whereas pieces increased. The fibers outnumbered the particles, except at location E, as illustrated on Figure 4. The total length of the fibres at each location is illustrated on Figure 5. Figure 4 Figure 5 Abundance of fibres and particles Total length of fibre by location 0.00 5.00 10.00 15.00 20.00 25.00 30.00 A B C D E Abundance(count/m3) Fibre Particles Total 0 50 100 150 200 A B C D E Totallengthoffibers (mm)
  • 6. MICROPLASTICS IN THE DUTCH PORTION OF THE MEUSE RIVER Page 6 The colour of the fibres were (in order of decreasing count): blue, black; red; green; pink; pale yellow; orange; and purple. The most abundant colour by count was blue (115) followed by black (47). By length, the most abundant fiber colour was also blue (165 mm) followed by green (46 mm). The fibres were very thin such that their thickness could not be accuracy measured using the available equipment, but were approximated to be between 5 and 10 µm. The fibres were consistent in their thickness across all the samples. Blue coloured fibers were most abundant in samples A and D, whereas black coloured fibers were most abundant at locations B and C. Sample E hardly had any fibers (5 total), most of which (4) were green. The colour of the particles were (in order of decreasing count): black; blue; pink; green; grey; fluorescent yellow; turquoise; and yellow. The most abundant particle colour was black (18) followed by blue (12). Particles ranged from opaque to translucent, rounded to angular, with most of the flakes having a ragged and crumpled appearance. The colour distribution of the particles varied between samples. For the flakes, black was the most abundance in sample B and was almost exclusively found at this location, except for one similar particle that was found in sample C. In sample C, blue was co-abundant with pink, whereas green was the most abundant in sample A. For the pieces, the colour distribution also varied between the locations. Blue was co-abundant in samples A and D, with yellow and pink, respectively. There was only one piece found in sample B and it was green. In sample E, grey was the most abundant colour and accounted for all the grey pieces found in the study. Figure 6 Colour composition of fibers and particles One ribbon of macro-plastic was identified in the sample from location A. It was weathered, blue and clear in colour, and approximately 20 mm long and 2 mm wide. It resembled a strip of flexible plastic like that used for shopping bags. As it was bigger than 5 mm it was not counted for this study. Apart from the microplastic particles, the samples also contained non-plastic particles of shiny angular black coal, semi-angular to angular quartz grains, rusted metal flakes, flat fish scales, and wood-like material (assumed to be undigested organic material). 0 10 20 30 40 50 60 70 80 90 100 110 120 Count Fiber Particle
  • 7. MICROPLASTICS IN THE DUTCH PORTION OF THE MEUSE RIVER Page 7 Discussion The location closest to the Belgium border (location A) had the highest fiber count and the lowest particle count. Other than the high particle count at location B, for which there were 20 flakes and 1 piece, the number of particles was generally consistent. Of those 20 flakes, 17 were identified as the same black material which was somewhat fragile, and which could have broken down into smaller flakes during processing and handling, creating a potential bias high for particles at location B. Samples often had one colour of fiber being more abundant, therefore it is also possible that the fibers were larger at the time of collection and were broken during processing. On the other hand, the colour made them easy to recognize as plastic but there is a biased low as white or colourless fibers and pieces were not identified and may have been overlooked. In comparison to other studies (Table 4), the concentration of microplastics in the Meuse was found to be generally higher than those of marine waters, with the exception of the Desforges et al. study in the NE Pacific Ocean, and the storm event in California (Lattin et al., 2004). This is logical due to dilution. In comparison to the Danube River, the mean for the Meuse was higher, or at the lower end of the range (4.98 particles/m3), however the maximum number of particles was at least five times higher in the Danube (Lechner et al., 2014). The Danube has an average discharge rate of 6444 m3/s (Lechner et al., 2014) which is 28 times the average annual flow rate of the Meuse, which could account for the lesser mean count via dilution. In comparison to the LA rivers, the Meuse had considerably fewer particles, and the LA rivers were dominated by fragments and foam which indicates differential sources of plastic in comparison to the Meuse. Table 4 Abundance, other studies Study Location Abundance Freshwater Lechner et al., 2014 Danube River Max: 141,647.7 items/1000 m3 Mean: 316.8 (± 4664.6) items/1000 m3 Moore et al., 2011 California Max: 12,932 items/m3 Mean 25-hr count on date of greatest abundance: Coyote creek: 4999.71 items San Gabriel river: 51,603.00 items Los Angeles River: 1,293,972.29 items Marine water Desforges et al., 2014 NE Pacific Ocean Range: 8 to 9180 particles/m3 Mean: 2080 ± 2190 particles/m3 Dubaish et al. 2013 Jade Bay, North Sea, Germany Max fiber: 650/L Mean fiber: 88 ± 82 particles/L Max granular: 1,770/L Mean granular: 64 ± 194 particles/L Lattin et al., 2004 Santa Monica Bay, California Max: 18 /m3 (storm) Range: 0.1 to 6 pieces/m3 Magnusson, 2014 Near shore, Sweden Range: 0 to 0.48 items/m3 Magnusson and Noren, 2014 Near shore, effluent plume, Sweden Range: 1.1 to 1.8 fibers/m3 Sadre and Thompson, 2014 Tamar Estuary, UK Max: 204 pieces of suspected plastic Mean: 0.028 /m3
  • 8. MICROPLASTICS IN THE DUTCH PORTION OF THE MEUSE RIVER Page 8 Other studies, such as those carried out in the Chesapeake Bay (Yonkos et al., 2014), Lake Hovsgol (Free et al. 2014), Great Lakes (Erikson et al., 2013), and Lake Geneva (Faure et al., 2012) reported plastic as a count per square kilometre so it was not possible to compare the data. The results for these studies, and others, are summarized by Medrano et al. (2015). The source of the fibers is most likely household laundry, as they are too small to be caught by the Waste Water Treatment Plants (WWTP) (Driedger et al., 2015; Magnusson et al., 2014) and therefore pass through the plant and are discharged into the river with the effluent. As blue and black were the most abundant fiber colours, it is likely they originate from blue and black coloured clothing either from domestic, commercial, or industrial laundries. No obvious pattern could be discerned in the spatial distribution in the colour of the fibers. The microplastic flakes and pieces have a less definite origin, but given the high level of industrialization and usage of the river, plastic litter is the most likely one source. Although the Netherlands and Belgium have plastic recycling programs, plastic litter is common place. This litter can find its way into the river by either being windblown, or by overland flow. Shrubbery along the river banks may contribute by capturing and entraining this debris which is then subsequently released into the river during high flow conditions. Other sources are likely, but which would require further investigation into industrial activities on and around the Maas. The decreasing abundance of fiber and flake microplastics in the downstream direction indicates entrainment and deposition in bottom sediments, groyne fields, weir impoundments, and/or gravel pits. These entrained microplastics may be remobilized during high flow conditions or during dredging operations. Meuse river dredgeate may contain microplastics which could impact upon its use as an aggregate; further study is recommended. The microplastic fiber abundance in sample D, located just above the Grave weir and locks, showed an increase, contrary to the downward trend. This could be due to the retention effect of the weir and locks. The increase in microplastic pieces in the downstream direction may be an indication of accumulation due to inputs or a lack of entrainment, or a combination of the two. Perhaps their size and/shape favors suspension rather than deposition. Conclusions The results of this study indicates that the Meuse River has a moderate abundance of microplastics which is dominated by fibers. The fiber and flake abundance decreased in the downstream direction, whereas the abundance of pieces increased. The most likely explanation for this finding is that the fibers and flakes are being entrained and deposited, while the pieces remain suspended in the water column. Based upon the microplastics abundance in sample E, the furthest downstream location, and using the 50 % probable discharge rate of 155 m3/s, there is approximately 612 specimens of microplastic per second of discharge, or 19 billion specimens of microplastic per year. Using the average annual discharge of 230 m3/s results in 908 specimens of microplastic per second of discharge, or 28 billion specimens of microplastic per year. While these microplastics are very small in size, these vast numbers mean that they will have an impact on the receiving environment.
  • 9. MICROPLASTICS IN THE DUTCH PORTION OF THE MEUSE RIVER Page 9 Additional Information This study was undertaken as a Guided Research project worth 7.5 European Credit Transfer and Accumulation System (ECTS) which contributed to a Masters of Geoscience degree at Utrecht University. References Carpenter, E.J., Smith, K.L., 1972. Science. Vol. 175, No. 4027 (Mar. 17, 1972), pp. 1240- 1241. Cole, M., Lindeque, P., Halsband, C., Galloway, T.S., 2001. Microplastics as contaminants in the marine environment: A review. Marine Pollution Bulletin. 62, 2588-2597. Desforges, J.P.W., Galbraith, M., Dangerfield, N., Ross, P.S., 2014. Widespread distribution of microplastics in subsurface seawater in the NE Pacific Ocean. Mar. Pollut. Bull. 79, 94–99. Dubaish, F., Liebezeit, G., 2013. Suspended microplastics and black carbon particles in the jade system, Southern North Sea. Water Air Soil Pollut. 224, 1352. Eriksen, M., Mason, S., Wilson, S., Box., C., Zellers, A., Edwards, W., Farley, H., Amato., S., 2013. Microplastic pollution in the surface waters of the Laurentian Great Lakes. Marine Pollution Bulletin. 77, 177-182. Faure, F., Corbaz, M., Baecher, H., de Alencastro, L., 2012. Pollution due to plastics and microplastics in Lake Geneva and in the Mediterranean Sea. Arch. Des. Sci. 65, 157 e164. Free, C.M., Jensen, O.P., Mason, S.A., Eriksen, M., Williamson, N.J., Boldgiv, B., 2014. High- levels of microplastic pollution in a large, remote, mountain lake. Mar. Pollut. Bull. 85 (1), 156 e163. Jambeck, J.R., Geyer, R., Wilcox, C., Siegler, T.R., Perryman, M., Andrady, A., Narayan, R., Law, K.L., 2015. Plastic waste inputs from land into the ocean. Science research report, sciencemag.org., Vol 347, Issue 6223. Klein, S., Worch, E., Knepper, T.P., 2015. Occurrence and Spatial Distribution of micro- plastics in River Shore Sediments of the Rhine-Main Area in Germany. Environ. Sci. Technol., 49 (10), pp 6070-6076. Lattin, G.L., Moore, C.J., Zellers, A.F., Moore, S.L., Weisberg, S.B., 2004. A comparison of neustonic plastic and zooplankton at different depths near the southern California shore. Mar. Pollut. Bull. 49, 291 - 294. Lechner, A., Keckeis, H., Lumesberger-Loisl F., Zens, B., Krusch, R., Tritthart, M., Glas, M., Schludermann, E., 2014. The Danube so colourful: A potpourri of plastic litter out numbers fish larvae in Europe’s second largest river. Environmental Pollution. 188, 177-181. Medrano D., Richard C. Thompson, R.C., Aldridge, D.C., 2015. Microplastics in freshwater systems: A review of the emerging threats, identification of knowledge gaps and prioritisation of research needs. Water Research 75, 63-82. Magnusson, K., February 2014. Microlitter and other microscopic anthropogenic particles in the sea area off Rauma and Turku, Finland. IVL Swedish Environmental Research Institute. Magnusson, K., January 24, 2013. Microscopic anthropogenic particles – methods for monitoring and results from a survey. GES-REG conference on Marine Litter/Underwater Noise Seminar, Tallinn, Estontia. IVL Swedish Environmental Research Institute. Magnusson, K., Norén, F., 2014. Screening of microplastic particles in and down-stream a wastewater treatment plant. IVL Swedish Environmental Research Institute. Moore, C.J., 2008. Synthetic polymers in the marine environment: a rapidly increasing, long- term threat. Environ. Res. 108, 131 e139.
  • 10. MICROPLASTICS IN THE DUTCH PORTION OF THE MEUSE RIVER Page 10 Moore, C.J., Lattin, G.L., Zellers, A.F., 2011. Quantity and type of plastic debris flowing from two urban rivers to coastal waters and beaches of Southern California. J. Integr. Coast. Zone Manag. 11 (1), 65 e73. Rijkswaterstaat. December 2009. 2009-2015 River basin management plans, Ems, Meuse, Rhine Delta and Scheldt – a summary. Rijkswaterstaat. February 2011. Water Management in the Netherlands. Rijkswaterstaat. March 2015. Interactive map for waterafvoer. http://www.rijkswaterstaat.nl/geotool/geotool_afvoer_stroomsnelheid.aspx?cookieloa d=true Rech, S., Macaya-Caquilpán, V., Pantoja, J.F., Rivadeneira, M.M., Madariaga, D.J., Thiel, M., 2014. Rivers as a source of marine litter – A study from the SE Pacific. Marine Pollution Bulletin. 82, 66-75. Sadri, S.S., Thompson, R.C., 2014. On the quantity and composition of floating plastic debris entering and leaving the Tamar Estuary, Southwest England. Marine Pollution Bulletin. 81, 55-60. Sul, J.A. I., Costa, M.F., 2014. The present and future of microplastic pollution in the marine environment. Environmental Pollution. 185, 352-364. Yonkos, L.T., Friedel, E.A., Perez-Reyes, A.C., Ghosal, S., Arthur, C.D., 2014. Microplastics in Four Estuarine Rivers in the Chesapeake Bay, U.S.A. Environmental Science and Technology. 48, 14195-14202.