Downloaded 1,095 times
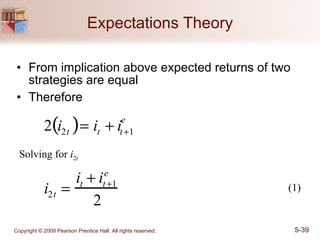
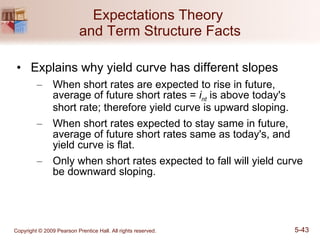
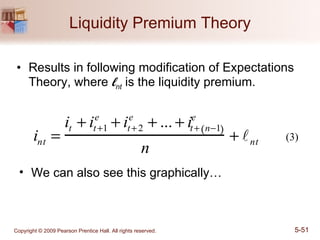
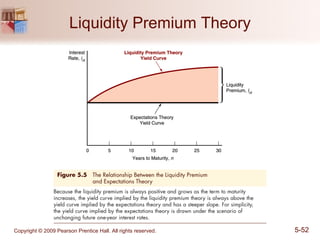
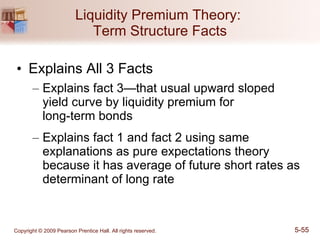
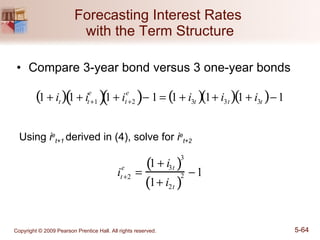
![Mini-case: The Yield Curve as a Forecasting Tool The yield curve does have information about future interest rates, and so it should also help forecast inflation and real output production. Rising (falling) rates are associated with economic booms (recessions) [chapter 4]. Rates are composed of both real rates and inflation expectations [chapter 3].](https://image.slidesharecdn.com/m06mish152006ppwc05-100622012721-phpapp01/85/Chapter-05_How-Do-Risk-and-Term-Structure-Affect-Interest-Rate-62-320.jpg)
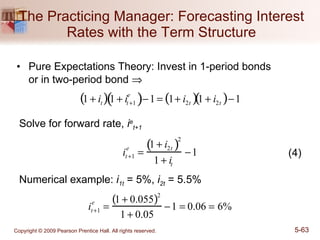
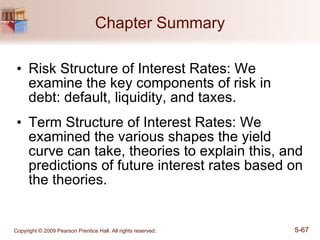

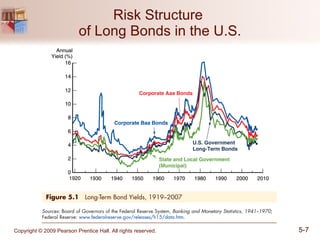
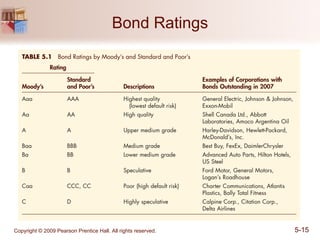
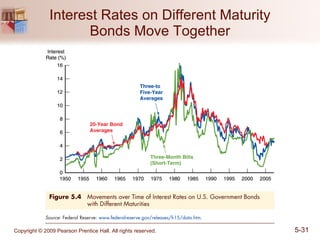
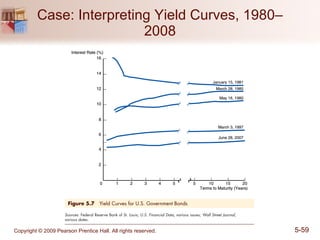
The document discusses two factors that affect interest rates: risk structure and term structure. For risk structure, it explains how default risk, liquidity, and taxes can cause different interest rates for bonds with different levels of risk. For term structure, it presents the expectations theory, which states that interest rates of different maturities should equal the average expected future short-term rates. It also discusses empirical findings about the typical upward slope of the yield curve.