SlideShare a Scribd company logo
1 of 1
Assessing the Relationship Between Random Glucose and All-Cause Mortality
Sunil E. Saith, MD, MPH, Jun S. Tang Ph.D, Shamma Al Memari, MBBS, Afra Al-Dhaheri, MBBS, Andrew Kohut, MD, MPH
Department of Internal Medicine, NYU Lutheran Medical Center, Brooklyn, NY, Dept. of Clin. Pharmacy, School of Pharmacy, UCSF, Sheikh
Khalifa Medical City, Abu Dhabi, UAE, Tawam Hospital, Al Ain, UAE, Division of Cardiology, Drexel School of Medicine, Philadelphia, PA
Introduction
 Diabetes is a risk factor for cardiovascular
disease and all-cause mortality.
 Additionally, there is evidence that elevated
blood glucose levels in non-diabetics may
increase morbidity and mortality via
increased risk of developing diabetes or
cardiovascular disease.
 However, unlike the International Diabetes
Foundation, the American Diabetes
Association has no formal protocol to
guide diagnostic management of random
blood glucose measurements.
 Our objective was to assess whether a
high-normal random glucose level confers
an increased risk of mortality, when
adjusted for other covariates.
Methods
 With permission of the Framingham Heart
Study, we conducted a retrospective cohort
analysis using a teaching dataset in 2013.
 Glucose was categorized as normal (70-99
mg/dL), high-normal (100-139 mg/dL),
moderately high (140-199 mg/dL) and
severely high (greater than 200 mg/dL).
Statistical analysis was performed using
SAS ® version 9.3.
 We examined the relationship between
time to all-cause death and random
glucose using Cox proportionate hazards
models, both unadjusted and adjusted for
age, BMI, systolic blood pressure, and
diastolic blood pressure.
Results
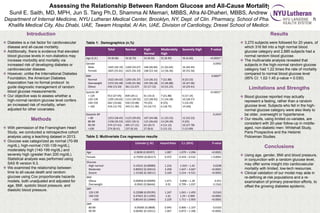
 3,270 subjects were followed for 20 years, of
which 316 fell into a high normal blood
glucose category and 2,885 subjects had a
normal random blood glucose.
 The multivariate analysis revealed that
subjects in the high-normal random glucose
category had 1.22 times the rate of mortality
compared to normal blood glucose level
(95% CI: 1.02-1.45 p-value = 0.030).
Limitations and Strengths
 Blood glucose reported may actually
represent a fasting, rather than a random
glucose level. Subjects who fell in the high-
normal glucose category were also likely to
be older, overweight or hypertensive.
 Our results, using limited co-variates, are
consistent with 20-year follow-up in middle-
aged, non-diabetic men: Whitehall Study,
Paris Prospective and the Helsinki
Policeman Studies.
Conclusions
 Using age, gender, BMI and blood pressure,
in conjunction with a random glucose level,
may offer some insight into cardiovascular
mortality with limited, low-tech resources.
 Clinical validation of our model may aide in
re-defining at-risk populations and a re-
examination of primary prevention efforts, to
offset the growing diabetes epidemic.
Total Normal High-
Normal
Moderately
High
Severely High P-value
Age (S.D.) 50 (8.68) 50 (8.70) 52 (8.50) 55 (8.90) 56 (6.60) <0.0001*
Gender
Male
Female
1445 (44.19)
1825 (55.81)
1260 (43.67)
1625 (56.33)
148 (46.84)
168 (53.16)
21 (63.64)
12 (36.36)
16 (44.44)
20 (55.56)
0.0992
BMI
Normal
Overweight
Obese
1422 (44.02)
1372 (42.48)
436 (13.50)
1293 (45.37)
1196 (41.96)
361 (12.67)
114 (36.31)
145 (46.18)
55 (17.52)
7 (21.88)
15 (46.88)
10 (31.25)
8 (23.53)
16 (47.06)
10 (29.41)
0.0007*
Systolic BP
< 120
120-139
140-159
> 160
913 (27.95)
1295 (39.65)
642 (19.66)
416 (12.74)
839 (29.1)
1151 (39.92)
550 (19.08)
343 (11.90)
61 (19.3)
123 (38.92)
79 (25)
53 (16.77)
7 (21.88)
11 (34.38)
8 (25)
6 (18.75)
6 (17.14)
10 (28.57)
5 (14.29)
14 (40)
<0.0001*
Diastolic BP
< 80
80-89
90-99
>100
1253 (38.45)
1158 (35.53)
574 (17.61)
274 (8.41)
1123 (39.05)
1021 (35.5)
495 (17.21)
237 (8.24)
107 (34.08)
115 (36.62)
65 (20.7)
27 (8.6)
11 (33.33)
13 (39.39)
4 (12.12)
5 (15.15)
12 (33.33)
9 (25)
10 (27.78)
5 (13.89)
0.2437
Table 1: Demographics (n,%)
Estimate (+ SE) Hazard Ratio C.I. (95%) P-value
Age 0.0838 (0.00397) 1.087 1.079 – 1.096 <0.0001
Female -0.75055 (0.06117) 0.472 0.419 – 0.532 < 0.0001
Glucose
High normal
Moderate
Severe
0.19531 (0.08989)
0.89922 (0.20414)
1.15182 (0.18211)
1.216
2.458
3.164
1.019 – 1.45
1.647 – 3.667
2.214 – 4.521
0.0298
<0.0001
<0.0001
BMI
Obese
Overweight
0.06858 (0.09099)
-0.0942 (0.06644)
1.071
0.91
0.896 – 1.28
0.799 – 1.037
0.451
0.1563
SBP
120-139
140-159
>160
0.22088 (0.09195)
0.47621 (0.11295)
0.80143 (0.13484)
1.247
1.61
2.229
1.041 – 1.493
1.29 – 2.009
1.711 – 2.903
0.0163
<0.0001
<0.0001
DBP
80-89
90-99
-0.05685 (0.0808)
0.06481 (0.10311)
0.945
1.067
0.806 – 1.107
0.872 – 1.306
0.0163
<0.0001
Table 2: Multivariate Cox regression results

More Related Content

What's hot

Diabetes and heart two sides of the same coin
Diabetes and heart two sides of the same coinDiabetes and heart two sides of the same coin
Diabetes and heart two sides of the same coinSunil Wadhwa
 
Dr Vivek Baliga - Chronic Disease Management In Heart Failure And Diabetes
Dr Vivek Baliga - Chronic Disease Management In Heart Failure And DiabetesDr Vivek Baliga - Chronic Disease Management In Heart Failure And Diabetes
Dr Vivek Baliga - Chronic Disease Management In Heart Failure And DiabetesDr Vivek Baliga
 
Lucy and the Iceman: Epidemiology of Ischemic Heart Disease
Lucy and the Iceman: Epidemiology of Ischemic Heart DiseaseLucy and the Iceman: Epidemiology of Ischemic Heart Disease
Lucy and the Iceman: Epidemiology of Ischemic Heart DiseaseProvidence Health Care
 
Slides on Diabetes in the South Focus on Prevention.2018
Slides on Diabetes in the South Focus on Prevention.2018Slides on Diabetes in the South Focus on Prevention.2018
Slides on Diabetes in the South Focus on Prevention.2018hivlifeinfo
 
Diabetes drugs tied to heart failure
Diabetes drugs tied to heart failureDiabetes drugs tied to heart failure
Diabetes drugs tied to heart failureOther Mother
 
Cholesterol Lowering - A Failed Strategy
Cholesterol Lowering - A Failed StrategyCholesterol Lowering - A Failed Strategy
Cholesterol Lowering - A Failed StrategyZahccc
 
The Los Angeles Veterans Trial - A Negative Dietary Trial
The Los Angeles Veterans Trial - A Negative Dietary TrialThe Los Angeles Veterans Trial - A Negative Dietary Trial
The Los Angeles Veterans Trial - A Negative Dietary TrialZahccc
 
Current trends in cardiovascular assessment
Current trends in cardiovascular assessmentCurrent trends in cardiovascular assessment
Current trends in cardiovascular assessmentAlfred Bett
 
Correlations between Some Anthropometric Parameters, the Lipid Profile and Gl...
Correlations between Some Anthropometric Parameters, the Lipid Profile and Gl...Correlations between Some Anthropometric Parameters, the Lipid Profile and Gl...
Correlations between Some Anthropometric Parameters, the Lipid Profile and Gl...inventionjournals
 
Crimson Publishers: Insulin Therapy and Cardiovascular Outcome Trials (CVOTs)...
Crimson Publishers: Insulin Therapy and Cardiovascular Outcome Trials (CVOTs)...Crimson Publishers: Insulin Therapy and Cardiovascular Outcome Trials (CVOTs)...
Crimson Publishers: Insulin Therapy and Cardiovascular Outcome Trials (CVOTs)...CrimsonGastroenterology
 
Public Health Screening: Programmes and Policy Lecture
Public Health Screening: Programmes and Policy LecturePublic Health Screening: Programmes and Policy Lecture
Public Health Screening: Programmes and Policy LectureDr Gary Kerr
 

What's hot (19)

Diabetes and heart two sides of the same coin
Diabetes and heart two sides of the same coinDiabetes and heart two sides of the same coin
Diabetes and heart two sides of the same coin
 
Dr Vivek Baliga - Chronic Disease Management In Heart Failure And Diabetes
Dr Vivek Baliga - Chronic Disease Management In Heart Failure And DiabetesDr Vivek Baliga - Chronic Disease Management In Heart Failure And Diabetes
Dr Vivek Baliga - Chronic Disease Management In Heart Failure And Diabetes
 
Project of Biostatistics
Project of Biostatistics Project of Biostatistics
Project of Biostatistics
 
Lucy and the Iceman: Epidemiology of Ischemic Heart Disease
Lucy and the Iceman: Epidemiology of Ischemic Heart DiseaseLucy and the Iceman: Epidemiology of Ischemic Heart Disease
Lucy and the Iceman: Epidemiology of Ischemic Heart Disease
 
Impact of hba1 c
Impact of hba1 cImpact of hba1 c
Impact of hba1 c
 
Slides on Diabetes in the South Focus on Prevention.2018
Slides on Diabetes in the South Focus on Prevention.2018Slides on Diabetes in the South Focus on Prevention.2018
Slides on Diabetes in the South Focus on Prevention.2018
 
Diabetes drugs tied to heart failure
Diabetes drugs tied to heart failureDiabetes drugs tied to heart failure
Diabetes drugs tied to heart failure
 
Cholesterol Lowering - A Failed Strategy
Cholesterol Lowering - A Failed StrategyCholesterol Lowering - A Failed Strategy
Cholesterol Lowering - A Failed Strategy
 
The Los Angeles Veterans Trial - A Negative Dietary Trial
The Los Angeles Veterans Trial - A Negative Dietary TrialThe Los Angeles Veterans Trial - A Negative Dietary Trial
The Los Angeles Veterans Trial - A Negative Dietary Trial
 
Current trends in cardiovascular assessment
Current trends in cardiovascular assessmentCurrent trends in cardiovascular assessment
Current trends in cardiovascular assessment
 
Correlations between Some Anthropometric Parameters, the Lipid Profile and Gl...
Correlations between Some Anthropometric Parameters, the Lipid Profile and Gl...Correlations between Some Anthropometric Parameters, the Lipid Profile and Gl...
Correlations between Some Anthropometric Parameters, the Lipid Profile and Gl...
 
Blood sugar
Blood sugarBlood sugar
Blood sugar
 
Collin 2019 oi_190136-2
Collin 2019 oi_190136-2Collin 2019 oi_190136-2
Collin 2019 oi_190136-2
 
Arterial hypertension
Arterial hypertensionArterial hypertension
Arterial hypertension
 
Moghissi
MoghissiMoghissi
Moghissi
 
Crimson Publishers: Insulin Therapy and Cardiovascular Outcome Trials (CVOTs)...
Crimson Publishers: Insulin Therapy and Cardiovascular Outcome Trials (CVOTs)...Crimson Publishers: Insulin Therapy and Cardiovascular Outcome Trials (CVOTs)...
Crimson Publishers: Insulin Therapy and Cardiovascular Outcome Trials (CVOTs)...
 
Egan2016
Egan2016Egan2016
Egan2016
 
Public Health Screening: Programmes and Policy Lecture
Public Health Screening: Programmes and Policy LecturePublic Health Screening: Programmes and Policy Lecture
Public Health Screening: Programmes and Policy Lecture
 
Hwang Catherine noon conference
Hwang Catherine noon conferenceHwang Catherine noon conference
Hwang Catherine noon conference
 

Similar to Lutheran Research Fair-- Random Glucose All-Cause Mortality [Autosaved]

Prevalence of Chronic Kidney disease in Patients with Metabolic Syndrome in S...
Prevalence of Chronic Kidney disease in Patients with Metabolic Syndrome in S...Prevalence of Chronic Kidney disease in Patients with Metabolic Syndrome in S...
Prevalence of Chronic Kidney disease in Patients with Metabolic Syndrome in S...asclepiuspdfs
 
Relationship between serum uric acid and hypertension
Relationship between serum uric acid and hypertensionRelationship between serum uric acid and hypertension
Relationship between serum uric acid and hypertensionMohammad Shakirul islam
 
07 abdominal obesity_and_association_with.1
07   abdominal obesity_and_association_with.107   abdominal obesity_and_association_with.1
07 abdominal obesity_and_association_with.1Chistian Laguado
 
07 abdominal obesity_and_association_with.1
07   abdominal obesity_and_association_with.107   abdominal obesity_and_association_with.1
07 abdominal obesity_and_association_with.1Chistian Laguado
 
كتاب المتلازمة الأيضية للدكتور موسى العنزي
كتاب المتلازمة الأيضية للدكتور موسى العنزيكتاب المتلازمة الأيضية للدكتور موسى العنزي
كتاب المتلازمة الأيضية للدكتور موسى العنزيد. موسى العنزي
 
hiperkolesterolemia pada anak
hiperkolesterolemia pada anakhiperkolesterolemia pada anak
hiperkolesterolemia pada anakAditya Prabawa
 
Dyslipidemia in stroke
Dyslipidemia in stroke  Dyslipidemia in stroke
Dyslipidemia in stroke NeurologyKota
 
microalbumunuria as cvd risk marker
microalbumunuria as cvd risk markermicroalbumunuria as cvd risk marker
microalbumunuria as cvd risk markermritunjay singh
 
Presentation1_3 - Copy.pptx
Presentation1_3 - Copy.pptxPresentation1_3 - Copy.pptx
Presentation1_3 - Copy.pptxAnupamAnand53
 
ANGINA: Treatment by Alternative Therapeutic Principal?
ANGINA: Treatment by Alternative Therapeutic Principal?ANGINA: Treatment by Alternative Therapeutic Principal?
ANGINA: Treatment by Alternative Therapeutic Principal?Dr Tarique Ahmed Maka
 
The new england journal of medicinen engl j med 373;22 .docx
The new england  journal of medicinen engl j med 373;22 .docxThe new england  journal of medicinen engl j med 373;22 .docx
The new england journal of medicinen engl j med 373;22 .docxoreo10
 
Prevalence and risk factors of fatty liver
Prevalence and risk factors of fatty liverPrevalence and risk factors of fatty liver
Prevalence and risk factors of fatty liverfarzaneh N
 

Similar to Lutheran Research Fair-- Random Glucose All-Cause Mortality [Autosaved] (20)

Prevalence of Chronic Kidney disease in Patients with Metabolic Syndrome in S...
Prevalence of Chronic Kidney disease in Patients with Metabolic Syndrome in S...Prevalence of Chronic Kidney disease in Patients with Metabolic Syndrome in S...
Prevalence of Chronic Kidney disease in Patients with Metabolic Syndrome in S...
 
Jnc 8 full
Jnc 8 fullJnc 8 full
Jnc 8 full
 
Relationship between serum uric acid and hypertension
Relationship between serum uric acid and hypertensionRelationship between serum uric acid and hypertension
Relationship between serum uric acid and hypertension
 
JCCR-02-00073
JCCR-02-00073JCCR-02-00073
JCCR-02-00073
 
07 abdominal obesity_and_association_with.1
07   abdominal obesity_and_association_with.107   abdominal obesity_and_association_with.1
07 abdominal obesity_and_association_with.1
 
07 abdominal obesity_and_association_with.1
07   abdominal obesity_and_association_with.107   abdominal obesity_and_association_with.1
07 abdominal obesity_and_association_with.1
 
كتاب المتلازمة الأيضية للدكتور موسى العنزي
كتاب المتلازمة الأيضية للدكتور موسى العنزيكتاب المتلازمة الأيضية للدكتور موسى العنزي
كتاب المتلازمة الأيضية للدكتور موسى العنزي
 
hiperkolesterolemia pada anak
hiperkolesterolemia pada anakhiperkolesterolemia pada anak
hiperkolesterolemia pada anak
 
Dyslipidemia in stroke
Dyslipidemia in stroke  Dyslipidemia in stroke
Dyslipidemia in stroke
 
microalbumunuria as cvd risk marker
microalbumunuria as cvd risk markermicroalbumunuria as cvd risk marker
microalbumunuria as cvd risk marker
 
Prediabetes Awadhesh Med
Prediabetes Awadhesh MedPrediabetes Awadhesh Med
Prediabetes Awadhesh Med
 
B0430913
B0430913B0430913
B0430913
 
Presentation1_3 - Copy.pptx
Presentation1_3 - Copy.pptxPresentation1_3 - Copy.pptx
Presentation1_3 - Copy.pptx
 
Metabolic_syndrome_among_obese_patients.pdf
Metabolic_syndrome_among_obese_patients.pdfMetabolic_syndrome_among_obese_patients.pdf
Metabolic_syndrome_among_obese_patients.pdf
 
Correlation study between total lipid profile and glycosylated hemoglobin amo...
Correlation study between total lipid profile and glycosylated hemoglobin amo...Correlation study between total lipid profile and glycosylated hemoglobin amo...
Correlation study between total lipid profile and glycosylated hemoglobin amo...
 
ANGINA: Treatment by Alternative Therapeutic Principal?
ANGINA: Treatment by Alternative Therapeutic Principal?ANGINA: Treatment by Alternative Therapeutic Principal?
ANGINA: Treatment by Alternative Therapeutic Principal?
 
The new england journal of medicinen engl j med 373;22 .docx
The new england  journal of medicinen engl j med 373;22 .docxThe new england  journal of medicinen engl j med 373;22 .docx
The new england journal of medicinen engl j med 373;22 .docx
 
Sprint 2015 nejm
Sprint 2015 nejmSprint 2015 nejm
Sprint 2015 nejm
 
Diabetes
DiabetesDiabetes
Diabetes
 
Prevalence and risk factors of fatty liver
Prevalence and risk factors of fatty liverPrevalence and risk factors of fatty liver
Prevalence and risk factors of fatty liver
 

Lutheran Research Fair-- Random Glucose All-Cause Mortality [Autosaved]

  • 1. Assessing the Relationship Between Random Glucose and All-Cause Mortality Sunil E. Saith, MD, MPH, Jun S. Tang Ph.D, Shamma Al Memari, MBBS, Afra Al-Dhaheri, MBBS, Andrew Kohut, MD, MPH Department of Internal Medicine, NYU Lutheran Medical Center, Brooklyn, NY, Dept. of Clin. Pharmacy, School of Pharmacy, UCSF, Sheikh Khalifa Medical City, Abu Dhabi, UAE, Tawam Hospital, Al Ain, UAE, Division of Cardiology, Drexel School of Medicine, Philadelphia, PA Introduction  Diabetes is a risk factor for cardiovascular disease and all-cause mortality.  Additionally, there is evidence that elevated blood glucose levels in non-diabetics may increase morbidity and mortality via increased risk of developing diabetes or cardiovascular disease.  However, unlike the International Diabetes Foundation, the American Diabetes Association has no formal protocol to guide diagnostic management of random blood glucose measurements.  Our objective was to assess whether a high-normal random glucose level confers an increased risk of mortality, when adjusted for other covariates. Methods  With permission of the Framingham Heart Study, we conducted a retrospective cohort analysis using a teaching dataset in 2013.  Glucose was categorized as normal (70-99 mg/dL), high-normal (100-139 mg/dL), moderately high (140-199 mg/dL) and severely high (greater than 200 mg/dL). Statistical analysis was performed using SAS ® version 9.3.  We examined the relationship between time to all-cause death and random glucose using Cox proportionate hazards models, both unadjusted and adjusted for age, BMI, systolic blood pressure, and diastolic blood pressure. Results  3,270 subjects were followed for 20 years, of which 316 fell into a high normal blood glucose category and 2,885 subjects had a normal random blood glucose.  The multivariate analysis revealed that subjects in the high-normal random glucose category had 1.22 times the rate of mortality compared to normal blood glucose level (95% CI: 1.02-1.45 p-value = 0.030). Limitations and Strengths  Blood glucose reported may actually represent a fasting, rather than a random glucose level. Subjects who fell in the high- normal glucose category were also likely to be older, overweight or hypertensive.  Our results, using limited co-variates, are consistent with 20-year follow-up in middle- aged, non-diabetic men: Whitehall Study, Paris Prospective and the Helsinki Policeman Studies. Conclusions  Using age, gender, BMI and blood pressure, in conjunction with a random glucose level, may offer some insight into cardiovascular mortality with limited, low-tech resources.  Clinical validation of our model may aide in re-defining at-risk populations and a re- examination of primary prevention efforts, to offset the growing diabetes epidemic. Total Normal High- Normal Moderately High Severely High P-value Age (S.D.) 50 (8.68) 50 (8.70) 52 (8.50) 55 (8.90) 56 (6.60) <0.0001* Gender Male Female 1445 (44.19) 1825 (55.81) 1260 (43.67) 1625 (56.33) 148 (46.84) 168 (53.16) 21 (63.64) 12 (36.36) 16 (44.44) 20 (55.56) 0.0992 BMI Normal Overweight Obese 1422 (44.02) 1372 (42.48) 436 (13.50) 1293 (45.37) 1196 (41.96) 361 (12.67) 114 (36.31) 145 (46.18) 55 (17.52) 7 (21.88) 15 (46.88) 10 (31.25) 8 (23.53) 16 (47.06) 10 (29.41) 0.0007* Systolic BP < 120 120-139 140-159 > 160 913 (27.95) 1295 (39.65) 642 (19.66) 416 (12.74) 839 (29.1) 1151 (39.92) 550 (19.08) 343 (11.90) 61 (19.3) 123 (38.92) 79 (25) 53 (16.77) 7 (21.88) 11 (34.38) 8 (25) 6 (18.75) 6 (17.14) 10 (28.57) 5 (14.29) 14 (40) <0.0001* Diastolic BP < 80 80-89 90-99 >100 1253 (38.45) 1158 (35.53) 574 (17.61) 274 (8.41) 1123 (39.05) 1021 (35.5) 495 (17.21) 237 (8.24) 107 (34.08) 115 (36.62) 65 (20.7) 27 (8.6) 11 (33.33) 13 (39.39) 4 (12.12) 5 (15.15) 12 (33.33) 9 (25) 10 (27.78) 5 (13.89) 0.2437 Table 1: Demographics (n,%) Estimate (+ SE) Hazard Ratio C.I. (95%) P-value Age 0.0838 (0.00397) 1.087 1.079 – 1.096 <0.0001 Female -0.75055 (0.06117) 0.472 0.419 – 0.532 < 0.0001 Glucose High normal Moderate Severe 0.19531 (0.08989) 0.89922 (0.20414) 1.15182 (0.18211) 1.216 2.458 3.164 1.019 – 1.45 1.647 – 3.667 2.214 – 4.521 0.0298 <0.0001 <0.0001 BMI Obese Overweight 0.06858 (0.09099) -0.0942 (0.06644) 1.071 0.91 0.896 – 1.28 0.799 – 1.037 0.451 0.1563 SBP 120-139 140-159 >160 0.22088 (0.09195) 0.47621 (0.11295) 0.80143 (0.13484) 1.247 1.61 2.229 1.041 – 1.493 1.29 – 2.009 1.711 – 2.903 0.0163 <0.0001 <0.0001 DBP 80-89 90-99 -0.05685 (0.0808) 0.06481 (0.10311) 0.945 1.067 0.806 – 1.107 0.872 – 1.306 0.0163 <0.0001 Table 2: Multivariate Cox regression results