SlideShare a Scribd company logo
0
Mathematics Comprehension Strategies
Literacy in Secondary Schools
Jodin Morey
April 18, 2015
1
Table of Contents
An Educational Philosophy…………………………………………….…………….………... 3
What is Literacy? A Personal Perspective...………………..………………………….………. 4
The Value of Cultural Responsive Teaching to Teach Urban Learners……………………… 5
Strategies:
Connection Stems……………………………………………………………….………... 6
Pre-reading Plan (PreP) ………………………………………………………….………. 7
Juxtaposition Texts……………………………………………………………….………. 8
Write and Sketch in Math and Science………………………………………………...... 9
Be a Math or Science Author………………………………………………….………..... 10
Anticipation/Reaction Guide………………………………………………….………….. 11
Semantic Map……………………………………………………….……………………. 12
Question-Answer Relationships……………………………………………………..…... 13
I Wonder…………………………………………………………….…………………..... 14
Paired Questioning……………………………………………………….…………..…... 15
Bookmark Technique…………………………………………………….………….…… 16
Questions into Paragraphs (QuIP) …………………………………………….…….…… 17
Venn Diagram………………………………………………………………….…….…... 18
Semantic Question Map………….…………….…………….…………….……….…..... 19
Concept of Definition Map ………….…………….…………….……………………..... 20
Semantic Feature Analysis Chart………….…………….…………….…………….….....21
I.N.S.E.R.T………….…………….…………….……….………………….……….….....22
List-Group-Label………….…………….…………….……………....…………….…..... 23
Think-Aloud………….…………….…………….……….………………….……….…...24
Content Area Inventory………….…………….…………….……….……………………25
0
Table of Contents (Cont.)
Content History………….…………….…………….……….………………….………...26
Admit Slips………….…………....…………….…………….…………….……….…..... 27
Tickets Out………….…………….…………….………………………….……….…..... 28
Internet Workshop………….…….…………….……….………………….……….…..... 29
Gallery Images………….…………….…………….……….………………….…………30
Reference:
McLaughlin, M. (2010). Content Area Reading. Boston, MA: Pearson Education.
1
An Educational Philosophy
My teaching philosophy is a student-centered approach that involves partnering with the learners
in my classroom. The achievement gap has been stubbornly persistent, and it is our job as
educators to tackle this social justice issue. To do this, we must build internal motivation in our
students to foster engagement with the learning process.
2
What is Literacy? A Personal Perspective
To be considered literate in our society implies several competencies. Literacy includes the
ability to consume and integrate new textual content into one’s pre-existing knowledge. Literacy
includes the ability to express oneself through text in various media (letters, emails, essays, blog
posts, short stories, tweets, etc.). Literacy also includes the ability to integrate information from a
variety of content areas (mathematics, science, history, technology, etc.).
3
The Value of Cultural Responsive Teaching to Teach Urban Learners
Culturally responsive teaching achieves many educational goals. It increases comprehension by
connecting educational content to students' lives. It ensures students see role models they can
relate to in every content area. It responds to the challenges and specific needs of the students in
the class. Ultimately, culturally responsive teaching is the tool that will eliminate the
achievement gap.
4
Connection Stems
Summary:
Connection Stems is a reading comprehension strategy in which students activate prior
knowledge and make a variety of connections or associations to the text they are reading. Note
that there are three kinds of connections: text-self (TS), text-text (TT), and text-world/others
(TW). Examples of Connection Stems are 'That reminds me of…' or 'I remember one…’
Students are asked to create connection stems prior to, during, and after reading various texts to
connect the new knowledge to students’ prior knowledge (constructivism).
Diagram:
Instructional Connection:
Connection Stems is useful when teaching mathematics. When introducing students to Sir Isaac
Newton, first elicit connection stems from students and share them with the class. One such
response is, "I remember eating Fig Newtons as a child (TS)." Or, "I once read that Newton
discovered the rainbow in white light (TT)." Then, students break into pairs and take turns
reading to each other about Newton. While one student is reading, the other generates new
connection stems. One example connection is "Newton and I have the same birthday (TS)!"
When students are done reading, students share their connections with the class. This maintains
their motivation by personalizing the experience, and helps students with comprehension.
5
Revise
(after reading)
Pre-reading Plan (PreP)
Summary:
Previewing is a comprehension strategy that includes activating background knowledge, setting
purposes for reading, and predicting what comes next based on what students have already read.
Pre-reading Plan (PreP) provides students with an opportunity to brainstorm words or ideas
related to a topic and explain why they suggested particular words. After clarifying the words or
ideas, they read a related text, revisit the terms, and revise as necessary.
Diagram:
Instructional Connection:
PreP is useful when teaching mathematics, especially when looking at introducing new
mathematical concepts. For example, when introducing circles, prompt students to consider
terms related to the concept of a circle (wheel, sphere, pi, radius), and the reasons they believe
the terms relate ("wheels are round," "spheres our three-dimensional circles"). Write them on the
board, and ask a student to read the text introducing circles. After the reading, the class reviews
the terms on the board, and suggests revisions to the list (circumference: distance across a circle,
center: middle of a circle). This procedure allows students to predict the type of information they
are about to learn, and connect it to their pre-existing knowledge (constructivism).
Reading
Topic
Related Term
Related Term
Reason
Reason
6
Juxtapositioning Texts
Summary:
Juxtapositioning Texts is a technique that helps demonstrate multiple perspectives. The technique
allows for a critical analysis of the issues presented in texts written from different perspectives.
Students are presented the texts in various contexts (whole class, individual reading, small
group) and are encouraged to consider how the narratives differ based upon the perspective of
the writers. Students are asked to consider what information is included, and excluded from the
texts, and why this might be. Juxtapositioning Texts provides students with a less subjective
perspective on an issue, allowing them to see it from multiple angles. Students also learn the
value of finding texts from different perspectives when investigating an issue.
Diagram:
Instructional Connection:
Juxtapositioning Texts is useful when teaching mathematics. When looking at the Pythagorean
theorem, there are a vast number of proofs. Introduce students to the traditional Pythagorean
proof provided in the textbook. Next, prompt students to get into small groups, each group learns
a different proof, and discusses the merits of learning the Pythagorean theorem with their
assigned proof (area of triangle side squares, Pythagoras' Proof, Bhaskara's First Proof). Next,
the class gets into new groups such that each of the new groups has a member representing each
of the different proofs. Students debate which of the proofs is the best method for learning the
Pythagorean theorem. Finally, each group reports back to the whole class by way of a nominated
spokesperson, giving the group's findings. This strategy allows students to consider how
different representations of the theorem might benefit students with different learning styles.
7
Write and Sketch in Math and Science
Summary:
Write and Sketch in Math and Science allows students to use both language and symbols to make
their thinking about problem solving visible to themselves and others. For example, when a math
problem is posed, students read or listen to the problem and paraphrase it. Then, they record their
thinking about how to solve the problem on a paper that has been divided in half vertically. On
the left side of the paper, students sketch a picture to solve a problem. On the right side of the
paper, students use words to solve it.
Diagram:
Instructional Connection:
Write and Sketch in Math and Science
is useful when teaching mathematics. When looking at Angle of Elevation word problems,
students must visualize the situation in order to solve the problem. Write and Sketch in Math and
Science provides a framework for students drawing the parts of the word problem and generating
the necessary triangle upon which the students apply the trigonometric equations. Students then
describe their thinking process on the right side of the paper, giving themselves an opportunity to
catch any flaws in their thinking. For example, "The angle of elevation from a sailboat to the top
of a 121-foot lighthouse on the shore measures 16°. To the nearest foot, how far is the sailboat
from shore?" The student would draw a picture of this scenario on the left side, and then explain
their process on the right. Their explanation could be, “since I know an angle, the height of the
side of the triangle opposite the angle, and want to know the length of the triangle adjacent to the
angle, I will use the tangent property. Since the tangent of an angle is equal to the opposite side
divided by the adjacent side, I will substitute the known values and solve for the adjacent side.”
To solve this problem,
first I drew a triangle to
represent the ways in
which the person either
biked or walked from the
start to the finishing
point…
8
Be a Math or Science Author
Summary:
When students create their own math problems or science experiments, they are more interested
and engaged. Designing written problems or experiments is an effective way to tap into students'
personal experiences and bridge the gap between existing and new knowledge. In addition,
practice in interpreting problems or experiments invented by peers, helps students better interpret
more formal information presented in textbooks or by teachers. With the Be a Math or Science
Author technique, students create problems to be solved by
classmates. Problem topics are left open to the
imagination of students, or directed by a topic currently
being studied in math class.
Diagram:
Instructional Connection:
Be a Math or Science Author is useful when
teaching mathematics. When looking at Angle of
Elevation, give students several examples of word
problems to solve, and then they generate word problems that include content from their own
lives. Examples might include finding the height of a local bridge, finding the distance to a far
off location based upon the known height of a far off structure or mountain/tree. An example is
"I know that tall building is 500 feet tall, and I can see with my clinometer that the angle of
elevation is 20°. How far away is that building?" Students then share their word problems with a
partner, and give each other feedback. Then, the whole class shares examples, and discusses
difficulties.
9
Anticipation/Reaction Guide
Summary:
Students use an Anticipation/Reaction Guide to preview what they are about to read and to
monitor their thinking while reading. Specifically, these guides activate prior knowledge, make
connections to the text, set purposes for reading, and develop more accurate understandings of
informational text. An Anticipation/Reaction Guide consists of several statements related to the
text; the statements may or may not be true. Before reading, students indicate whether they agree
or disagree with each statement and share their responses through partner, small-group, or
whole-group discussion. After reading, students revisit the statements, decide whether their
thinking has changed, and mark the statements accordingly. Then, the class discusses the guide
again, and students explain any changes in their thinking that occurred.
Diagram:
Instructional Connection:
An Anticipation/Reaction Guide is useful when teaching mathematics. When looking at the
hierarchy of quadrilaterals, students are asked questions about the properties of squares,
parallelograms, rhombi, rectangles, and trapezoids in the Anticipation/Reaction Guide. This
includes statements like: "Squares are a type of rectangle." and "The angle measure of two
consecutive interior angles in a parallelogram is 180°," and "A quadrilateral's diagonals bisect
each other," and "Trapezoids are types of parallelograms." This serves as a first assessment.
Then after reading the text, the class reviews and edits the list appropriately.
T/F 	
  Questions	
  
T 	
  Is	
  X	
  the	
  0irst...	
  
F 	
  Does	
  y	
  ...	
  
Read	
  the	
  text...	
  
Review	
  and	
  edit	
  the	
  
answers	
  to	
  the	
  true/
false	
  questions.	
  
10
Semantic Map
Summary:
Teachers use Semantic Maps to activate prior knowledge, introduce content specific vocabulary,
and organize information about a topic. When teaching students how to use this map, the teacher
chooses a focus word, engages students in brainstorming, and creates a graphic organizer that
features categories and details. Teachers use completed Semantic Maps to create summaries.
Because the design of the Semantic Map depends on students' responses, the structure of each
map is different. Students usually use Semantic Maps before and after reading either narrative or
informational text.
Diagram:
Instructional Connection:
A Semantic Map is useful when teaching mathematics. When looking at number sets, the teacher
chooses the focus word "Number Sets.” Students brainstorm to consider Related Terms (rational,
irrational, natural) and examples (1/2, pi, 432) and details (a rational number has one integer
divided by another, irrationals have nonrepeating infinite decimals, natural numbers are integers
starting with 1). Students read the informational text, rejoin the whole class, and edit the
Symantec Map based upon what is in the text. Students add details like the Related Term
“integer,” that this number set includes negative numbers and zero, and that an example is -432.
Focus	
  
Word	
  
Related	
  
Term	
  F	
  
Related	
  
Term	
  A	
  
Related	
  
Term	
  B	
  
Related	
  
Term	
  C	
  
Related	
  
Term	
  D	
  
Related	
  
Term	
  E	
  
Example 1
Example 2
…
Example 1
Example 2
…
Example 1
Example 2
…
Example 1
Example 2
…
Example 1
Example 2
…
Example 1
Example 2
…
11
Question-Answer Relationship
Summary:
Question-Answer Relationship (QAR) is a teaching idea that helps students understand how to
self-question. Students learn that there are two information sources: text (In the book) and prior
knowledge (In my head). Within each information source, there are two Question-Answer
Relationships. This teaching idea helps students focus on the information source needed to
answer a question. QAR is used when reading narrative and expository text. Give students a list
of questions that are each categorized as one of the four QAR methods below. Students then read
the text, and attempt to answer the questions using the method indicated.
Diagram:
Instructional Connection:
QAR is useful when teaching
mathematics. When
looking at geometry, ask
students questions from each of the four methods. For example, for 'Right There,' ask students,
"What is a property of two consecutive interior angles of a parallelogram?" For 'Think and
Search,' ask students, "What is a general formula which can be used to calculate the area of any
regular polygon?" For 'On My Own' ask students, "What kind of career might you imagine doing
where this knowledge would be useful?" For 'Author and Me' ask students, "When finding the
area of a regular polygon, do you think it is better to use the equations which break the polygons
into triangles, or the equations which are specific to each type of polygon? Justify your answer."
12
I Wonder
Summary:
"I wonder…" statements are designed to encourage students to generate questions and to provide
a model for active thinking during the reading process. These statements can be used with either
narrative or informational text, before, during, and after reading. "I wonder…" statements
are shared orally, through sketching, or in writing. One engaging way to use the strategy
is by students writing their "I wonder…" statements on a bookmark that
they place in the book they are wondering about.
Diagram:
Instructional Connection:
I Wonder is useful when teaching mathematics. When looking at right
triangles, prior to reading the text, students suggest "I wonder …" statements.
The teacher places a list on the board. Possible statements are "I wonder why are right triangles
used more than other triangles in man-made objects?" and "I wonder how long ago society
discovered the properties of right triangles?" Then, after learning about right triangles, the class
considers whether the text has brought clarity to the "I wonder" statements.
13
Paired Questioning
Summary:
In Paired Questioning, students engage in actively generating questions during reading. Paired
Questioning is a self-questioning reading comprehension strategy that involves generating
questions in order to guide thinking. While reading segments of the text, students take turns
generating text related questions and responding to them. When students finish, one partner
summarizes the important ideas in the text, and the other agrees or disagrees and justifies his or
her thinking.
Diagram:
Instructional Connection:
Paired Questioning is useful when
teaching mathematics. When looking at
the "Building Blocks of Geometry,"
students take turns reading the associated
text in pairs, and ask each other questions about the text between each section. Examples are:
"What is a physical model of a point/line/plane?" and "What does collinear/coplanar mean?" and
"What geometrical figure has endpoints?" Then, one student summarizes the text, and the other
student agrees or disagrees, and justifies their response. An example of a summary is "The
building blocks of geometry are the simple structures (points, lines, planes) that we combine to
create more complex shapes. We also use terms to describe how these structures relate to one
another (collinear, parallel, intersect).”
???!!!
???
!!!
14
Bookmark Technique
Summary:
Readers use the Bookmark Technique to monitor their comprehension while reading, and make
evaluative judgments about aspects of the text. This technique is used with narrative and
expository text, and works well with both in-class reading and homework assignments. The
Bookmark Technique is a reading comprehension strategy that involves readers constantly
asking themselves, "Does this make sense?" Teachers distribute the four bookmarks (depicted
below), explain the Bookmark Technique, introduce the text, guide students on how to use the
bookmarks, and then students practice on their own.
Diagram:
Instructional Connection:
The Bookmark Technique is useful when teaching
mathematics. Before students read about the
mathematical concept of midpoint, hand out the
four bookmarks, and describe the topic and how to
use the bookmarks while reading. Read a section of the text with the whole class, and complete
the first bookmark. For example, "The part I found most interesting was ancient mapmakers. I
thought it was interesting because ancient mapmakers around the globe used the concept of
midpoint to help them create navigational maps." Then, students complete the final three
bookmarks on their own. An example for Bookmark 4 is "The visual that helped me understand
the reading was the midpoint drawn on the xy-plane." An example for Bookmark 2 is
"Something that confused me was how to find a midpoint from two coordinates. The reason it
confused me is I didn't understand why the formula results in a midpoint."
15
Questions into Paragraphs (QuIP)
Summary:
Questions into Paragraphs (QuIP) is a reading strategy that involves extracting essential
information from text. QuIP provides a framework for initiating research, structuring writing,
and summarizing. Students choose a topic and develop three related research questions. Then,
they respond to each question from two sources. When the graphic organizer is complete,
students use the information to write a paragraph. Students use QuIP before reading (generating
questions), during reading (reading the information provided by the two sources), and after
reading (writing the summary).
Diagram:
QuIP Research Grid
Topic:__________________
Questions Answers QuIP Paragraph
Source 1: Source 2:
A.
B.
C.
Instructional Connection:
QuIP is useful when teaching mathematics. When looking at regular polygons, students ask
questions like "What properties are the same for all regular polygons?" and "What makes a
regular polygon 'regular'?" and "How do I find the area of a regular polygon?" Then, the teacher
gives students a text about regular polygons, access to the Internet, and URLs of some math sites.
Students gather relevant information from these sources, place them on the research grid, and
subsequently writes a paragraph summarizing their findings. An example of part of a summary is,
"Regular polygons have congruent sides, and congruent interior angles.”
16
Venn Diagram
Summary:
The Venn Diagram is named for its creator, John Venn, who used it to express thoughts about
logic. The diagram, which is represented by two interlocking circles, provides a format for us to
note similarities and differences or two perspectives about a topic. The similarities appear in the
overlapping sections of the circles; the differences appear in the outer sides of each circle.
Students use Venn Diagrams as an evaluative comprehension strategy that involves making
judgments while reading. Students read some text that describes two different perspectives or
similarities and differences about a topic. Students label each circle (each one being a
perspective or one of two things a student is comparing). Students then place common
characteristics in the overlapping section, and non-common characteristics to the left or to the
right of the overlapping section.
Diagram:
Instructional Connection:
Venn Diagrams are useful when teaching mathematics. When looking at multiples, students
generate a Venn diagram with the concepts of "multiples of two" and "multiples of three."
Students then generate multiples of these kinds (2: [2,4,6,8,10,12]; 3:[3,6,9,12]), and place them
in the appropriate locations on the diagram (2:[2,4,8,10], Both:[6,12], 3:[3,9]). Students then
repeat the process with different multiples ("multiples of four", "multiples of five"). This process
makes the concept of multiples less abstract by placing the relationships visually on a page.
Concept	
  1	


Unique	
  
Aspects	
  
Concept	
  2	


Unique	
  
Aspects	
  
Aspects
Similar
to Both
17
Semantic Question Map
Summary:
The Semantic Question Map is a form of previewing; a comprehension strategy that includes
activating background knowledge, setting purposes for reading, and predicting what comes next
based upon what was read. The Semantic Question Map is a variation on the Semantic Map, but
its general design is fixed. The Teacher places a focus word on the board, and then raises several
questions about it. The Teacher places the questions, which may be provided by the teacher or
generated by the students, inside the ovals that extend from the focus word. Teachers use
Semantic Question Maps when they want students to focus on particular aspects of the topic.
Diagram:
Instructional Connection:
The Semantic Question Map is useful when teaching mathematics. When looking at parallel lines
in geometry, the teacher assigns "parallel lines" as the focus word, and prompts students to ask
questions. Students may ask, "What shapes have parallel lines?" and "How can parallel lines in a
shape help us figure out things about the shape?" and "What defines parallel lines?" Students try
to answer these questions with what knowledge they already have. Students read a text on
parallel lines, and revisit their responses to the questions. This process prepares students' minds
to look for information regarding the focus word while reading. It also engages the reader as an
active participant in the reading process.
Focus
WordQuestion 4 Question 3
Question 1 Question 2
18
Concept of Definition Map
Summary:
The Concept of Definition Map is designed to help students construct meaning by making
connections between their prior knowledge and new topics. It provides information such as a
definition, a description, and examples. This graphic is used before, during, and after reading.
When the map is completed, the class creates a Concept of Definition Map summary. When
teaching summarizing, ask students to extract important information from the text. Students,
however, often struggle in determining which information is important. Therefore, creating a
summary based on the Concept of Definition Map provides students with the opportunity to use
the important information. In the process,
students learn that the important
information includes components of the
Map.
Diagram:
Instructional Connection:
A Concept of Definition Map is useful when teaching mathematics. When looking at algebraic
properties, the teacher starts by brainstorming with the students what the term means (rules for
manipulating algebraic expressions), ideas connected to the term (commutative, associative,
distributed), and examples (see above). The teacher completes a Concept of Definition Map on
the board, and instructs students to do so in their notes. Then, students read the text related to
algebraic properties. The teacher instructs students to be on the lookout for the information to
complete the Map. After students read the text, the class edits the Map together with the new
information. In this case the students add the example of commutative addition, "6a + 5 = 5 + 6a.”
Focus	
  Word:	


Algebraic	
  
Properties	
  
Commutative
Distributive
Multiplication:
2x(6 + y) = 12x + 2xy
Distributive
Associative
Rules
Associative Addition:
(4x + 2x) + 7x =
4x + (2x + 7x)
Commutative
Addition:
6a + 5 = 5 + 6a
What are they?
What are some
examples?
19
Semantic Feature Analysis Chart
Summary:
The Semantic Feature Analysis Chart is a graphic organizer that helps students make predictions
about attributes related to specific words, sort by characteristics, and set a purpose for reading or
researching. Semantic Feature Analysis Charts help students monitor their thinking and learn
about words. Students use Semantic Feature Analysis Charts to compare and contrast the
characteristics or qualities of multiple items or types of people. Students use this chart before
they read to activate background knowledge, and after they read to add information and/or draw
conclusions.
Diagram:
Characteristics
Categories
Parallel Sides All Right
Angles
Complementary
Consecutive
Angles
Congruent
Opposite Angles
Congruent
Opposite Sides
Area = b·h
Squares ✔ ✔ ✔ ✔ ✔ ✔
Circles ! ! ! ! ! !
Parallelograms ✔ ! ✔ ✔ ✔ ✔
Rhombi ✔ ! ✔ ✔ ✔ ✔
Triangles ! ! ! ! ! !
Rectangles ✔ ✔ ✔ ✔ ✔ ✔
✔ = Yes ! = No ? = Don't know
Instructional Connection:
The Semantic Feature Analysis Chart is useful when teaching mathematics. When looking at
properties of two-dimensional shapes, the teacher starts by brainstorming with the students the
different kinds of two-dimensional shapes, different characteristics to compare, and whether each
one of the shapes has these characteristics (see above). The teacher completes a Semantic
Feature Analysis Chart on the board, and instructs students to do so in their notes. Then, students
read text related to the characteristics of two-dimensional shapes. The teacher instructs students
to be on the lookout for the information to complete the chart. After students read the text, the
class edits the chart together with the new information.
20
I.N.S.E.R.T
Summary:
The Interactive Notation System to Effective Reading and Thinking method (INSERT) is a
reading comprehension strategy that involves constantly asking, "Does this make sense?" and
adapting strategic processes to make the message clear. Students brainstorm what they know
about the topic, read the text, and insert four symbols as they read. Students place a checkmark in
the margin if the information verifies what is on their brainstorming list. Students place a plus
symbol if it is new information. Students place a minus symbol if the information contradicts
what is on their list. Students place a question mark if the information is something that is
confusing. After placing the symbol, students write their observations on one of four bookmarks.
Diagram:
Instructional Connection:
INSERT is useful when teaching mathematics. When looking
at the properties of a polygon, the teacher has students
brainstorm what they know about polygons (perhaps that they
are two-dimensional and enclose a space). Then, students
break up into pairs, and take turns reading paragraphs to each other. Students pause between
paragraphs and decide together which symbols to place in the text, and what information to place
on the bookmarks. In addition to confirming what they learned in the brainstorm, they might also
learn that polygons have straight sides and can fit into the categories of equiangular, and
equilateral (+ Bookmark). They may have questions about the term vertex, regular polygon, and
n-gon (? Bookmark). They may also discover properties that they were mistaken about when
brainstorming (- Bookmark).
21
List-Group-Label
Summary:
Students use List-Group-Label to preview and monitor information presented in informational
text. This teaching idea is used before and after reading to activate background knowledge and to
help students become familiar with how selected words relate to a concept and to other words.
Students brainstorm around a "cue term," coming up with related words and grouping some into
clusters. Students then read the text, and refine their list.
Diagram:
Cue Term: ________________
Before reading: Brainstormed words and clusters
Cluster I
Related Word 1
Related Word 2
…
Cluster II
Related Word 1
Related Word 2
…
Cluster III
Related Word 1
Related Word 2
…
Instructional Connection:
List-Group-Label is useful when teaching mathematics. When looking at simple mathematical
operations, the class brainstorms words used to describe basic mathematical operations. For
example: subtract, sum, divided by, minus, equals, increased by, multiple, difference, take away,
and add. The teacher writes this list on the board. Then, the class decides how to group the terms
into clusters (addition, subtraction, multiplication, division, equals). Then, students read the text
on mathematical operations. Finally, the class regroups to contribute more words/clusters to the
list. Example words to add are: more, together, combined, decreased by, tripled, twice, quotient,
ratio, out of, totals, and is. By completing this list and categorizing all the words, students
become familiar with the different ways mathematical operations can be referred to in narrative
text. The exercise also helps students categorize the terms, and to easily see what other terms
imply the same operation.
22
Think-Aloud
Summary:
Think-Alouds help scaffold learning for students. The teacher selects a passage to read aloud to
the students. The passage should require some strategic thinking to clarify understandings.
Explain that Think-Alouds model strategic behavior and thoughts in the reading process. Prior to
reading, the teacher describes connections they can make to the text. Then, as the teacher reads,
they think aloud to demonstrate monitoring, visualizing, and summarizing. Students then break
up into pairs and practice this technique with each other.
Diagram:
Instructional Connection:
Think-Alouds are useful when teaching mathematics. Let us look
at the word problem "Rachelle's school photo package includes
one large photo and several smaller photos. The large photo is
similar to the small photo. The small photo is 2 inches long and
1.5 inches wide. If the height of the large photo is 10 inches, what
is the width?" The teacher reads this problem to the students. The teacher pauses on the phrase
"similar to the small photo," and says, "I recall that similar objects have proportional
measurements." After reading the third sentence, the teacher says, "I notice there are two related
numbers in the sentence, maybe this is the ratio statement? I also notice the terms 'long' and
'wide', which might be used to label a proportion box." After finishing reading the problem, the
teacher says, "Since I suspect this is a proportion problem, even though I am not sure what the
answer might be, I am going to draw a proportion box and label it to get me started."
Since I did not
understand this passage,
I am going to reread it.
?!?!?!
23
Content Area Inventory
Summary:
In Content Area Inventories, students record their thoughts about content-related topics. Content
Area Inventories promote reflection and provide students with an opportunity to express their
feelings and share their prior knowledge about the content area they are studying. Teachers then
alter their lesson plans to better engage their students.
Diagram:
The best thing about [the math topic I am studying] is…
The worst thing about [the math topic I am studying] is…
One way that I use mathematics outside of school is…
My favorite part of mathematics class is…
In math class, I like to work in groups so that I…
In math class, I like to work…
When I finish a math problem from class, I feel…
When I use the math I learned in this class, I am proud of…
Regarding [this math topic], I wish I knew more about…
Instructional Connection:
Content Area Inventories are useful when teaching mathematics. When looking at percentage
ratio word problems, an example student response is, "The worst thing about percentage ratio
problems is knowing where to put numbers in a proportioned box. My favorite part of
mathematics class is when I figure out a problem before others do. I like to work in groups so
that I can see how other students think about a problem. I wish I knew more about how to label
my proportion boxes." Teachers examine the responses from their students, and look for trends.
Assuming the previous example was a typical response, the teacher responds by reviewing with
the class how to determine where to put labels when constructing a proportion box. The teacher
pays attention to how students answered the "I like to work…" question, to design the learning
environment in a way most conducive to learning.
24
Content History
Summary:
Content History invites students to contemplate previous experiences in a content area. For
students, it promotes reflection, helps make connections between past and present day
experiences, and cultivates self-understanding. For teachers, it provides insights into students'
previous learning experiences that can be used to foster motivation and informal planning.
Diagram:
These prompts are offered to help create a math history. A math history details your mathematical development from earliest memory to now.
These prompts are intended only to stimulate your thinking. Include any information you would like to make your history meaningful.
1. What is your earliest math memory?
2. Can you recall how or if you used numbers before you entered school?
3. Can you recall experiences from your math education in elementary?
4. Do you remember a person or activity that helped you learn about math?
5. What is one thing you would change about your math experiences?
6. Do you recall any ways you used math outside of school?
7. Do you feel comfortable using math now? Why? Why not?
8. Did you enjoy math in any particular grade? Why? Why not?
9. Offer advice to students just beginning to study math.
10. Name two ways you will use math after you graduate.
Instructional Connection:
Content History is useful when teaching mathematics. When looking at the first day of a high
school ninth grade geometry class, students fill out Content Histories. Example responses being,
"I was transferred from Hudson Wisconsin two years ago, and some of the math they were doing
here did not make sense." Or, "I did well in math, except for in fifth grade." A teacher receiving
these responses alters the way they deliver lessons. The teacher realizes that the student who
transferred has holes in their mathematical exposure due to the Common Core being different
than Minnesota standards. Particularly, if the student who transferred from Wisconsin did so
between 6th and 7th grades, they have missed content related to angles and geometric figures,
which Minnesota does in 6th grade, but Wisconsin does not do until 7th. The teacher would also
look at the math content the other student missed in 5th grade (properties of three-dimensional
figures, areas of triangles and quadrilaterals, surface area, and volumes of rectangular prisms).
This information would inform the teacher about what content they need to more carefully
review, and the need for some supports for specific students.
25
Admit Slips
Summary:
Admit Slips are used to assess prior knowledge when preparing to teach about a topic, or assess
student understanding of a topic about to be taught. When completing an Admit Slip, students
reflect on what they know about a particular topic. Students can write their responses on a
graphic organizer or on an index card. On the first side, students write what they already know
about a topic; on the second side, they write a question they have about that topic. Teachers
collect the slips before formally beginning class. Reading the slips allows teachers to respond in
the next class to questions.
Diagram:
Instructional Connection:
Admit Slips are useful when teaching mathematics. When beginning a unit on trigonometry,
some example "already know" response are: "… that trigonometry has to do with triangles." and
"… that trigonometry has to do with circles." and "… that it has something to do with soaking
your feet in the river." Some example questions are: "When does anyone use trigonometry in real
life?" and "Who invented trigonometry?" Given these responses, the next day the teacher verifies
that trigonometry does indeed have to do with circles and triangles. The teacher verifies that
there is a trigonometric mnemonic called SOHCAHTOA ("Soak a Toe-uh"), but that you do not
actually have to put your feet in a river. The teacher would also talk about how trigonometry is
used in the real world (astronomy, land surveying, oceanography, architecture, navigation, and
studying light and sound waves), and the history of its discovery (Egypt, Iraq, and Greece).
What I already know
about this topic…
------------------------
A question I have about
this topic is…
26
Tickets Out
Summary:
Tickets Out ask students to reflect on what they learned that day, and what questions they have
about it. The students’ responses to what they have learned are recorded on the front of the
graphic organizer, and any questions they may have are written on the back. Teachers collect the
tickets as they stand at the door at the end of class. Teachers use these to determine what
questions they should address the next class period.
Diagram:
Instructional Connection:
Tickets Out are useful when teaching mathematics. When looking at properties of
polygons, some example ‘What did I learn’ responses are, "…that diagonals connect to opposite
vertices of a polygon," and "…that geometry is really boring." Some example ‘A question I have’
responses are, "Do I have to memorize a new area equation for every polygon?" and "Why
should I care about polygons?" The teacher addresses these issues the next day. Given the
previous responses, the teacher attempts to make the content more engaging and entertaining to
address students being bored (using manipulatives, polygon art-project, educational polygon
videogame). The teacher clarifies that a diagonal connects two nonconsecutive vertices. The
teacher lets the students know that they need not learn new area formulas for each polygon, but
that there are shortcuts for regular polygons (involving dividing the polygon up into triangles and
using the triangle area formula). The teacher also gives examples of the types of careers students
might pursue, where this type of knowledge is useful (art, architecture, engineering, physics,
videogame programmers).
What did I learn today?
------------------------
A question I have about
what I learned…
27
Internet Workshop
Summary:
Internet Workshop is especially useful for introducing students to websites for an upcoming unit
and developing background knowledge. During such a workshop, students work individually, in
collaboration with classmates, or in conjunction with international peers. Steps often include:
students locating websites, developing an activity related to class learning goals, recording
information in an electronic journal, and continued periodic workshop sessions. Internet
Workshop is an effective way to help expand students' understanding of the topic being studied.
Diagram:
Instructional Connection:
Internet Workshop is useful when teaching mathematics. When looking at geometric
transformations, begin the unit by explaining to the students that are going to visit a computer lab.
On an overhead, show them how to create a Khan Academy website account
(khanacademy.org/signup). Show them how the website is used to study every area of math, and
how it to supplement any math class they are in. Explain that in this unit, students learn about
geometric transformations. Give them handouts with this information, and bring them to the
computer lab. Students register an account, and begin the online unit "Axis of Symmetry." In this
online unit, students watch videos, take online quizzes, and earn points/badges for their efforts.
The class visits the lab every Friday. Students complete "Exploring Rigid Transformations,"
"Dilations or scaling around a point," and "Transformations on the coordinate plane." As an
assessment, the teacher tracks each student's online score total and badge tally.
New Unit
Jumpstart
28
Gallery Images
Summary:
Gallery Images is a visualizing reading comprehension strategy that involves students creating
mental images of the text as they read. Gallery Images help us to create visualizations while
reading and provide a format for sharing our mental images. This technique is usually used after
reading informational text. Students use this technique by sketching images as they read content
area text. They write a description for each image, share their images with a partner or group,
and discuss their different visualizations.
Diagram:
Instructional Connection:
Gallery Images are useful when teaching mathematics. When looking at the Law of Sines,
students read a problem individually, “Jack is on one side of a 200-foot-wide canyon and Jill is
on the other. Jack and Jill can both see the trail guide at an angle of depression of 60 degrees.
How far are they from the trail guide?" Then, students attempt to draw a diagram representing
the scenario (triangle with 200 foot top length). Students then write a sentence or two indicating
what type of mathematical tools one might need to tackle the problem (interior angle sum of a
triangle, properties of triangles). Next, they compare their drawing to the drawings of other
students at their table before working with their tablemates to answer the question. When they
subtract the two 60° angles (depressions) from 180° (interior angle sum), they learned that the
last angle is also 60°. They then realize the triangle is equilateral; so all the side lengths are equal.
Therefore, the side lengths that represent the distance from Jack or Jill to the trail guide are also
200 feet.

More Related Content

What's hot

Assessing Problem Based Learning - 2019
Assessing Problem Based Learning - 2019Assessing Problem Based Learning - 2019
Assessing Problem Based Learning - 2019
Carmel Schettino
 
Senior Project Research Paper
Senior Project Research PaperSenior Project Research Paper
Senior Project Research Paperkayleigh_lane
 
ITL516 Week One Assignment One
ITL516 Week One Assignment OneITL516 Week One Assignment One
ITL516 Week One Assignment One
MeganWaldeck
 
Red4519 CA#1
Red4519 CA#1Red4519 CA#1
Red4519 CA#1
Victoria Anderson
 
Reading Strategy FLIP chart
Reading Strategy FLIP chartReading Strategy FLIP chart
Reading Strategy FLIP chart
Charlene Roddy
 
Lesson Plan Student centered Clinical
Lesson Plan Student centered ClinicalLesson Plan Student centered Clinical
Lesson Plan Student centered Clinical
MWilt21
 
Finding Your Voice as an Academic Writer
Finding Your Voice as an Academic WriterFinding Your Voice as an Academic Writer
Finding Your Voice as an Academic Writer
bikashtaly
 
Artikel 1 example_qualitative_study_math
Artikel 1 example_qualitative_study_mathArtikel 1 example_qualitative_study_math
Artikel 1 example_qualitative_study_math
Sashi Raju
 

What's hot (8)

Assessing Problem Based Learning - 2019
Assessing Problem Based Learning - 2019Assessing Problem Based Learning - 2019
Assessing Problem Based Learning - 2019
 
Senior Project Research Paper
Senior Project Research PaperSenior Project Research Paper
Senior Project Research Paper
 
ITL516 Week One Assignment One
ITL516 Week One Assignment OneITL516 Week One Assignment One
ITL516 Week One Assignment One
 
Red4519 CA#1
Red4519 CA#1Red4519 CA#1
Red4519 CA#1
 
Reading Strategy FLIP chart
Reading Strategy FLIP chartReading Strategy FLIP chart
Reading Strategy FLIP chart
 
Lesson Plan Student centered Clinical
Lesson Plan Student centered ClinicalLesson Plan Student centered Clinical
Lesson Plan Student centered Clinical
 
Finding Your Voice as an Academic Writer
Finding Your Voice as an Academic WriterFinding Your Voice as an Academic Writer
Finding Your Voice as an Academic Writer
 
Artikel 1 example_qualitative_study_math
Artikel 1 example_qualitative_study_mathArtikel 1 example_qualitative_study_math
Artikel 1 example_qualitative_study_math
 

Viewers also liked

Doll face
Doll faceDoll face
Se tiene un cátodo constituido por 88
Se tiene un cátodo constituido por 88Se tiene un cátodo constituido por 88
Se tiene un cátodo constituido por 88
Maria Karelia Quispe Zuñiga
 
Ms. Priya Gupta
Ms. Priya GuptaMs. Priya Gupta
Inspirational speech
Inspirational speechInspirational speech
Inspirational speechsebdel11
 
EligibilityLetter%2520(1) (1)
EligibilityLetter%2520(1) (1)EligibilityLetter%2520(1) (1)
EligibilityLetter%2520(1) (1)heba abou diab
 
データ・ビジュアライゼーションによる新しい気づきとは
データ・ビジュアライゼーションによる新しい気づきとはデータ・ビジュアライゼーションによる新しい気づきとは
データ・ビジュアライゼーションによる新しい気づきとは
Hisashi Igarashi
 
BIがクラウドで更なる進化!  データとの連携を強化したデータビジュアライゼーション
BIがクラウドで更なる進化!  データとの連携を強化したデータビジュアライゼーションBIがクラウドで更なる進化!  データとの連携を強化したデータビジュアライゼーション
BIがクラウドで更なる進化!  データとの連携を強化したデータビジュアライゼーション
Hisashi Igarashi
 
Hriday das
Hriday dasHriday das
Hriday das
Hriday Das
 
Branding In The Age Of Social Media
Branding In The Age Of Social MediaBranding In The Age Of Social Media
Branding In The Age Of Social Media
Amritansh Bharech
 

Viewers also liked (10)

Smarterboard 01
Smarterboard 01Smarterboard 01
Smarterboard 01
 
Doll face
Doll faceDoll face
Doll face
 
Se tiene un cátodo constituido por 88
Se tiene un cátodo constituido por 88Se tiene un cátodo constituido por 88
Se tiene un cátodo constituido por 88
 
Ms. Priya Gupta
Ms. Priya GuptaMs. Priya Gupta
Ms. Priya Gupta
 
Inspirational speech
Inspirational speechInspirational speech
Inspirational speech
 
EligibilityLetter%2520(1) (1)
EligibilityLetter%2520(1) (1)EligibilityLetter%2520(1) (1)
EligibilityLetter%2520(1) (1)
 
データ・ビジュアライゼーションによる新しい気づきとは
データ・ビジュアライゼーションによる新しい気づきとはデータ・ビジュアライゼーションによる新しい気づきとは
データ・ビジュアライゼーションによる新しい気づきとは
 
BIがクラウドで更なる進化!  データとの連携を強化したデータビジュアライゼーション
BIがクラウドで更なる進化!  データとの連携を強化したデータビジュアライゼーションBIがクラウドで更なる進化!  データとの連携を強化したデータビジュアライゼーション
BIがクラウドで更なる進化!  データとの連携を強化したデータビジュアライゼーション
 
Hriday das
Hriday dasHriday das
Hriday das
 
Branding In The Age Of Social Media
Branding In The Age Of Social MediaBranding In The Age Of Social Media
Branding In The Age Of Social Media
 

Similar to Log_4_9_2015

14 PEER RESPONSES DUE IN 16 HOURS - EACH SET OF 2 HAS ITS OWN INSTRU.docx
14 PEER RESPONSES DUE IN 16 HOURS - EACH SET OF 2 HAS ITS OWN INSTRU.docx14 PEER RESPONSES DUE IN 16 HOURS - EACH SET OF 2 HAS ITS OWN INSTRU.docx
14 PEER RESPONSES DUE IN 16 HOURS - EACH SET OF 2 HAS ITS OWN INSTRU.docx
herminaprocter
 
Concept mapping
Concept mappingConcept mapping
Concept mapping
sandhyajayalekshmi
 
Mathematics Essay Topics
Mathematics Essay TopicsMathematics Essay Topics
Mathematics Essay Topics
Cheapest Paper Writing Service
 
English science-kathy caton
English science-kathy catonEnglish science-kathy caton
English science-kathy caton
Ruslana Shamanska
 
Algebraic Thinking A Problem Solving Approach
Algebraic Thinking  A Problem Solving ApproachAlgebraic Thinking  A Problem Solving Approach
Algebraic Thinking A Problem Solving Approach
Cheryl Brown
 
Reading Strategies
Reading Strategies Reading Strategies
Reading Strategies
WestonBennett2
 
LRA2012
LRA2012LRA2012
LRA2012
Paige Vitulli
 
Engaged Learning Strategies
Engaged Learning StrategiesEngaged Learning Strategies
Engaged Learning StrategiesMandie Funk
 
Authentic Tasks And Mathematical Problem Solving
Authentic Tasks And Mathematical Problem SolvingAuthentic Tasks And Mathematical Problem Solving
Authentic Tasks And Mathematical Problem Solving
Jim Webb
 
Rickard, anthony teaching prospective teachers about mathematical reasoning n...
Rickard, anthony teaching prospective teachers about mathematical reasoning n...Rickard, anthony teaching prospective teachers about mathematical reasoning n...
Rickard, anthony teaching prospective teachers about mathematical reasoning n...
William Kritsonis
 
3rd Grade Webinar Slideshow
3rd Grade Webinar Slideshow3rd Grade Webinar Slideshow
3rd Grade Webinar Slideshowjwalts
 
Michael Van Kirk CA1
Michael Van Kirk CA1Michael Van Kirk CA1
Michael Van Kirk CA1
fake name
 
MVK CA1
MVK CA1MVK CA1
MVK CA1
fake name
 
Qar using non fiction
Qar using non fictionQar using non fiction
Qar using non fictionlisa handline
 
Reading Mathematics Is Different
Reading Mathematics Is DifferentReading Mathematics Is Different
Finalreadingmathematicsisdifferent 091001173549-phpapp01
Finalreadingmathematicsisdifferent 091001173549-phpapp01Finalreadingmathematicsisdifferent 091001173549-phpapp01
Finalreadingmathematicsisdifferent 091001173549-phpapp01Marilyn Batchelor
 
Creating A Literate Environment
Creating A Literate EnvironmentCreating A Literate Environment
Creating A Literate Environment
Rose Persons
 
Essay On Learning Theories
Essay On Learning TheoriesEssay On Learning Theories
Essay On Learning Theories
Paper Writing Service Superiorpapers
 

Similar to Log_4_9_2015 (20)

Red slideshare
Red slideshareRed slideshare
Red slideshare
 
Red slideshare
Red slideshareRed slideshare
Red slideshare
 
14 PEER RESPONSES DUE IN 16 HOURS - EACH SET OF 2 HAS ITS OWN INSTRU.docx
14 PEER RESPONSES DUE IN 16 HOURS - EACH SET OF 2 HAS ITS OWN INSTRU.docx14 PEER RESPONSES DUE IN 16 HOURS - EACH SET OF 2 HAS ITS OWN INSTRU.docx
14 PEER RESPONSES DUE IN 16 HOURS - EACH SET OF 2 HAS ITS OWN INSTRU.docx
 
Concept mapping
Concept mappingConcept mapping
Concept mapping
 
Mathematics Essay Topics
Mathematics Essay TopicsMathematics Essay Topics
Mathematics Essay Topics
 
English science-kathy caton
English science-kathy catonEnglish science-kathy caton
English science-kathy caton
 
Algebraic Thinking A Problem Solving Approach
Algebraic Thinking  A Problem Solving ApproachAlgebraic Thinking  A Problem Solving Approach
Algebraic Thinking A Problem Solving Approach
 
Reading Strategies
Reading Strategies Reading Strategies
Reading Strategies
 
LRA2012
LRA2012LRA2012
LRA2012
 
Engaged Learning Strategies
Engaged Learning StrategiesEngaged Learning Strategies
Engaged Learning Strategies
 
Authentic Tasks And Mathematical Problem Solving
Authentic Tasks And Mathematical Problem SolvingAuthentic Tasks And Mathematical Problem Solving
Authentic Tasks And Mathematical Problem Solving
 
Rickard, anthony teaching prospective teachers about mathematical reasoning n...
Rickard, anthony teaching prospective teachers about mathematical reasoning n...Rickard, anthony teaching prospective teachers about mathematical reasoning n...
Rickard, anthony teaching prospective teachers about mathematical reasoning n...
 
3rd Grade Webinar Slideshow
3rd Grade Webinar Slideshow3rd Grade Webinar Slideshow
3rd Grade Webinar Slideshow
 
Michael Van Kirk CA1
Michael Van Kirk CA1Michael Van Kirk CA1
Michael Van Kirk CA1
 
MVK CA1
MVK CA1MVK CA1
MVK CA1
 
Qar using non fiction
Qar using non fictionQar using non fiction
Qar using non fiction
 
Reading Mathematics Is Different
Reading Mathematics Is DifferentReading Mathematics Is Different
Reading Mathematics Is Different
 
Finalreadingmathematicsisdifferent 091001173549-phpapp01
Finalreadingmathematicsisdifferent 091001173549-phpapp01Finalreadingmathematicsisdifferent 091001173549-phpapp01
Finalreadingmathematicsisdifferent 091001173549-phpapp01
 
Creating A Literate Environment
Creating A Literate EnvironmentCreating A Literate Environment
Creating A Literate Environment
 
Essay On Learning Theories
Essay On Learning TheoriesEssay On Learning Theories
Essay On Learning Theories
 

Log_4_9_2015

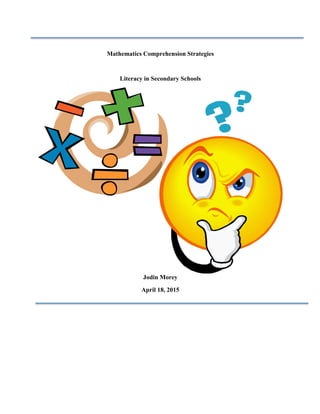
  • 1. 0 Mathematics Comprehension Strategies Literacy in Secondary Schools Jodin Morey April 18, 2015
  • 2. 1 Table of Contents An Educational Philosophy…………………………………………….…………….………... 3 What is Literacy? A Personal Perspective...………………..………………………….………. 4 The Value of Cultural Responsive Teaching to Teach Urban Learners……………………… 5 Strategies: Connection Stems……………………………………………………………….………... 6 Pre-reading Plan (PreP) ………………………………………………………….………. 7 Juxtaposition Texts……………………………………………………………….………. 8 Write and Sketch in Math and Science………………………………………………...... 9 Be a Math or Science Author………………………………………………….………..... 10 Anticipation/Reaction Guide………………………………………………….………….. 11 Semantic Map……………………………………………………….……………………. 12 Question-Answer Relationships……………………………………………………..…... 13 I Wonder…………………………………………………………….…………………..... 14 Paired Questioning……………………………………………………….…………..…... 15 Bookmark Technique…………………………………………………….………….…… 16 Questions into Paragraphs (QuIP) …………………………………………….…….…… 17 Venn Diagram………………………………………………………………….…….…... 18 Semantic Question Map………….…………….…………….…………….……….…..... 19 Concept of Definition Map ………….…………….…………….……………………..... 20 Semantic Feature Analysis Chart………….…………….…………….…………….….....21 I.N.S.E.R.T………….…………….…………….……….………………….……….….....22 List-Group-Label………….…………….…………….……………....…………….…..... 23 Think-Aloud………….…………….…………….……….………………….……….…...24 Content Area Inventory………….…………….…………….……….……………………25
  • 3. 0 Table of Contents (Cont.) Content History………….…………….…………….……….………………….………...26 Admit Slips………….…………....…………….…………….…………….……….…..... 27 Tickets Out………….…………….…………….………………………….……….…..... 28 Internet Workshop………….…….…………….……….………………….……….…..... 29 Gallery Images………….…………….…………….……….………………….…………30 Reference: McLaughlin, M. (2010). Content Area Reading. Boston, MA: Pearson Education.
  • 4. 1 An Educational Philosophy My teaching philosophy is a student-centered approach that involves partnering with the learners in my classroom. The achievement gap has been stubbornly persistent, and it is our job as educators to tackle this social justice issue. To do this, we must build internal motivation in our students to foster engagement with the learning process.
  • 5. 2 What is Literacy? A Personal Perspective To be considered literate in our society implies several competencies. Literacy includes the ability to consume and integrate new textual content into one’s pre-existing knowledge. Literacy includes the ability to express oneself through text in various media (letters, emails, essays, blog posts, short stories, tweets, etc.). Literacy also includes the ability to integrate information from a variety of content areas (mathematics, science, history, technology, etc.).
  • 6. 3 The Value of Cultural Responsive Teaching to Teach Urban Learners Culturally responsive teaching achieves many educational goals. It increases comprehension by connecting educational content to students' lives. It ensures students see role models they can relate to in every content area. It responds to the challenges and specific needs of the students in the class. Ultimately, culturally responsive teaching is the tool that will eliminate the achievement gap.
  • 7. 4 Connection Stems Summary: Connection Stems is a reading comprehension strategy in which students activate prior knowledge and make a variety of connections or associations to the text they are reading. Note that there are three kinds of connections: text-self (TS), text-text (TT), and text-world/others (TW). Examples of Connection Stems are 'That reminds me of…' or 'I remember one…’ Students are asked to create connection stems prior to, during, and after reading various texts to connect the new knowledge to students’ prior knowledge (constructivism). Diagram: Instructional Connection: Connection Stems is useful when teaching mathematics. When introducing students to Sir Isaac Newton, first elicit connection stems from students and share them with the class. One such response is, "I remember eating Fig Newtons as a child (TS)." Or, "I once read that Newton discovered the rainbow in white light (TT)." Then, students break into pairs and take turns reading to each other about Newton. While one student is reading, the other generates new connection stems. One example connection is "Newton and I have the same birthday (TS)!" When students are done reading, students share their connections with the class. This maintains their motivation by personalizing the experience, and helps students with comprehension.
  • 8. 5 Revise (after reading) Pre-reading Plan (PreP) Summary: Previewing is a comprehension strategy that includes activating background knowledge, setting purposes for reading, and predicting what comes next based on what students have already read. Pre-reading Plan (PreP) provides students with an opportunity to brainstorm words or ideas related to a topic and explain why they suggested particular words. After clarifying the words or ideas, they read a related text, revisit the terms, and revise as necessary. Diagram: Instructional Connection: PreP is useful when teaching mathematics, especially when looking at introducing new mathematical concepts. For example, when introducing circles, prompt students to consider terms related to the concept of a circle (wheel, sphere, pi, radius), and the reasons they believe the terms relate ("wheels are round," "spheres our three-dimensional circles"). Write them on the board, and ask a student to read the text introducing circles. After the reading, the class reviews the terms on the board, and suggests revisions to the list (circumference: distance across a circle, center: middle of a circle). This procedure allows students to predict the type of information they are about to learn, and connect it to their pre-existing knowledge (constructivism). Reading Topic Related Term Related Term Reason Reason
  • 9. 6 Juxtapositioning Texts Summary: Juxtapositioning Texts is a technique that helps demonstrate multiple perspectives. The technique allows for a critical analysis of the issues presented in texts written from different perspectives. Students are presented the texts in various contexts (whole class, individual reading, small group) and are encouraged to consider how the narratives differ based upon the perspective of the writers. Students are asked to consider what information is included, and excluded from the texts, and why this might be. Juxtapositioning Texts provides students with a less subjective perspective on an issue, allowing them to see it from multiple angles. Students also learn the value of finding texts from different perspectives when investigating an issue. Diagram: Instructional Connection: Juxtapositioning Texts is useful when teaching mathematics. When looking at the Pythagorean theorem, there are a vast number of proofs. Introduce students to the traditional Pythagorean proof provided in the textbook. Next, prompt students to get into small groups, each group learns a different proof, and discusses the merits of learning the Pythagorean theorem with their assigned proof (area of triangle side squares, Pythagoras' Proof, Bhaskara's First Proof). Next, the class gets into new groups such that each of the new groups has a member representing each of the different proofs. Students debate which of the proofs is the best method for learning the Pythagorean theorem. Finally, each group reports back to the whole class by way of a nominated spokesperson, giving the group's findings. This strategy allows students to consider how different representations of the theorem might benefit students with different learning styles.
  • 10. 7 Write and Sketch in Math and Science Summary: Write and Sketch in Math and Science allows students to use both language and symbols to make their thinking about problem solving visible to themselves and others. For example, when a math problem is posed, students read or listen to the problem and paraphrase it. Then, they record their thinking about how to solve the problem on a paper that has been divided in half vertically. On the left side of the paper, students sketch a picture to solve a problem. On the right side of the paper, students use words to solve it. Diagram: Instructional Connection: Write and Sketch in Math and Science is useful when teaching mathematics. When looking at Angle of Elevation word problems, students must visualize the situation in order to solve the problem. Write and Sketch in Math and Science provides a framework for students drawing the parts of the word problem and generating the necessary triangle upon which the students apply the trigonometric equations. Students then describe their thinking process on the right side of the paper, giving themselves an opportunity to catch any flaws in their thinking. For example, "The angle of elevation from a sailboat to the top of a 121-foot lighthouse on the shore measures 16°. To the nearest foot, how far is the sailboat from shore?" The student would draw a picture of this scenario on the left side, and then explain their process on the right. Their explanation could be, “since I know an angle, the height of the side of the triangle opposite the angle, and want to know the length of the triangle adjacent to the angle, I will use the tangent property. Since the tangent of an angle is equal to the opposite side divided by the adjacent side, I will substitute the known values and solve for the adjacent side.” To solve this problem, first I drew a triangle to represent the ways in which the person either biked or walked from the start to the finishing point…
  • 11. 8 Be a Math or Science Author Summary: When students create their own math problems or science experiments, they are more interested and engaged. Designing written problems or experiments is an effective way to tap into students' personal experiences and bridge the gap between existing and new knowledge. In addition, practice in interpreting problems or experiments invented by peers, helps students better interpret more formal information presented in textbooks or by teachers. With the Be a Math or Science Author technique, students create problems to be solved by classmates. Problem topics are left open to the imagination of students, or directed by a topic currently being studied in math class. Diagram: Instructional Connection: Be a Math or Science Author is useful when teaching mathematics. When looking at Angle of Elevation, give students several examples of word problems to solve, and then they generate word problems that include content from their own lives. Examples might include finding the height of a local bridge, finding the distance to a far off location based upon the known height of a far off structure or mountain/tree. An example is "I know that tall building is 500 feet tall, and I can see with my clinometer that the angle of elevation is 20°. How far away is that building?" Students then share their word problems with a partner, and give each other feedback. Then, the whole class shares examples, and discusses difficulties.
  • 12. 9 Anticipation/Reaction Guide Summary: Students use an Anticipation/Reaction Guide to preview what they are about to read and to monitor their thinking while reading. Specifically, these guides activate prior knowledge, make connections to the text, set purposes for reading, and develop more accurate understandings of informational text. An Anticipation/Reaction Guide consists of several statements related to the text; the statements may or may not be true. Before reading, students indicate whether they agree or disagree with each statement and share their responses through partner, small-group, or whole-group discussion. After reading, students revisit the statements, decide whether their thinking has changed, and mark the statements accordingly. Then, the class discusses the guide again, and students explain any changes in their thinking that occurred. Diagram: Instructional Connection: An Anticipation/Reaction Guide is useful when teaching mathematics. When looking at the hierarchy of quadrilaterals, students are asked questions about the properties of squares, parallelograms, rhombi, rectangles, and trapezoids in the Anticipation/Reaction Guide. This includes statements like: "Squares are a type of rectangle." and "The angle measure of two consecutive interior angles in a parallelogram is 180°," and "A quadrilateral's diagonals bisect each other," and "Trapezoids are types of parallelograms." This serves as a first assessment. Then after reading the text, the class reviews and edits the list appropriately. T/F  Questions   T  Is  X  the  0irst...   F  Does  y  ...   Read  the  text...   Review  and  edit  the   answers  to  the  true/ false  questions.  
  • 13. 10 Semantic Map Summary: Teachers use Semantic Maps to activate prior knowledge, introduce content specific vocabulary, and organize information about a topic. When teaching students how to use this map, the teacher chooses a focus word, engages students in brainstorming, and creates a graphic organizer that features categories and details. Teachers use completed Semantic Maps to create summaries. Because the design of the Semantic Map depends on students' responses, the structure of each map is different. Students usually use Semantic Maps before and after reading either narrative or informational text. Diagram: Instructional Connection: A Semantic Map is useful when teaching mathematics. When looking at number sets, the teacher chooses the focus word "Number Sets.” Students brainstorm to consider Related Terms (rational, irrational, natural) and examples (1/2, pi, 432) and details (a rational number has one integer divided by another, irrationals have nonrepeating infinite decimals, natural numbers are integers starting with 1). Students read the informational text, rejoin the whole class, and edit the Symantec Map based upon what is in the text. Students add details like the Related Term “integer,” that this number set includes negative numbers and zero, and that an example is -432. Focus   Word   Related   Term  F   Related   Term  A   Related   Term  B   Related   Term  C   Related   Term  D   Related   Term  E   Example 1 Example 2 … Example 1 Example 2 … Example 1 Example 2 … Example 1 Example 2 … Example 1 Example 2 … Example 1 Example 2 …
  • 14. 11 Question-Answer Relationship Summary: Question-Answer Relationship (QAR) is a teaching idea that helps students understand how to self-question. Students learn that there are two information sources: text (In the book) and prior knowledge (In my head). Within each information source, there are two Question-Answer Relationships. This teaching idea helps students focus on the information source needed to answer a question. QAR is used when reading narrative and expository text. Give students a list of questions that are each categorized as one of the four QAR methods below. Students then read the text, and attempt to answer the questions using the method indicated. Diagram: Instructional Connection: QAR is useful when teaching mathematics. When looking at geometry, ask students questions from each of the four methods. For example, for 'Right There,' ask students, "What is a property of two consecutive interior angles of a parallelogram?" For 'Think and Search,' ask students, "What is a general formula which can be used to calculate the area of any regular polygon?" For 'On My Own' ask students, "What kind of career might you imagine doing where this knowledge would be useful?" For 'Author and Me' ask students, "When finding the area of a regular polygon, do you think it is better to use the equations which break the polygons into triangles, or the equations which are specific to each type of polygon? Justify your answer."
  • 15. 12 I Wonder Summary: "I wonder…" statements are designed to encourage students to generate questions and to provide a model for active thinking during the reading process. These statements can be used with either narrative or informational text, before, during, and after reading. "I wonder…" statements are shared orally, through sketching, or in writing. One engaging way to use the strategy is by students writing their "I wonder…" statements on a bookmark that they place in the book they are wondering about. Diagram: Instructional Connection: I Wonder is useful when teaching mathematics. When looking at right triangles, prior to reading the text, students suggest "I wonder …" statements. The teacher places a list on the board. Possible statements are "I wonder why are right triangles used more than other triangles in man-made objects?" and "I wonder how long ago society discovered the properties of right triangles?" Then, after learning about right triangles, the class considers whether the text has brought clarity to the "I wonder" statements.
  • 16. 13 Paired Questioning Summary: In Paired Questioning, students engage in actively generating questions during reading. Paired Questioning is a self-questioning reading comprehension strategy that involves generating questions in order to guide thinking. While reading segments of the text, students take turns generating text related questions and responding to them. When students finish, one partner summarizes the important ideas in the text, and the other agrees or disagrees and justifies his or her thinking. Diagram: Instructional Connection: Paired Questioning is useful when teaching mathematics. When looking at the "Building Blocks of Geometry," students take turns reading the associated text in pairs, and ask each other questions about the text between each section. Examples are: "What is a physical model of a point/line/plane?" and "What does collinear/coplanar mean?" and "What geometrical figure has endpoints?" Then, one student summarizes the text, and the other student agrees or disagrees, and justifies their response. An example of a summary is "The building blocks of geometry are the simple structures (points, lines, planes) that we combine to create more complex shapes. We also use terms to describe how these structures relate to one another (collinear, parallel, intersect).” ???!!! ??? !!!
  • 17. 14 Bookmark Technique Summary: Readers use the Bookmark Technique to monitor their comprehension while reading, and make evaluative judgments about aspects of the text. This technique is used with narrative and expository text, and works well with both in-class reading and homework assignments. The Bookmark Technique is a reading comprehension strategy that involves readers constantly asking themselves, "Does this make sense?" Teachers distribute the four bookmarks (depicted below), explain the Bookmark Technique, introduce the text, guide students on how to use the bookmarks, and then students practice on their own. Diagram: Instructional Connection: The Bookmark Technique is useful when teaching mathematics. Before students read about the mathematical concept of midpoint, hand out the four bookmarks, and describe the topic and how to use the bookmarks while reading. Read a section of the text with the whole class, and complete the first bookmark. For example, "The part I found most interesting was ancient mapmakers. I thought it was interesting because ancient mapmakers around the globe used the concept of midpoint to help them create navigational maps." Then, students complete the final three bookmarks on their own. An example for Bookmark 4 is "The visual that helped me understand the reading was the midpoint drawn on the xy-plane." An example for Bookmark 2 is "Something that confused me was how to find a midpoint from two coordinates. The reason it confused me is I didn't understand why the formula results in a midpoint."
  • 18. 15 Questions into Paragraphs (QuIP) Summary: Questions into Paragraphs (QuIP) is a reading strategy that involves extracting essential information from text. QuIP provides a framework for initiating research, structuring writing, and summarizing. Students choose a topic and develop three related research questions. Then, they respond to each question from two sources. When the graphic organizer is complete, students use the information to write a paragraph. Students use QuIP before reading (generating questions), during reading (reading the information provided by the two sources), and after reading (writing the summary). Diagram: QuIP Research Grid Topic:__________________ Questions Answers QuIP Paragraph Source 1: Source 2: A. B. C. Instructional Connection: QuIP is useful when teaching mathematics. When looking at regular polygons, students ask questions like "What properties are the same for all regular polygons?" and "What makes a regular polygon 'regular'?" and "How do I find the area of a regular polygon?" Then, the teacher gives students a text about regular polygons, access to the Internet, and URLs of some math sites. Students gather relevant information from these sources, place them on the research grid, and subsequently writes a paragraph summarizing their findings. An example of part of a summary is, "Regular polygons have congruent sides, and congruent interior angles.”
  • 19. 16 Venn Diagram Summary: The Venn Diagram is named for its creator, John Venn, who used it to express thoughts about logic. The diagram, which is represented by two interlocking circles, provides a format for us to note similarities and differences or two perspectives about a topic. The similarities appear in the overlapping sections of the circles; the differences appear in the outer sides of each circle. Students use Venn Diagrams as an evaluative comprehension strategy that involves making judgments while reading. Students read some text that describes two different perspectives or similarities and differences about a topic. Students label each circle (each one being a perspective or one of two things a student is comparing). Students then place common characteristics in the overlapping section, and non-common characteristics to the left or to the right of the overlapping section. Diagram: Instructional Connection: Venn Diagrams are useful when teaching mathematics. When looking at multiples, students generate a Venn diagram with the concepts of "multiples of two" and "multiples of three." Students then generate multiples of these kinds (2: [2,4,6,8,10,12]; 3:[3,6,9,12]), and place them in the appropriate locations on the diagram (2:[2,4,8,10], Both:[6,12], 3:[3,9]). Students then repeat the process with different multiples ("multiples of four", "multiples of five"). This process makes the concept of multiples less abstract by placing the relationships visually on a page. Concept  1     Unique   Aspects   Concept  2     Unique   Aspects   Aspects Similar to Both
  • 20. 17 Semantic Question Map Summary: The Semantic Question Map is a form of previewing; a comprehension strategy that includes activating background knowledge, setting purposes for reading, and predicting what comes next based upon what was read. The Semantic Question Map is a variation on the Semantic Map, but its general design is fixed. The Teacher places a focus word on the board, and then raises several questions about it. The Teacher places the questions, which may be provided by the teacher or generated by the students, inside the ovals that extend from the focus word. Teachers use Semantic Question Maps when they want students to focus on particular aspects of the topic. Diagram: Instructional Connection: The Semantic Question Map is useful when teaching mathematics. When looking at parallel lines in geometry, the teacher assigns "parallel lines" as the focus word, and prompts students to ask questions. Students may ask, "What shapes have parallel lines?" and "How can parallel lines in a shape help us figure out things about the shape?" and "What defines parallel lines?" Students try to answer these questions with what knowledge they already have. Students read a text on parallel lines, and revisit their responses to the questions. This process prepares students' minds to look for information regarding the focus word while reading. It also engages the reader as an active participant in the reading process. Focus WordQuestion 4 Question 3 Question 1 Question 2
  • 21. 18 Concept of Definition Map Summary: The Concept of Definition Map is designed to help students construct meaning by making connections between their prior knowledge and new topics. It provides information such as a definition, a description, and examples. This graphic is used before, during, and after reading. When the map is completed, the class creates a Concept of Definition Map summary. When teaching summarizing, ask students to extract important information from the text. Students, however, often struggle in determining which information is important. Therefore, creating a summary based on the Concept of Definition Map provides students with the opportunity to use the important information. In the process, students learn that the important information includes components of the Map. Diagram: Instructional Connection: A Concept of Definition Map is useful when teaching mathematics. When looking at algebraic properties, the teacher starts by brainstorming with the students what the term means (rules for manipulating algebraic expressions), ideas connected to the term (commutative, associative, distributed), and examples (see above). The teacher completes a Concept of Definition Map on the board, and instructs students to do so in their notes. Then, students read the text related to algebraic properties. The teacher instructs students to be on the lookout for the information to complete the Map. After students read the text, the class edits the Map together with the new information. In this case the students add the example of commutative addition, "6a + 5 = 5 + 6a.” Focus  Word:     Algebraic   Properties   Commutative Distributive Multiplication: 2x(6 + y) = 12x + 2xy Distributive Associative Rules Associative Addition: (4x + 2x) + 7x = 4x + (2x + 7x) Commutative Addition: 6a + 5 = 5 + 6a What are they? What are some examples?
  • 22. 19 Semantic Feature Analysis Chart Summary: The Semantic Feature Analysis Chart is a graphic organizer that helps students make predictions about attributes related to specific words, sort by characteristics, and set a purpose for reading or researching. Semantic Feature Analysis Charts help students monitor their thinking and learn about words. Students use Semantic Feature Analysis Charts to compare and contrast the characteristics or qualities of multiple items or types of people. Students use this chart before they read to activate background knowledge, and after they read to add information and/or draw conclusions. Diagram: Characteristics Categories Parallel Sides All Right Angles Complementary Consecutive Angles Congruent Opposite Angles Congruent Opposite Sides Area = b·h Squares ✔ ✔ ✔ ✔ ✔ ✔ Circles ! ! ! ! ! ! Parallelograms ✔ ! ✔ ✔ ✔ ✔ Rhombi ✔ ! ✔ ✔ ✔ ✔ Triangles ! ! ! ! ! ! Rectangles ✔ ✔ ✔ ✔ ✔ ✔ ✔ = Yes ! = No ? = Don't know Instructional Connection: The Semantic Feature Analysis Chart is useful when teaching mathematics. When looking at properties of two-dimensional shapes, the teacher starts by brainstorming with the students the different kinds of two-dimensional shapes, different characteristics to compare, and whether each one of the shapes has these characteristics (see above). The teacher completes a Semantic Feature Analysis Chart on the board, and instructs students to do so in their notes. Then, students read text related to the characteristics of two-dimensional shapes. The teacher instructs students to be on the lookout for the information to complete the chart. After students read the text, the class edits the chart together with the new information.
  • 23. 20 I.N.S.E.R.T Summary: The Interactive Notation System to Effective Reading and Thinking method (INSERT) is a reading comprehension strategy that involves constantly asking, "Does this make sense?" and adapting strategic processes to make the message clear. Students brainstorm what they know about the topic, read the text, and insert four symbols as they read. Students place a checkmark in the margin if the information verifies what is on their brainstorming list. Students place a plus symbol if it is new information. Students place a minus symbol if the information contradicts what is on their list. Students place a question mark if the information is something that is confusing. After placing the symbol, students write their observations on one of four bookmarks. Diagram: Instructional Connection: INSERT is useful when teaching mathematics. When looking at the properties of a polygon, the teacher has students brainstorm what they know about polygons (perhaps that they are two-dimensional and enclose a space). Then, students break up into pairs, and take turns reading paragraphs to each other. Students pause between paragraphs and decide together which symbols to place in the text, and what information to place on the bookmarks. In addition to confirming what they learned in the brainstorm, they might also learn that polygons have straight sides and can fit into the categories of equiangular, and equilateral (+ Bookmark). They may have questions about the term vertex, regular polygon, and n-gon (? Bookmark). They may also discover properties that they were mistaken about when brainstorming (- Bookmark).
  • 24. 21 List-Group-Label Summary: Students use List-Group-Label to preview and monitor information presented in informational text. This teaching idea is used before and after reading to activate background knowledge and to help students become familiar with how selected words relate to a concept and to other words. Students brainstorm around a "cue term," coming up with related words and grouping some into clusters. Students then read the text, and refine their list. Diagram: Cue Term: ________________ Before reading: Brainstormed words and clusters Cluster I Related Word 1 Related Word 2 … Cluster II Related Word 1 Related Word 2 … Cluster III Related Word 1 Related Word 2 … Instructional Connection: List-Group-Label is useful when teaching mathematics. When looking at simple mathematical operations, the class brainstorms words used to describe basic mathematical operations. For example: subtract, sum, divided by, minus, equals, increased by, multiple, difference, take away, and add. The teacher writes this list on the board. Then, the class decides how to group the terms into clusters (addition, subtraction, multiplication, division, equals). Then, students read the text on mathematical operations. Finally, the class regroups to contribute more words/clusters to the list. Example words to add are: more, together, combined, decreased by, tripled, twice, quotient, ratio, out of, totals, and is. By completing this list and categorizing all the words, students become familiar with the different ways mathematical operations can be referred to in narrative text. The exercise also helps students categorize the terms, and to easily see what other terms imply the same operation.
  • 25. 22 Think-Aloud Summary: Think-Alouds help scaffold learning for students. The teacher selects a passage to read aloud to the students. The passage should require some strategic thinking to clarify understandings. Explain that Think-Alouds model strategic behavior and thoughts in the reading process. Prior to reading, the teacher describes connections they can make to the text. Then, as the teacher reads, they think aloud to demonstrate monitoring, visualizing, and summarizing. Students then break up into pairs and practice this technique with each other. Diagram: Instructional Connection: Think-Alouds are useful when teaching mathematics. Let us look at the word problem "Rachelle's school photo package includes one large photo and several smaller photos. The large photo is similar to the small photo. The small photo is 2 inches long and 1.5 inches wide. If the height of the large photo is 10 inches, what is the width?" The teacher reads this problem to the students. The teacher pauses on the phrase "similar to the small photo," and says, "I recall that similar objects have proportional measurements." After reading the third sentence, the teacher says, "I notice there are two related numbers in the sentence, maybe this is the ratio statement? I also notice the terms 'long' and 'wide', which might be used to label a proportion box." After finishing reading the problem, the teacher says, "Since I suspect this is a proportion problem, even though I am not sure what the answer might be, I am going to draw a proportion box and label it to get me started." Since I did not understand this passage, I am going to reread it. ?!?!?!
  • 26. 23 Content Area Inventory Summary: In Content Area Inventories, students record their thoughts about content-related topics. Content Area Inventories promote reflection and provide students with an opportunity to express their feelings and share their prior knowledge about the content area they are studying. Teachers then alter their lesson plans to better engage their students. Diagram: The best thing about [the math topic I am studying] is… The worst thing about [the math topic I am studying] is… One way that I use mathematics outside of school is… My favorite part of mathematics class is… In math class, I like to work in groups so that I… In math class, I like to work… When I finish a math problem from class, I feel… When I use the math I learned in this class, I am proud of… Regarding [this math topic], I wish I knew more about… Instructional Connection: Content Area Inventories are useful when teaching mathematics. When looking at percentage ratio word problems, an example student response is, "The worst thing about percentage ratio problems is knowing where to put numbers in a proportioned box. My favorite part of mathematics class is when I figure out a problem before others do. I like to work in groups so that I can see how other students think about a problem. I wish I knew more about how to label my proportion boxes." Teachers examine the responses from their students, and look for trends. Assuming the previous example was a typical response, the teacher responds by reviewing with the class how to determine where to put labels when constructing a proportion box. The teacher pays attention to how students answered the "I like to work…" question, to design the learning environment in a way most conducive to learning.
  • 27. 24 Content History Summary: Content History invites students to contemplate previous experiences in a content area. For students, it promotes reflection, helps make connections between past and present day experiences, and cultivates self-understanding. For teachers, it provides insights into students' previous learning experiences that can be used to foster motivation and informal planning. Diagram: These prompts are offered to help create a math history. A math history details your mathematical development from earliest memory to now. These prompts are intended only to stimulate your thinking. Include any information you would like to make your history meaningful. 1. What is your earliest math memory? 2. Can you recall how or if you used numbers before you entered school? 3. Can you recall experiences from your math education in elementary? 4. Do you remember a person or activity that helped you learn about math? 5. What is one thing you would change about your math experiences? 6. Do you recall any ways you used math outside of school? 7. Do you feel comfortable using math now? Why? Why not? 8. Did you enjoy math in any particular grade? Why? Why not? 9. Offer advice to students just beginning to study math. 10. Name two ways you will use math after you graduate. Instructional Connection: Content History is useful when teaching mathematics. When looking at the first day of a high school ninth grade geometry class, students fill out Content Histories. Example responses being, "I was transferred from Hudson Wisconsin two years ago, and some of the math they were doing here did not make sense." Or, "I did well in math, except for in fifth grade." A teacher receiving these responses alters the way they deliver lessons. The teacher realizes that the student who transferred has holes in their mathematical exposure due to the Common Core being different than Minnesota standards. Particularly, if the student who transferred from Wisconsin did so between 6th and 7th grades, they have missed content related to angles and geometric figures, which Minnesota does in 6th grade, but Wisconsin does not do until 7th. The teacher would also look at the math content the other student missed in 5th grade (properties of three-dimensional figures, areas of triangles and quadrilaterals, surface area, and volumes of rectangular prisms). This information would inform the teacher about what content they need to more carefully review, and the need for some supports for specific students.
  • 28. 25 Admit Slips Summary: Admit Slips are used to assess prior knowledge when preparing to teach about a topic, or assess student understanding of a topic about to be taught. When completing an Admit Slip, students reflect on what they know about a particular topic. Students can write their responses on a graphic organizer or on an index card. On the first side, students write what they already know about a topic; on the second side, they write a question they have about that topic. Teachers collect the slips before formally beginning class. Reading the slips allows teachers to respond in the next class to questions. Diagram: Instructional Connection: Admit Slips are useful when teaching mathematics. When beginning a unit on trigonometry, some example "already know" response are: "… that trigonometry has to do with triangles." and "… that trigonometry has to do with circles." and "… that it has something to do with soaking your feet in the river." Some example questions are: "When does anyone use trigonometry in real life?" and "Who invented trigonometry?" Given these responses, the next day the teacher verifies that trigonometry does indeed have to do with circles and triangles. The teacher verifies that there is a trigonometric mnemonic called SOHCAHTOA ("Soak a Toe-uh"), but that you do not actually have to put your feet in a river. The teacher would also talk about how trigonometry is used in the real world (astronomy, land surveying, oceanography, architecture, navigation, and studying light and sound waves), and the history of its discovery (Egypt, Iraq, and Greece). What I already know about this topic… ------------------------ A question I have about this topic is…
  • 29. 26 Tickets Out Summary: Tickets Out ask students to reflect on what they learned that day, and what questions they have about it. The students’ responses to what they have learned are recorded on the front of the graphic organizer, and any questions they may have are written on the back. Teachers collect the tickets as they stand at the door at the end of class. Teachers use these to determine what questions they should address the next class period. Diagram: Instructional Connection: Tickets Out are useful when teaching mathematics. When looking at properties of polygons, some example ‘What did I learn’ responses are, "…that diagonals connect to opposite vertices of a polygon," and "…that geometry is really boring." Some example ‘A question I have’ responses are, "Do I have to memorize a new area equation for every polygon?" and "Why should I care about polygons?" The teacher addresses these issues the next day. Given the previous responses, the teacher attempts to make the content more engaging and entertaining to address students being bored (using manipulatives, polygon art-project, educational polygon videogame). The teacher clarifies that a diagonal connects two nonconsecutive vertices. The teacher lets the students know that they need not learn new area formulas for each polygon, but that there are shortcuts for regular polygons (involving dividing the polygon up into triangles and using the triangle area formula). The teacher also gives examples of the types of careers students might pursue, where this type of knowledge is useful (art, architecture, engineering, physics, videogame programmers). What did I learn today? ------------------------ A question I have about what I learned…
  • 30. 27 Internet Workshop Summary: Internet Workshop is especially useful for introducing students to websites for an upcoming unit and developing background knowledge. During such a workshop, students work individually, in collaboration with classmates, or in conjunction with international peers. Steps often include: students locating websites, developing an activity related to class learning goals, recording information in an electronic journal, and continued periodic workshop sessions. Internet Workshop is an effective way to help expand students' understanding of the topic being studied. Diagram: Instructional Connection: Internet Workshop is useful when teaching mathematics. When looking at geometric transformations, begin the unit by explaining to the students that are going to visit a computer lab. On an overhead, show them how to create a Khan Academy website account (khanacademy.org/signup). Show them how the website is used to study every area of math, and how it to supplement any math class they are in. Explain that in this unit, students learn about geometric transformations. Give them handouts with this information, and bring them to the computer lab. Students register an account, and begin the online unit "Axis of Symmetry." In this online unit, students watch videos, take online quizzes, and earn points/badges for their efforts. The class visits the lab every Friday. Students complete "Exploring Rigid Transformations," "Dilations or scaling around a point," and "Transformations on the coordinate plane." As an assessment, the teacher tracks each student's online score total and badge tally. New Unit Jumpstart
  • 31. 28 Gallery Images Summary: Gallery Images is a visualizing reading comprehension strategy that involves students creating mental images of the text as they read. Gallery Images help us to create visualizations while reading and provide a format for sharing our mental images. This technique is usually used after reading informational text. Students use this technique by sketching images as they read content area text. They write a description for each image, share their images with a partner or group, and discuss their different visualizations. Diagram: Instructional Connection: Gallery Images are useful when teaching mathematics. When looking at the Law of Sines, students read a problem individually, “Jack is on one side of a 200-foot-wide canyon and Jill is on the other. Jack and Jill can both see the trail guide at an angle of depression of 60 degrees. How far are they from the trail guide?" Then, students attempt to draw a diagram representing the scenario (triangle with 200 foot top length). Students then write a sentence or two indicating what type of mathematical tools one might need to tackle the problem (interior angle sum of a triangle, properties of triangles). Next, they compare their drawing to the drawings of other students at their table before working with their tablemates to answer the question. When they subtract the two 60° angles (depressions) from 180° (interior angle sum), they learned that the last angle is also 60°. They then realize the triangle is equilateral; so all the side lengths are equal. Therefore, the side lengths that represent the distance from Jack or Jill to the trail guide are also 200 feet.