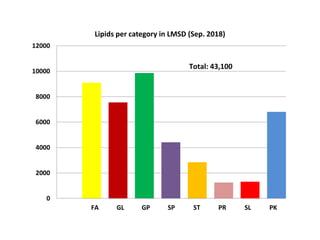
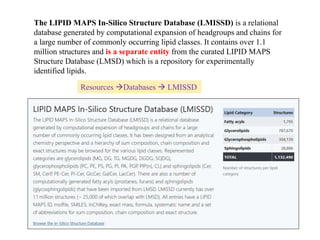
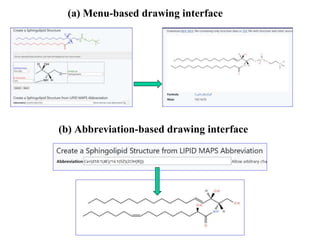
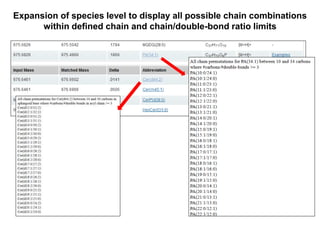
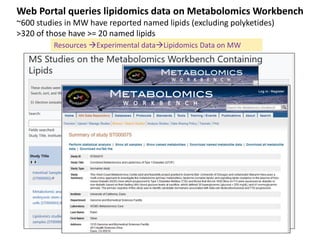
LIPID MAPS Lipidomics Gateway Workshop
Eoin Fahy
University of California San Diego
Leipzig, Sept. 26th 2018
Funded by Wellcome Trust
LIPID MAPS Lipidomics Gateway
https://www.lipidmaps.org
Now hosted in the U.K. (Babraham Institute)
Formerly located at the University of California San Diego from 2003-2018
LIPID MAPS Lipidomics Gateway
Lipids may be broadly defined as hydrophobic or
amphiphilic small molecules that originate entirely or
in part from two distinct types of biochemical
subunits or "building blocks": ketoacyl and isoprene
groups. Using this approach, lipids may be divided
into eight categories : fatty acyls, glycerolipids,
,glycerophospholipids, sphingolipids, saccharolipids
and polyketides (derived from condensation of
ketoacyl subunits); and sterol lipids and prenol lipids
(derived from condensation of isoprene subunits).
* Fahy,E. et al, Journal of Lipid Research, Vol. 46, 839-862, May 2005
Definition of a lipid*
Fundamental biosynthetic units of lipids
LIPID MAPS Classification System
Categories and Examples
Category Abbreviation Example
Fatty acyls FA Dodecanoic acid
Glycerolipids GL 1-hexadecanoyl-2-(9Z-octadecenoyl)-sn-
glycerol
Glycerophospholipids GP 1-hexadecanoyl-2-(9Z-octadecenoyl)-sn-
glycero-3-phosphocholine
Sphingolipids SP N-(tetradecanoyl)-sphing-4-enine
Sterol lipids ST Cholest-5-en-3b-ol
Prenol lipids PR 2E,6E-farnesol
Saccharolipids SL UDP-3-O-(3R-hydroxy-tetradecanoyl)-aD-
N-acetylglucosamine
Polyketides PK Aflatoxin B1
Category Abbrev Example
Fatty Acyls
Glycerolipids
Glycerophospholipids
Sphingolipids
Sterol Lipids
Prenol Lipids
Saccharolipids
Polyketides
FA
GL
GP
SP
ST
PR
SL
PK
Arachidonic acid
1-hexadecanoyl-sn-glycerol
1-hexadecanoyl-2-(9Z-octadecenoyl)-
sn-glycero-3-phosphocholine
Sphingosine
Cholesterol
Retinol
Kdo2-lipid A
epothilone D
Name: PGE2
LM_ID: LMFA03010003
LM_ID description:
Database: LM (LIPID MAPS)
Category: FA (Fatty Acyls)
Main Class: 03 (Eicosanoids)
Sub Class: 01 (Prostaglandins)
Unique identifier within a sub class: 0003
LIPID MAPS Lipid classification system
LMSD: LIPID MAPS Structure Database
Over 43,000 classified structures as of 9/20/2018
Full structures in multiple formats, exact mass and inline m/z features
Relevant database cross references, InChIKey values for each structure
Calculated physicochemical properties added for each structure
Links to internal/external MS data
Ongoing screening of major lipid-related journals
Curation
LIPID MAPS
structure
database
(LMSD)
Structures from core
labs and partners
New structures
identified by LIPID
MAPS experiments
Websites,
Publications
Public databases
Computationally
generated structures
Curation
Composition and curation of the LMSD
0
2000
4000
6000
8000
10000
12000
FA GL GP SP ST PR SL PK
Lipids per category in LMSD (Sep. 2018)
Total: 43,100
LMSD: LIPID MAPS Structure Database
Resources Databases
Search LMSD by browsing classification hierarchy
Resources Classification
Search LMSD by browsing classification hierarchy
Resources Classification
LMSD Detail view for a lipid structure
Lipid classification
LM_ID
m/z calculation tool
Database cross-references
Names, synonyms
InChiKey identifier
MS/MS spectra
Physicochemical properties
Download structure
Structure
SMILES
m/z for selected
ion type/adduct
Isotopic distribution profile
LMSD detail page: m/z calculator
Use InChIKey to find structures differing only in stereochemistry,
double-bond geometry or isotopic labeling
Use InChIKey (full or partial) to perform a Google structure search
LIPID MAPS
European Bioinformatics
Inst.
PubChem
Plant FattyAcid db
Linking LMSD to other structure databases and resources
PubChem
ChEBI
SwissLipids HMDB
LipidBank
Resources Databases -> Text/ontology or Structure search
Search LMSD by structure, text, mass, formula ,ontology
Resources Databases -> Text/ontology
Search LMSD by ontology
Querying Lipidomics Gateway website as well as
LIPID MAPS databases via “Quick search”
Multi-purpose
Small “footprint”
High visibility (on home page)
Search the Lipidomics Gateway html pages
by keyword, or the databases by lipid class,
common name, systematic name or
synonym, mass, formula, InChIKey, LIPID
MAPS ID, gene or protein term.
Linking MS spectra to lipid structures in detail view
(a) Curated and annotated MS/MS spectra of lipid standards contributed by
LIPID MAPS core labs
(b) Links to Massbank spectra (via Massbank of North America (MoNA)
repository at UC Davis. Contains both experimentally obtained and
predicted (LipidBlast) spectra
(c) Predicted MS/MS spectra for selected lipid classes using LIPID MAPS
algorithms
Linking MS spectra to lipid structures in detail view
(a) Curated and annotated MS/MS spectra of lipid standards contributed by
LIPID MAPS core labs
(b) Links to Massbank spectra (via Massbank of North America (MoNA)
repository at UC Davis. Contains both experimentally obtained and
predicted (LipidBlast) spectra
(c) Predicted MS/MS spectra for selected lipid classes using LIPID MAPS
algorithms (Covers glycerolipids, phospholipids and ceramides)
Source # of Lipids in LMSD Total # of Spectra Comments
Lipid Standards 443 557 Curated/annotated by
LIPID MAPS core labs
Massbank (MoNA) 7,304 21,097 ~14,000 are predicted
~7,000 are experimental
LM Predicted spectra 15,179 15,179 MG/DG/TG
PA/PC/PE/PG/PS/PI
Cer
The LIPID MAPS In-Silico Structure Database (LMISSD) is a relational
database generated by computational expansion of headgroups and chains for
a large number of commonly occurring lipid classes. It contains over 1.1
million structures and is a separate entity from the curated LIPID MAPS
Structure Database (LMSD) which is a repository for experimentally
identified lipids.
Resources Databases  LMISSD
Navigating the hierarchy
Lipid MAPS Gene/Proteome Database (LMPD)
Resources Databases  LMPD
LMPD:Data collection strategy
Entrez Gene ID list
Lipid-related keywords in gene
names, metabolic pathways and
ontology terms
Manual curation
NCBI Entrez UniProt
Python
program
Gene, mRNA, protein data, PTM variants, motifs, homologs, cross-
references, related proteins, ontologies, annotations, etc.
LMPD database
Entrez Gene ID (DNA/genomic links)
RefSeq mRNA ID’s (both coding and UTR variants)
RefSeq protein ID’s and sequences (unique isoforms)
Post–translationally modified variants (e.g. apo-, mature
forms, leader sequences, etc.)
LMPD organization:
Gene-> mRNA-> (apo)protein -> mature protein
LMPD query page
Resources Databases  LMPD Search LMPD
LMPD overview page: listing of annotations and isoforms
LIPID MAPS: Recommendations for drawing structures
Consistent structure representation across classes
Fatty Acyls(FA)
Sterol Lipids (ST)
Glycerophospholipids (GP)
Sphingolipids (SP)
Prenol Lipids (PR)
Glycerolipids (GL)
Structural comparison of SM and PC
Resources ToolsStructure Drawing
Online drawing tools for various lipid categories (FA,GL,GP,SP,ST)
Drawing lipid structures
(a) Menu-based drawing interface
(b) Abbreviation-based drawing interface
(c) REST service
Resources REST service
53 different lipid classes with
examples and explanation of the
abbreviation syntax
Online generation of glycan structures in full chair conformation
Sugars
Glc
Gal
GlcNAc
GalNac
Xyl
Fuc
Man
NeuAc
NeuGc
KDN
Anomeric Carbon
a or b linkages may
be specified
Resources ToolsStructure DrawingGlcans
Resources Tools  MS analysis
Mass spectrometry tools
Resources Tools  MS analysis
Mass spectrometry tools
Calculate the exact mass of a lipid
(Display structure (save as molfile) and isotopic distribution profile)
Covers glycerolipids, phospholipids, sphingolipids, fatty acids, wax esters,
acylcarnitines, acyl CoA’s, cardiolipins and cholesteryl esters
Resources Tools  MS analysisMultiple lipid classesCalculate exact mass..
Enumeration of “bulk” lipid species from
selected lists of acyl/alkyl chains
Glycerolipids
Phospholipids
Sphingolipids
Fatty acids
Chol. esters
Acyl CoA’s
Acyl carnitines
Cardiolipins
Suite of combinatorial expansion tools
Database of lipid
“bulk” species,
exact masses,
formulae,
annotations
Wax esters
Creation of a virtual lipid database
Choice of range of acyl/alkyl chains
These are used to create “bulk” species e.g. PC(38:4), PE(O-36:0), Cer(d32:1), HexCer(d40:2),
TG(54:2), DG(32:0), FA(20:3(OH)), CE(18:1)
Conservative approach: stereochemistry, sn (glycerol) position, double bond/functional group
regiochemistry, double bond geometry not defined.
Links to: On-demand expansion of all possible chain combinations (within defined limits)
Links to: Matches of bulk species to discrete structures in LMSD database (examples)
Virtual database of bulk lipids: number of entries per class
Monoradylglycerols 84 Fatty acids 13590
Diradylglycerols 615 Acyl carnitines 78
Triradylglycerols 1844 Chol. Esters 78
Digalactosyl DG's 553 Acyl CoA's 78
Monogalactosyl DG's 553 Wax esters 403
Sulfoquinovosyl DG's 553
Ceramides 258
PA 1308 Ceramide phosphates 258
PC 1308 PE-Ceramides 230
PE 1308 PI-Ceramides 230
PG 1308 Mannosyl-di-IP-ceramides 258
PI 1308 Mannosyl-IP-ceramides 258
PIP 1308 Hexosyl ceramides 258
PS 1308 Lactosyl ceramides 258
Cardiolipins 375 Sphingomyelins 258
Sulfatides 258
Precursor ion search interface to virtual database
Input: Either copy/paste a list of precursor ions or upload a peaklist file
Input parameters: Mass tolerance, ion type, all chains or even chains, sort results
Optionally restrict search to one or multiple lipid species
Resources Tools  MS analysisMultiple lipid classesSearch Comp DB/LMSD
Results page for precursor ion search
Output: view in online format (below) or as tab-delimited text file
Output features: Sub-table for each input ion.
Links: On-demand expansion of all possible chain combinations (abbreviation)
Links: Matches of bulk species to discrete structures in LMSD database (examples)
Expansion of species level to display all possible chain combinations
within defined chain and chain/double-bond ratio limits
Links to examples of discrete structures in LMSD database with the
identical bulk structure
*This feature was
implemented by computing
the “bulk” abbreviation
(where possible) for every
structure in the LMSD
database
Resources Tools  MS analysisGlycerophospholipids
Computationally-generated database
of oxidized phospholipids
67 different oxidized chain species at sn2 position derived from C18,C20 and C22 precursors
Resources Tools  MS analysis  Glycerophospholipids
Computationally-generated database
of oxidized phospholipids
Match MS/MS data vs Glycosylceramide in-silico database
Searches computationally generated database of 400 different headgroups, 45 different sphingoid
bases and 52 different N-acyl chains
Resources Tools  MS analysisSphingolipids
Predict Glycerophopholipid MS/MS product ions for a molecule of interest
Resources Tools  MS analysisGlycerophospholipids
Predict Glycerophospholipid MS/MS product ions for a molecule of interest
LipidFinder: A computational workflow for discovery of lipids
In high-resolution LC/MS datasets
Resources Tools  MS analysis Multiple classes
LipidFinder on LIPID MAPS: peak filtering, MS searching and statistical analysis for lipidomics
Eoin Fahy, Jorge Alvarez-Jarreta, Christopher J Brasher, An Nguyen, Jade I Hawksworth,
Patricia Rodrigues, Sven Meckelmann, Stuart M Allen, Valerie B O'Donnell
https://doi.org/10.1093/bioinformatics/bty679
Test samples
UPLC/LCMS
XCMS
Peak Filtering
MS searching
Lipid classification
Results
LIPIDFINDER
Statistical analysis of
experimental groups
Refined peaklist of
significantly altered features
(Large peaklist)
(smaller peaklist)
Perform statistical analysis (Volcano plot, OP-PLSDA,
Random-forest, ANOVA analysis) based on experimental
groups (factors) to identify significantly up/down
regulated features.
Run MS search on this (much smaller) selected peaklist
to focus on the biologically significant features
LipidFinder: A computational workflow for discovery of lipids
In high-resolution LC/MS datasets
MS Standards library
Resources Standards
Resources Experimental data
Experimental data on LIPID MAPS
All studies on Metabolomics Workbench (65% are lipids)
~1000 experimental studies reporting ~180,000 metabolite species
~150,000 of these metabolite species were mapped to RefMet classification
RefMet Metabolite Classification and indexing
RefMet database with indexed metabolite classification
LIPID MAPS
Classification
Lipids Non-lipids
ClassyFire
Classification
Uncurated classes
Curation,
Indexing
Indexing
Indexing of metabolite classes/subclasses facilitates logical ordering of data
Web Portal queries lipidomics data on Metabolomics Workbench
~600 studies in MW have reported named lipids (excluding polyketides)
>320 of those have >= 20 named lipids
Resources Experimental dataLipidomics Data on MW
Tools for Statistical analysis
Resources Tools  Statistical analysis
Metabolomics
Workbench
Portable analysis
toolbox codebase
(R files, PHP, Javascript)
+ configuration file
R statistics
application
+
Libraries
User interfaces
Portable lipidomics analysis toolbox design
REST service
obtains RefMet
classification data
Results
Resources Tools  Statistical analysis
Tools for Statistical analysis: output
Tools for Statistical analysis: Map names to RefMet
Tools for Statistical analysis: Classified names
Volcano plot: pairwise comparison of 2 experimental conditions
P-value on y axis
Classes order by classification index on x axis
Size of colored circles represents
# of (significant) metabolites per class
with p-value and fold change
exceeding selected cutoff values
Size of gray circles represents
# of all reported
metabolites per class
Color of circles represents fold change value
red:group2/group1 >1 (upregulated)
green:group2/group1<1 (downregulated)
Mouse over bubble to view
# of metabolites per class
Bubble plot display of Volcano plot data
Comparing Diabetic and control mice
Crohn’s disease vs controls
Volcano plot/class enrichment Publication: pathway enrichment
Crohn’s disease vs controls
Volcano plot/Bargraph by class Publication: Bargraph by pathway
Under development at LIPID MAPS
Protocols section
Sample prep/MS analysis methods
By lipid category
Pathways section
Update and migration to
WikiPathways format
Acknowledgements
Cardiff University
Valerie O’Donnell (PI)
Caroline Jeffs
Jorge Alvarez-Jarreta
Maria Valdivia
Robert Andrews
Babraham Institute
Michael Wakelam(PI)
Simon Andrews
An Nguyen
University of California San Diego
Shankar Subramaniam (PI)
Edward Dennis (PI)
Dawn Cotter
Funded by Wellcome Trust

LIPID_MAPS_Leipzig_2018.pptx

  • 1.
    LIPID MAPS LipidomicsGateway Workshop Eoin Fahy University of California San Diego Leipzig, Sept. 26th 2018 Funded by Wellcome Trust
  • 2.
    LIPID MAPS LipidomicsGateway https://www.lipidmaps.org Now hosted in the U.K. (Babraham Institute) Formerly located at the University of California San Diego from 2003-2018
  • 3.
  • 4.
    Lipids may bebroadly defined as hydrophobic or amphiphilic small molecules that originate entirely or in part from two distinct types of biochemical subunits or "building blocks": ketoacyl and isoprene groups. Using this approach, lipids may be divided into eight categories : fatty acyls, glycerolipids, ,glycerophospholipids, sphingolipids, saccharolipids and polyketides (derived from condensation of ketoacyl subunits); and sterol lipids and prenol lipids (derived from condensation of isoprene subunits). * Fahy,E. et al, Journal of Lipid Research, Vol. 46, 839-862, May 2005 Definition of a lipid*
  • 5.
  • 6.
    LIPID MAPS ClassificationSystem Categories and Examples Category Abbreviation Example Fatty acyls FA Dodecanoic acid Glycerolipids GL 1-hexadecanoyl-2-(9Z-octadecenoyl)-sn- glycerol Glycerophospholipids GP 1-hexadecanoyl-2-(9Z-octadecenoyl)-sn- glycero-3-phosphocholine Sphingolipids SP N-(tetradecanoyl)-sphing-4-enine Sterol lipids ST Cholest-5-en-3b-ol Prenol lipids PR 2E,6E-farnesol Saccharolipids SL UDP-3-O-(3R-hydroxy-tetradecanoyl)-aD- N-acetylglucosamine Polyketides PK Aflatoxin B1
  • 7.
    Category Abbrev Example FattyAcyls Glycerolipids Glycerophospholipids Sphingolipids Sterol Lipids Prenol Lipids Saccharolipids Polyketides FA GL GP SP ST PR SL PK Arachidonic acid 1-hexadecanoyl-sn-glycerol 1-hexadecanoyl-2-(9Z-octadecenoyl)- sn-glycero-3-phosphocholine Sphingosine Cholesterol Retinol Kdo2-lipid A epothilone D Name: PGE2 LM_ID: LMFA03010003 LM_ID description: Database: LM (LIPID MAPS) Category: FA (Fatty Acyls) Main Class: 03 (Eicosanoids) Sub Class: 01 (Prostaglandins) Unique identifier within a sub class: 0003 LIPID MAPS Lipid classification system
  • 8.
    LMSD: LIPID MAPSStructure Database Over 43,000 classified structures as of 9/20/2018 Full structures in multiple formats, exact mass and inline m/z features Relevant database cross references, InChIKey values for each structure Calculated physicochemical properties added for each structure Links to internal/external MS data Ongoing screening of major lipid-related journals
  • 9.
    Curation LIPID MAPS structure database (LMSD) Structures fromcore labs and partners New structures identified by LIPID MAPS experiments Websites, Publications Public databases Computationally generated structures Curation Composition and curation of the LMSD
  • 10.
    0 2000 4000 6000 8000 10000 12000 FA GL GPSP ST PR SL PK Lipids per category in LMSD (Sep. 2018) Total: 43,100
  • 11.
    LMSD: LIPID MAPSStructure Database Resources Databases
  • 12.
    Search LMSD bybrowsing classification hierarchy Resources Classification
  • 13.
    Search LMSD bybrowsing classification hierarchy Resources Classification
  • 14.
    LMSD Detail viewfor a lipid structure Lipid classification LM_ID m/z calculation tool Database cross-references Names, synonyms InChiKey identifier MS/MS spectra Physicochemical properties Download structure Structure SMILES
  • 15.
    m/z for selected iontype/adduct Isotopic distribution profile LMSD detail page: m/z calculator
  • 16.
    Use InChIKey tofind structures differing only in stereochemistry, double-bond geometry or isotopic labeling
  • 17.
    Use InChIKey (fullor partial) to perform a Google structure search LIPID MAPS European Bioinformatics Inst. PubChem
  • 18.
    Plant FattyAcid db LinkingLMSD to other structure databases and resources PubChem ChEBI SwissLipids HMDB LipidBank
  • 19.
    Resources Databases ->Text/ontology or Structure search Search LMSD by structure, text, mass, formula ,ontology
  • 20.
    Resources Databases ->Text/ontology Search LMSD by ontology
  • 21.
    Querying Lipidomics Gatewaywebsite as well as LIPID MAPS databases via “Quick search” Multi-purpose Small “footprint” High visibility (on home page) Search the Lipidomics Gateway html pages by keyword, or the databases by lipid class, common name, systematic name or synonym, mass, formula, InChIKey, LIPID MAPS ID, gene or protein term.
  • 22.
    Linking MS spectrato lipid structures in detail view
  • 23.
    Linking MS spectrato lipid structures in detail view (a) Curated and annotated MS/MS spectra of lipid standards contributed by LIPID MAPS core labs (b) Links to Massbank spectra (via Massbank of North America (MoNA) repository at UC Davis. Contains both experimentally obtained and predicted (LipidBlast) spectra (c) Predicted MS/MS spectra for selected lipid classes using LIPID MAPS algorithms
  • 24.
    Linking MS spectrato lipid structures in detail view (a) Curated and annotated MS/MS spectra of lipid standards contributed by LIPID MAPS core labs (b) Links to Massbank spectra (via Massbank of North America (MoNA) repository at UC Davis. Contains both experimentally obtained and predicted (LipidBlast) spectra (c) Predicted MS/MS spectra for selected lipid classes using LIPID MAPS algorithms (Covers glycerolipids, phospholipids and ceramides) Source # of Lipids in LMSD Total # of Spectra Comments Lipid Standards 443 557 Curated/annotated by LIPID MAPS core labs Massbank (MoNA) 7,304 21,097 ~14,000 are predicted ~7,000 are experimental LM Predicted spectra 15,179 15,179 MG/DG/TG PA/PC/PE/PG/PS/PI Cer
  • 25.
    The LIPID MAPSIn-Silico Structure Database (LMISSD) is a relational database generated by computational expansion of headgroups and chains for a large number of commonly occurring lipid classes. It contains over 1.1 million structures and is a separate entity from the curated LIPID MAPS Structure Database (LMSD) which is a repository for experimentally identified lipids. Resources Databases  LMISSD
  • 26.
  • 27.
    Lipid MAPS Gene/ProteomeDatabase (LMPD) Resources Databases  LMPD
  • 28.
    LMPD:Data collection strategy EntrezGene ID list Lipid-related keywords in gene names, metabolic pathways and ontology terms Manual curation NCBI Entrez UniProt Python program Gene, mRNA, protein data, PTM variants, motifs, homologs, cross- references, related proteins, ontologies, annotations, etc. LMPD database
  • 29.
    Entrez Gene ID(DNA/genomic links) RefSeq mRNA ID’s (both coding and UTR variants) RefSeq protein ID’s and sequences (unique isoforms) Post–translationally modified variants (e.g. apo-, mature forms, leader sequences, etc.) LMPD organization: Gene-> mRNA-> (apo)protein -> mature protein
  • 30.
    LMPD query page ResourcesDatabases  LMPD Search LMPD
  • 31.
    LMPD overview page:listing of annotations and isoforms
  • 32.
    LIPID MAPS: Recommendationsfor drawing structures Consistent structure representation across classes Fatty Acyls(FA) Sterol Lipids (ST) Glycerophospholipids (GP) Sphingolipids (SP) Prenol Lipids (PR) Glycerolipids (GL)
  • 33.
  • 34.
    Resources ToolsStructure Drawing Onlinedrawing tools for various lipid categories (FA,GL,GP,SP,ST) Drawing lipid structures
  • 35.
    (a) Menu-based drawinginterface (b) Abbreviation-based drawing interface
  • 36.
    (c) REST service ResourcesREST service 53 different lipid classes with examples and explanation of the abbreviation syntax
  • 37.
    Online generation ofglycan structures in full chair conformation Sugars Glc Gal GlcNAc GalNac Xyl Fuc Man NeuAc NeuGc KDN Anomeric Carbon a or b linkages may be specified Resources ToolsStructure DrawingGlcans
  • 38.
    Resources Tools MS analysis Mass spectrometry tools
  • 39.
    Resources Tools MS analysis Mass spectrometry tools
  • 40.
    Calculate the exactmass of a lipid (Display structure (save as molfile) and isotopic distribution profile) Covers glycerolipids, phospholipids, sphingolipids, fatty acids, wax esters, acylcarnitines, acyl CoA’s, cardiolipins and cholesteryl esters Resources Tools  MS analysisMultiple lipid classesCalculate exact mass..
  • 41.
    Enumeration of “bulk”lipid species from selected lists of acyl/alkyl chains Glycerolipids Phospholipids Sphingolipids Fatty acids Chol. esters Acyl CoA’s Acyl carnitines Cardiolipins Suite of combinatorial expansion tools Database of lipid “bulk” species, exact masses, formulae, annotations Wax esters
  • 42.
    Creation of avirtual lipid database Choice of range of acyl/alkyl chains These are used to create “bulk” species e.g. PC(38:4), PE(O-36:0), Cer(d32:1), HexCer(d40:2), TG(54:2), DG(32:0), FA(20:3(OH)), CE(18:1) Conservative approach: stereochemistry, sn (glycerol) position, double bond/functional group regiochemistry, double bond geometry not defined. Links to: On-demand expansion of all possible chain combinations (within defined limits) Links to: Matches of bulk species to discrete structures in LMSD database (examples)
  • 43.
    Virtual database ofbulk lipids: number of entries per class Monoradylglycerols 84 Fatty acids 13590 Diradylglycerols 615 Acyl carnitines 78 Triradylglycerols 1844 Chol. Esters 78 Digalactosyl DG's 553 Acyl CoA's 78 Monogalactosyl DG's 553 Wax esters 403 Sulfoquinovosyl DG's 553 Ceramides 258 PA 1308 Ceramide phosphates 258 PC 1308 PE-Ceramides 230 PE 1308 PI-Ceramides 230 PG 1308 Mannosyl-di-IP-ceramides 258 PI 1308 Mannosyl-IP-ceramides 258 PIP 1308 Hexosyl ceramides 258 PS 1308 Lactosyl ceramides 258 Cardiolipins 375 Sphingomyelins 258 Sulfatides 258
  • 44.
    Precursor ion searchinterface to virtual database Input: Either copy/paste a list of precursor ions or upload a peaklist file Input parameters: Mass tolerance, ion type, all chains or even chains, sort results Optionally restrict search to one or multiple lipid species Resources Tools  MS analysisMultiple lipid classesSearch Comp DB/LMSD
  • 45.
    Results page forprecursor ion search Output: view in online format (below) or as tab-delimited text file Output features: Sub-table for each input ion. Links: On-demand expansion of all possible chain combinations (abbreviation) Links: Matches of bulk species to discrete structures in LMSD database (examples)
  • 46.
    Expansion of specieslevel to display all possible chain combinations within defined chain and chain/double-bond ratio limits
  • 47.
    Links to examplesof discrete structures in LMSD database with the identical bulk structure *This feature was implemented by computing the “bulk” abbreviation (where possible) for every structure in the LMSD database
  • 48.
    Resources Tools MS analysisGlycerophospholipids Computationally-generated database of oxidized phospholipids 67 different oxidized chain species at sn2 position derived from C18,C20 and C22 precursors
  • 49.
    Resources Tools MS analysis  Glycerophospholipids Computationally-generated database of oxidized phospholipids
  • 50.
    Match MS/MS datavs Glycosylceramide in-silico database Searches computationally generated database of 400 different headgroups, 45 different sphingoid bases and 52 different N-acyl chains Resources Tools  MS analysisSphingolipids
  • 51.
    Predict Glycerophopholipid MS/MSproduct ions for a molecule of interest Resources Tools  MS analysisGlycerophospholipids
  • 52.
    Predict Glycerophospholipid MS/MSproduct ions for a molecule of interest
  • 53.
    LipidFinder: A computationalworkflow for discovery of lipids In high-resolution LC/MS datasets Resources Tools  MS analysis Multiple classes LipidFinder on LIPID MAPS: peak filtering, MS searching and statistical analysis for lipidomics Eoin Fahy, Jorge Alvarez-Jarreta, Christopher J Brasher, An Nguyen, Jade I Hawksworth, Patricia Rodrigues, Sven Meckelmann, Stuart M Allen, Valerie B O'Donnell https://doi.org/10.1093/bioinformatics/bty679
  • 54.
    Test samples UPLC/LCMS XCMS Peak Filtering MSsearching Lipid classification Results LIPIDFINDER Statistical analysis of experimental groups Refined peaklist of significantly altered features (Large peaklist) (smaller peaklist) Perform statistical analysis (Volcano plot, OP-PLSDA, Random-forest, ANOVA analysis) based on experimental groups (factors) to identify significantly up/down regulated features. Run MS search on this (much smaller) selected peaklist to focus on the biologically significant features LipidFinder: A computational workflow for discovery of lipids In high-resolution LC/MS datasets
  • 55.
  • 56.
  • 57.
    All studies onMetabolomics Workbench (65% are lipids) ~1000 experimental studies reporting ~180,000 metabolite species ~150,000 of these metabolite species were mapped to RefMet classification
  • 58.
    RefMet Metabolite Classificationand indexing RefMet database with indexed metabolite classification LIPID MAPS Classification Lipids Non-lipids ClassyFire Classification Uncurated classes Curation, Indexing Indexing Indexing of metabolite classes/subclasses facilitates logical ordering of data
  • 59.
    Web Portal querieslipidomics data on Metabolomics Workbench ~600 studies in MW have reported named lipids (excluding polyketides) >320 of those have >= 20 named lipids Resources Experimental dataLipidomics Data on MW
  • 60.
    Tools for Statisticalanalysis Resources Tools  Statistical analysis
  • 61.
    Metabolomics Workbench Portable analysis toolbox codebase (Rfiles, PHP, Javascript) + configuration file R statistics application + Libraries User interfaces Portable lipidomics analysis toolbox design REST service obtains RefMet classification data Results
  • 62.
    Resources Tools Statistical analysis
  • 63.
    Tools for Statisticalanalysis: output
  • 64.
    Tools for Statisticalanalysis: Map names to RefMet
  • 65.
    Tools for Statisticalanalysis: Classified names
  • 66.
    Tools for Statisticalanalysis: Classified names
  • 67.
    Volcano plot: pairwisecomparison of 2 experimental conditions
  • 68.
    P-value on yaxis Classes order by classification index on x axis Size of colored circles represents # of (significant) metabolites per class with p-value and fold change exceeding selected cutoff values Size of gray circles represents # of all reported metabolites per class Color of circles represents fold change value red:group2/group1 >1 (upregulated) green:group2/group1<1 (downregulated) Mouse over bubble to view # of metabolites per class Bubble plot display of Volcano plot data Comparing Diabetic and control mice
  • 69.
    Crohn’s disease vscontrols Volcano plot/class enrichment Publication: pathway enrichment
  • 70.
    Crohn’s disease vscontrols Volcano plot/Bargraph by class Publication: Bargraph by pathway
  • 71.
    Under development atLIPID MAPS Protocols section Sample prep/MS analysis methods By lipid category Pathways section Update and migration to WikiPathways format
  • 72.
    Acknowledgements Cardiff University Valerie O’Donnell(PI) Caroline Jeffs Jorge Alvarez-Jarreta Maria Valdivia Robert Andrews Babraham Institute Michael Wakelam(PI) Simon Andrews An Nguyen University of California San Diego Shankar Subramaniam (PI) Edward Dennis (PI) Dawn Cotter Funded by Wellcome Trust