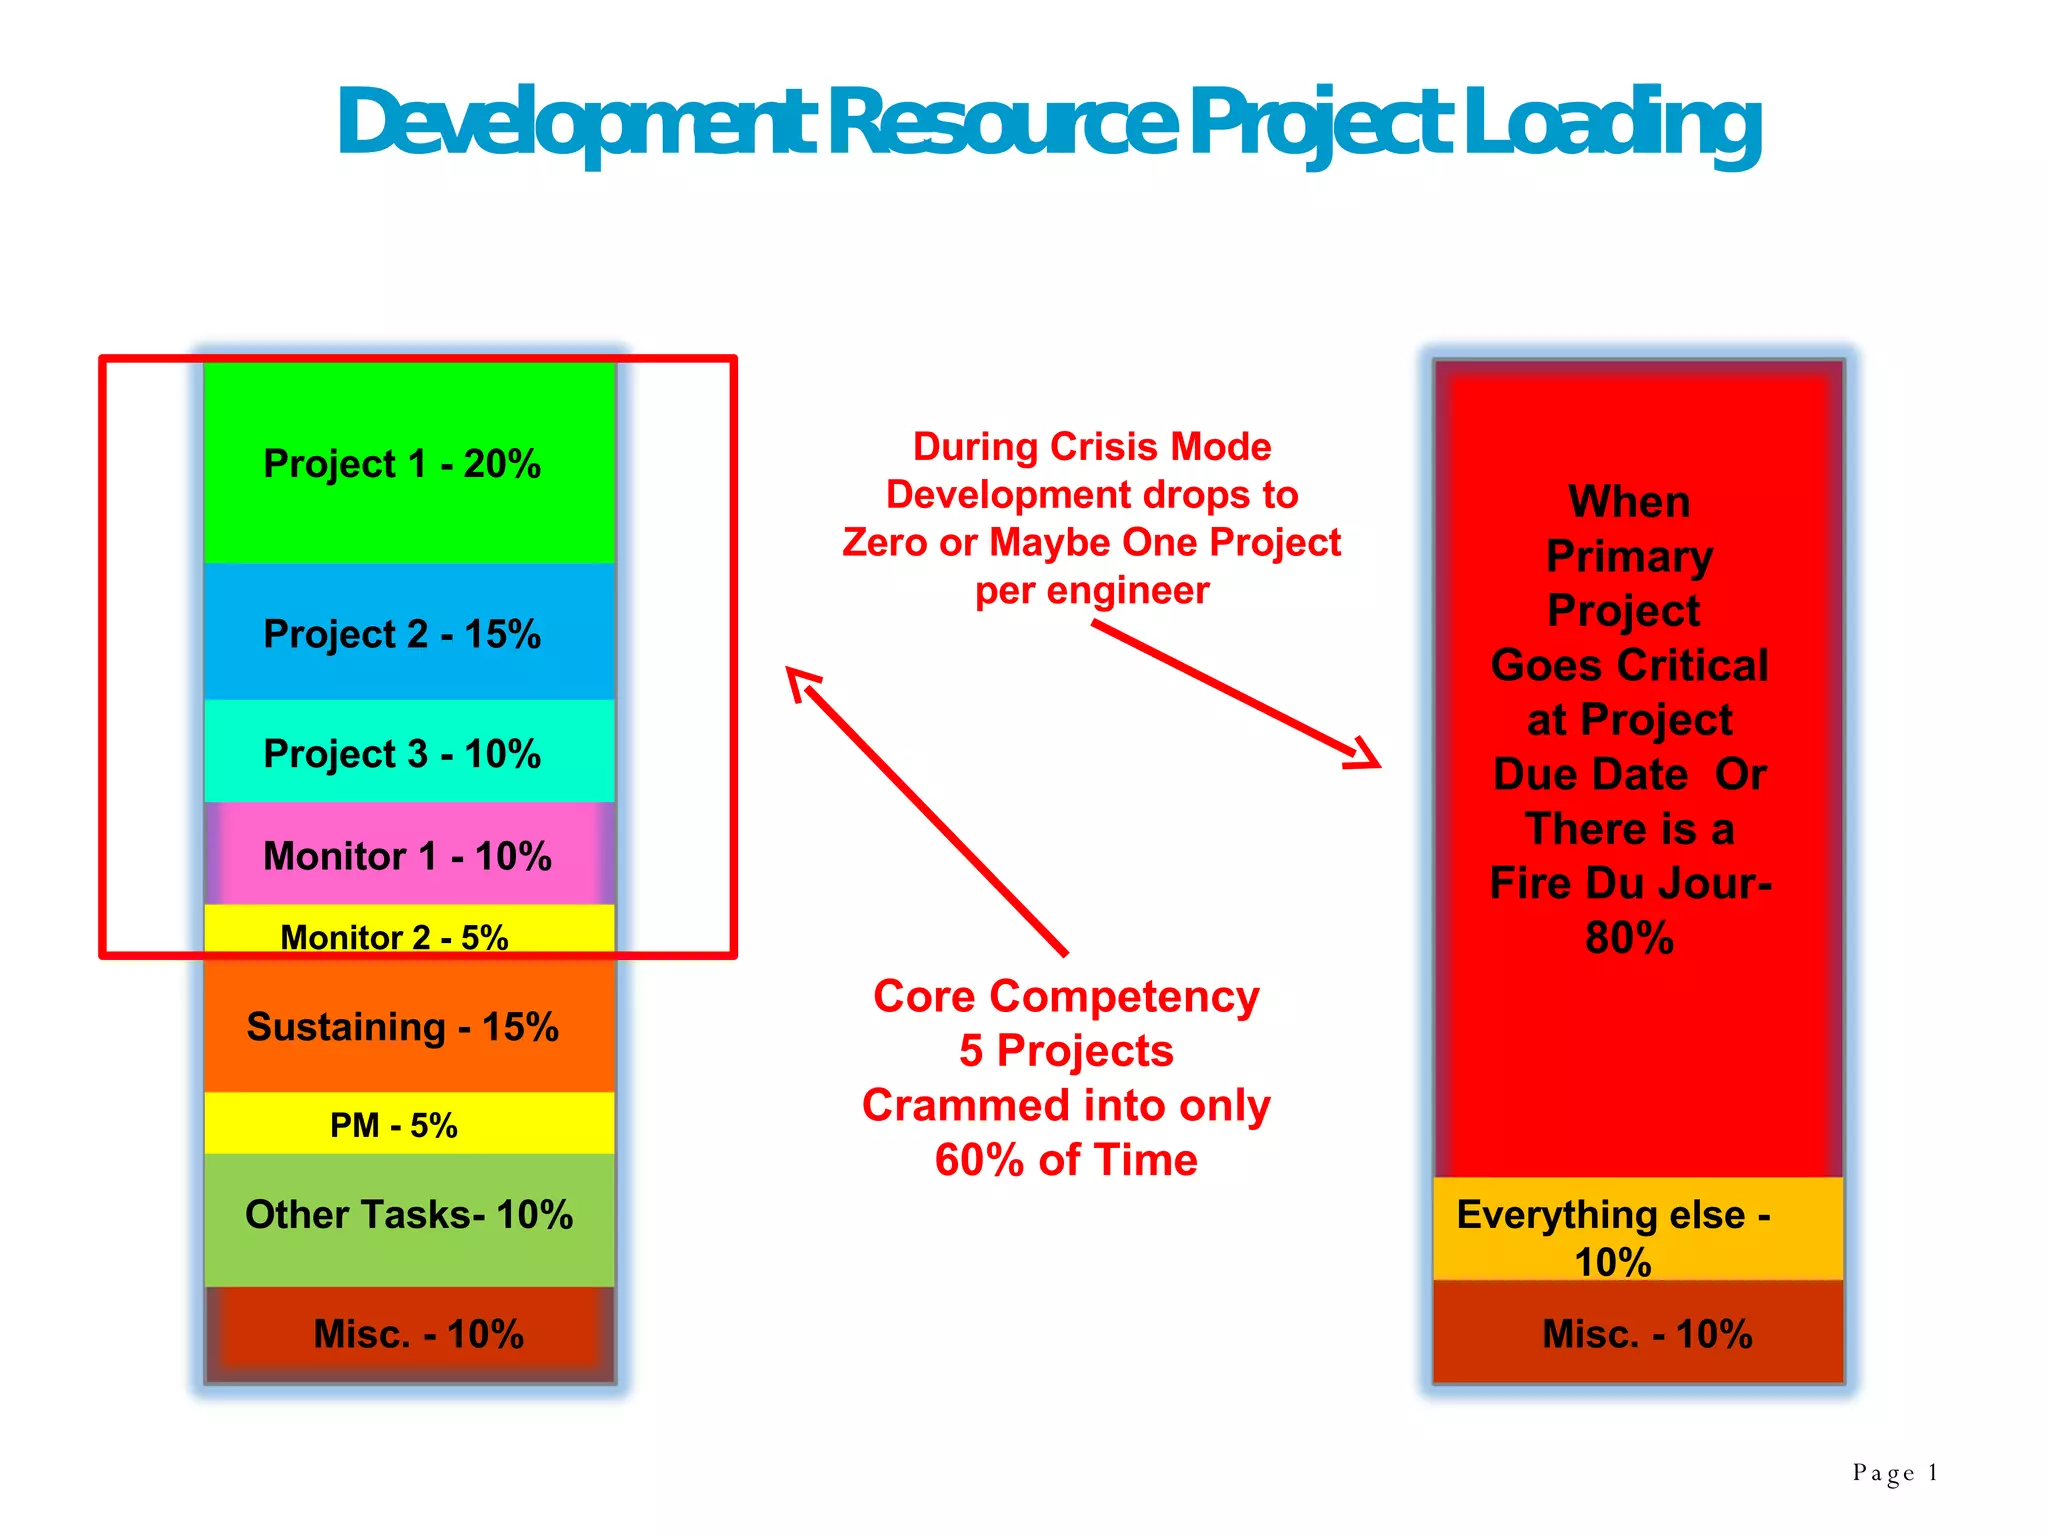
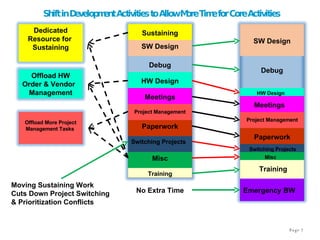
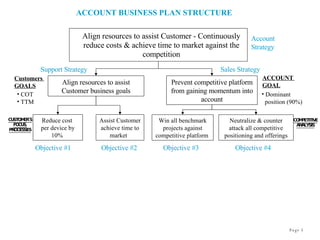
Development Resource Project Loading Project 1 - 20% Project 2 - 15% Project 3 - 10% Monitor 1 - 10% Monitor 2 - 5% Misc. - 10% When Primary Project  Goes Critical at Project Due Date  Or There is a Fire Du Jour- 80% Everything else - 10% Misc. - 10% During Crisis Mode Development drops to Zero or Maybe One Project per engineer Sustaining - 15% PM - 5% Other Tasks- 10% Core Competency 5 Projects Crammed into only 60% of Time
Shift in Development Activities to Allow More Time for Core Activities Sustaining SW Design Debug SW Design Debug HW Design Meetings Meetings Project Management Project Management Paperwork Paperwork HW Design Switching Projects Switching Projects Offload More Project Management Tasks  Misc Misc Training Training Emergency BW No Extra Time Moving Sustaining Work Cuts Down Project Switching & Prioritization Conflicts Offload HW Order & Vendor  Management Dedicated Resource for  Sustaining
Determining True Out Source Project Costs Test Development Delivery QA PROG Qual Start RTP Production Support Fixed Cost per project FT+WS = 67K Internal TE  (1 month @  20% loading) = $3K Internal TE  (6 month @  5% loading) = $4K Time Duration 6 Months Time Duration 1 Months Time Duration Assume 6 Months Worst Case FT + WS = 93.5K  Tape Out EOL Original Project Model never included these costs 3M @5% 2M @15% 1M @25% This Adds $9.5K  2k  +  4k  +  3.5K (40 hrs tester time @ $250/hour = 10K)
Internal Model Project Costs  Test Development  QA PROG Qual Start RTP Production Support Internal TE  (4 months @ 30% loading) = 16.2K  +  160hrs Tester time @250/hr =40K Internal TE  (1 month @  20% loading) = $3K Internal TE  (6 month @  5% loading) = $4K Time Duration 4 Months Time Duration 1- Months Time Duration Assume 6 Months Worst Case FT + WS = 73.2K  Closer to Original Cost Model Tape Out EOL Project Model never included these costs (40 hrs tester time @ $250/hour = 10K)
Account  Strategy Align resources to assist Customer - Continuously reduce costs & achieve time to market against the competition ACCOUNT BUSINESS PLAN STRUCTURE Support Strategy Align resources to assist Customer business goals COT TTM Customers  GOALS Prevent competitive platform from gaining momentum into account Sales Strategy Dominant position (90%) ACCOUNT  GOAL Reduce cost  per device by 10%  Assist Customer achieve time to market  Objective #1 Objective #2 CUSTOMER’S FOCUS, PROCESSES Objective #3 Win all benchmark projects against competitive platform  Neutralize & counter attack all competitive positioning and offerings Objective #4 COMPETITIVE ANALYSIS
Support Staff’s Role in Selling Support Engineers are in the Best position to “Sell” services Technical Expert on Customers Systems Day to day Presence Talk engineer to engineer Know customers problems and how to solve using equipment Directly effect customers perception?
How to Sell? Stressing what we do Best? Best Support Create Solutions to customer problems Total solutions (Front to back end solutions) Strengths of 100+ Engineers Lowest Cost Resources Flexible Scaleable Proactive
Support Staff creates positive feelings Talk about what we can do! We are wonderful, we can do the job for them We will work to understand their needs to serve them better! We will align with their roadmaps to make them successful! We will work to reduce their Costs We will be Agile to adapt to their needs!

Linkedin Resource Focus

  • 1.
    Development Resource ProjectLoading Project 1 - 20% Project 2 - 15% Project 3 - 10% Monitor 1 - 10% Monitor 2 - 5% Misc. - 10% When Primary Project Goes Critical at Project Due Date Or There is a Fire Du Jour- 80% Everything else - 10% Misc. - 10% During Crisis Mode Development drops to Zero or Maybe One Project per engineer Sustaining - 15% PM - 5% Other Tasks- 10% Core Competency 5 Projects Crammed into only 60% of Time
  • 2.
    Shift in DevelopmentActivities to Allow More Time for Core Activities Sustaining SW Design Debug SW Design Debug HW Design Meetings Meetings Project Management Project Management Paperwork Paperwork HW Design Switching Projects Switching Projects Offload More Project Management Tasks Misc Misc Training Training Emergency BW No Extra Time Moving Sustaining Work Cuts Down Project Switching & Prioritization Conflicts Offload HW Order & Vendor Management Dedicated Resource for Sustaining
  • 3.
    Determining True OutSource Project Costs Test Development Delivery QA PROG Qual Start RTP Production Support Fixed Cost per project FT+WS = 67K Internal TE (1 month @ 20% loading) = $3K Internal TE (6 month @ 5% loading) = $4K Time Duration 6 Months Time Duration 1 Months Time Duration Assume 6 Months Worst Case FT + WS = 93.5K Tape Out EOL Original Project Model never included these costs 3M @5% 2M @15% 1M @25% This Adds $9.5K 2k + 4k + 3.5K (40 hrs tester time @ $250/hour = 10K)
  • 4.
    Internal Model ProjectCosts Test Development QA PROG Qual Start RTP Production Support Internal TE (4 months @ 30% loading) = 16.2K + 160hrs Tester time @250/hr =40K Internal TE (1 month @ 20% loading) = $3K Internal TE (6 month @ 5% loading) = $4K Time Duration 4 Months Time Duration 1- Months Time Duration Assume 6 Months Worst Case FT + WS = 73.2K Closer to Original Cost Model Tape Out EOL Project Model never included these costs (40 hrs tester time @ $250/hour = 10K)
  • 5.
    Account StrategyAlign resources to assist Customer - Continuously reduce costs & achieve time to market against the competition ACCOUNT BUSINESS PLAN STRUCTURE Support Strategy Align resources to assist Customer business goals COT TTM Customers GOALS Prevent competitive platform from gaining momentum into account Sales Strategy Dominant position (90%) ACCOUNT GOAL Reduce cost per device by 10% Assist Customer achieve time to market Objective #1 Objective #2 CUSTOMER’S FOCUS, PROCESSES Objective #3 Win all benchmark projects against competitive platform Neutralize & counter attack all competitive positioning and offerings Objective #4 COMPETITIVE ANALYSIS
  • 6.
    Support Staff’s Rolein Selling Support Engineers are in the Best position to “Sell” services Technical Expert on Customers Systems Day to day Presence Talk engineer to engineer Know customers problems and how to solve using equipment Directly effect customers perception?
  • 7.
    How to Sell?Stressing what we do Best? Best Support Create Solutions to customer problems Total solutions (Front to back end solutions) Strengths of 100+ Engineers Lowest Cost Resources Flexible Scaleable Proactive
  • 8.
    Support Staff createspositive feelings Talk about what we can do! We are wonderful, we can do the job for them We will work to understand their needs to serve them better! We will align with their roadmaps to make them successful! We will work to reduce their Costs We will be Agile to adapt to their needs!