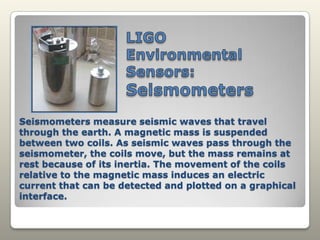
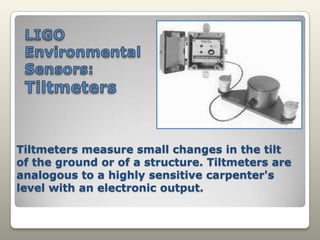
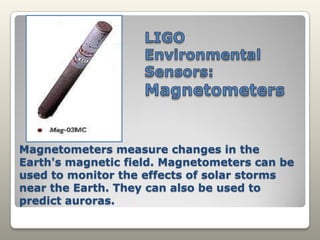
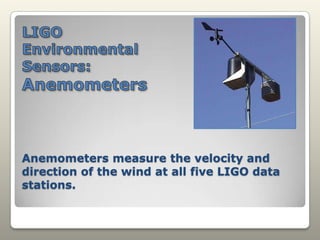
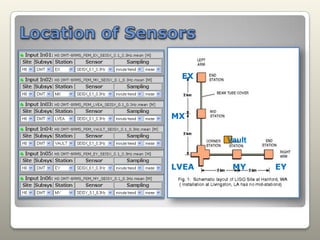
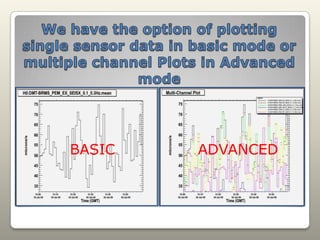
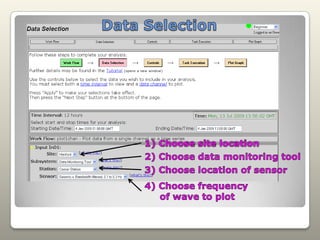
LIGO e-LabLaser Interferometer Gravitational Wave ObservatoryUsing Seismic Data in the classroom.
Design flowchart for LIGO e-Lab
LIGO Environmental Sensors: SeismometersSeismometers measure seismic waves that travel through the earth. A magnetic mass is suspended between two coils. As seismic waves pass through the seismometer, the coils move, but the mass remains at rest because of its inertia. The movement of the coils relative to the magnetic mass induces an electric current that can be detected and plotted on a graphical interface.
LIGO EnvironmentalSensors: TiltmetersTiltmeters measure small changes in the tilt of the ground or of a structure. Tiltmeters are analogous to a highly sensitive carpenter's level with an electronic output.
LIGO Environmental Sensors: MagnetometersMagnetometers measure changes in the Earth's magnetic field. Magnetometers can be used to monitor the effects of solar storms near the Earth. They can also be used to predict auroras.
LIGO Environmental Sensors: AnemometersAnemometers measure the velocity and direction of the wind at all five LIGO data stations.
Location of SensorsEXMXVaultMYEYLVEA
We have the option of plotting single sensor data in basic mode or multiple channel Plots in Advanced modeBASICADVANCED
I2U2 LIGO PROJECTS HOME PAGE
We have included a data entry form for consistent input
We have developed an auto plotting map for immediate feed back
For additional in-depth studies we have provided a collaborative map to minimize tedious re-work.
Each plotted point contains basic information and a link to an e-Lab Poster.
Each poster will provide additional information with links to source data and a link to the specific earthquake site map.
Choose an Earthquake to investigate from USGS or other source
Information to gatherDate of earthquakeTime of earthquakeLatitude of earthquakeLongitude of earthquakeMagnitude of earthquakeDepth of focus of earthquakeDistance to LIGOEstimated travel time of earthquake waves (USGS travel time calculator or rule of thumb)Actual travel time of earthquake waves
Gathering Data using BluestoneFirst determine your investigation level.Beginningonly allows one channel to be plotted on a graph.BothIntermediateand Advancedallow for multiple channels on one plot.
Data Selection1) Choose site location2) Choose data monitoring tool3) Choose location of sensor4) Choose frequency      of wave to plot
Begin analysis*No options for beginners*Click on “GO”
Task executionJust wait for plot to Be calculated and drawn
Plotted graph of seismic activityYou may save the plot using       these options
We have added a line for the actual time of the Earthquake and the calculated arrival time to LIGO.
What can we do with this information?Map Plate boundaries.Study earthquake wave propagation rates.Graph earthquakes focus depth.Changes in wave velocity based on rock types (Continental/Oceanic).Compare earthquake intensity and depth.…

Ligo E Lab

  • 1.
    LIGO e-LabLaser InterferometerGravitational Wave ObservatoryUsing Seismic Data in the classroom.
  • 2.
  • 3.
    LIGO Environmental Sensors:SeismometersSeismometers measure seismic waves that travel through the earth. A magnetic mass is suspended between two coils. As seismic waves pass through the seismometer, the coils move, but the mass remains at rest because of its inertia. The movement of the coils relative to the magnetic mass induces an electric current that can be detected and plotted on a graphical interface.
  • 4.
    LIGO EnvironmentalSensors: TiltmetersTiltmetersmeasure small changes in the tilt of the ground or of a structure. Tiltmeters are analogous to a highly sensitive carpenter's level with an electronic output.
  • 5.
    LIGO Environmental Sensors:MagnetometersMagnetometers measure changes in the Earth's magnetic field. Magnetometers can be used to monitor the effects of solar storms near the Earth. They can also be used to predict auroras.
  • 6.
    LIGO Environmental Sensors:AnemometersAnemometers measure the velocity and direction of the wind at all five LIGO data stations.
  • 7.
  • 8.
    We have theoption of plotting single sensor data in basic mode or multiple channel Plots in Advanced modeBASICADVANCED
  • 9.
  • 10.
    We have includeda data entry form for consistent input
  • 11.
    We have developedan auto plotting map for immediate feed back
  • 12.
    For additional in-depthstudies we have provided a collaborative map to minimize tedious re-work.
  • 13.
    Each plotted pointcontains basic information and a link to an e-Lab Poster.
  • 14.
    Each poster willprovide additional information with links to source data and a link to the specific earthquake site map.
  • 15.
    Choose an Earthquaketo investigate from USGS or other source
  • 16.
    Information to gatherDateof earthquakeTime of earthquakeLatitude of earthquakeLongitude of earthquakeMagnitude of earthquakeDepth of focus of earthquakeDistance to LIGOEstimated travel time of earthquake waves (USGS travel time calculator or rule of thumb)Actual travel time of earthquake waves
  • 17.
    Gathering Data usingBluestoneFirst determine your investigation level.Beginningonly allows one channel to be plotted on a graph.BothIntermediateand Advancedallow for multiple channels on one plot.
  • 18.
    Data Selection1) Choosesite location2) Choose data monitoring tool3) Choose location of sensor4) Choose frequency of wave to plot
  • 19.
    Begin analysis*No optionsfor beginners*Click on “GO”
  • 20.
    Task executionJust waitfor plot to Be calculated and drawn
  • 21.
    Plotted graph ofseismic activityYou may save the plot using these options
  • 22.
    We have addeda line for the actual time of the Earthquake and the calculated arrival time to LIGO.
  • 23.
    What can wedo with this information?Map Plate boundaries.Study earthquake wave propagation rates.Graph earthquakes focus depth.Changes in wave velocity based on rock types (Continental/Oceanic).Compare earthquake intensity and depth.…