LIDAR (Light Detectionand Ranging)
• Lidar (also know as 3D laser scanning) is not only replacing
conventional sensors, but also creating new methods with
unique properties that could not be achieved before.
• Lidar is extremely useful in atmospheric and environmental
research as well as space exploration.
• It also has wide applications in industry, defense, and
military.
• It has terrestrial, airborne, and mobile applications.
3.
LIDAR (Light Detectionand Ranging)
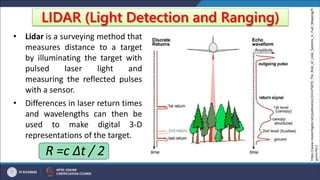
• Lidar is a surveying method that
measures distance to a target
by illuminating the target with
pulsed laser light and
measuring the reflected pulses
with a sensor.
• Differences in laser return times
and wavelengths can then be
used to make digital 3-D
representations of the target.
R =c Δt / 2
https://www.researchgate.net/publication/241475870_The_Role_of_Lidar_Systems_in_Fuel_Mapping/fi
gures?lo=1
4.
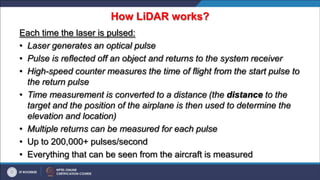
How LiDAR works?
Eachtime the laser is pulsed:
• Laser generates an optical pulse
• Pulse is reflected off an object and returns to the system receiver
• High-speed counter measures the time of flight from the start pulse to
the return pulse
• Time measurement is converted to a distance (the distance to the
target and the position of the airplane is then used to determine the
elevation and location)
• Multiple returns can be measured for each pulse
• Up to 200,000+ pulses/second
• Everything that can be seen from the aircraft is measured
LIDAR (Light Detectionand Ranging)
• Lidar is commonly used to make high-resolution maps, with
applications in geodesy, geomatics, archaeology, geography,
geology, geomorphology, seismology, forestry, atmospheric
physics, laser guidance, airborne laser swath mapping (ALSM),
and laser altimetry.
• The technology is also used in control and navigation for some
autonomous cars.
• It also has wide applications in industry, defense, and military.
• It has terrestrial, airborne, and mobile applications.
https://en.wikipedia.org/wiki/Lidar
7.
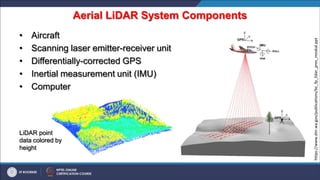
Aerial LiDAR SystemComponents
• Aircraft
• Scanning laser emitter-receiver unit
• Differentially-corrected GPS
• Inertial measurement unit (IMU)
• Computer
LiDAR point
data colored by
height
https://www.dnr.wa.gov/publications/bc_fp_lidar_pres_moskal.ppt
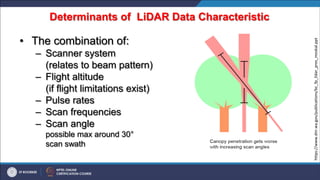
Determinants of LiDARData Characteristic
• The combination of:
– Scanner system
(relates to beam pattern)
– Flight altitude
(if flight limitations exist)
– Pulse rates
– Scan frequencies
– Scan angle
possible max around 30°
scan swath
https://www.dnr.wa.gov/publications/bc_fp_lidar_pres_moskal.ppt
10.
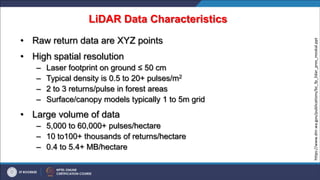
LiDAR Data Characteristics
•Raw return data are XYZ points
• High spatial resolution
– Laser footprint on ground ≤ 50 cm
– Typical density is 0.5 to 20+ pulses/m2
– 2 to 3 returns/pulse in forest areas
– Surface/canopy models typically 1 to 5m grid
• Large volume of data
– 5,000 to 60,000+ pulses/hectare
– 10 to100+ thousands of returns/hectare
– 0.4 to 5.4+ MB/hectare
https://www.dnr.wa.gov/publications/bc_fp_lidar_pres_moskal.ppt
11.
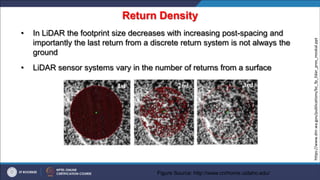
Return Density
• InLiDAR the footprint size decreases with increasing post-spacing and
importantly the last return from a discrete return system is not always the
ground
• LiDAR sensor systems vary in the number of returns from a surface
Figure Source: http://www.cnrhome.uidaho.edu/
https://www.dnr.wa.gov/publications/bc_fp_lidar_pres_moskal.ppt
12.
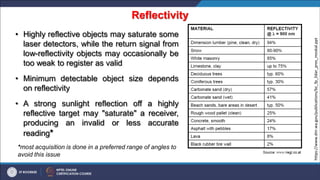
Reflectivity
• Highly reflectiveobjects may saturate some
laser detectors, while the return signal from
low-reflectivity objects may occasionally be
too weak to register as valid
• Minimum detectable object size depends
on reflectivity
• A strong sunlight reflection off a highly
reflective target may "saturate" a receiver,
producing an invalid or less accurate
reading*
*most acquisition is done in a preferred range of angles to
avoid this issue
https://www.dnr.wa.gov/publications/bc_fp_lidar_pres_moskal.ppt
13.
Dust & Vapor
•Laser measurements can be weakened by interacting with dust
and vapor particles, which scatter the laser beam and the signal
returning from the target
• Using last-pulse measurements can reduce or eliminate this
interference
• Systems that are expected to work in such conditions regularly
can be optimized for these environments
https://www.dnr.wa.gov/publications/bc_fp_lidar_pres_moskal.ppt
14.
Background Noise andRadiation
• The laser is not affected by background noise
• Most systems determine baseline radiation levels to
ensure that it does not interfere with measurements
https://www.dnr.wa.gov/publications/bc_fp_lidar_pres_moskal.ppt
15.
Overall Accuracy
• (X,Y,Z)position of each return
– 50-100cm horizontal
– 10-15cm vertical
• Ground surface (bare-earth surface)
– What is the ground (grass, rocks, stumps)?
• Tree heights
– Underestimate tree heights by 0.5 to 2 m
– Error is species dependent
https://www.dnr.wa.gov/publications/bc_fp_lidar_pres_moskal.ppt
16.
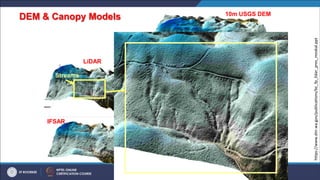
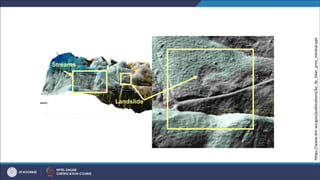
LiDAR
DEM & CanopyModels
IFSAR IFSAR
10m USGS DEM
Streams
Landslide
LiDAR
https://www.dnr.wa.gov/publications/bc_fp_lidar_pres_moskal.ppt
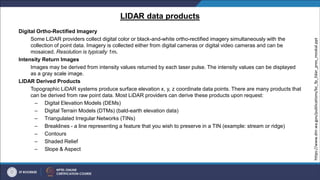
LIDAR data products
DigitalOrtho-Rectified Imagery
Some LiDAR providers collect digital color or black-and-white ortho-rectified imagery simultaneously with the
collection of point data. Imagery is collected either from digital cameras or digital video cameras and can be
mosaiced. Resolution is typically 1m.
Intensity Return Images
Images may be derived from intensity values returned by each laser pulse. The intensity values can be displayed
as a gray scale image.
LIDAR Derived Products
Topographic LiDAR systems produce surface elevation x, y, z coordinate data points. There are many products that
can be derived from raw point data. Most LiDAR providers can derive these products upon request:
– Digital Elevation Models (DEMs)
– Digital Terrain Models (DTMs) (bald-earth elevation data)
– Triangulated Irregular Networks (TINs)
– Breaklines - a line representing a feature that you wish to preserve in a TIN (example: stream or ridge)
– Contours
– Shaded Relief
– Slope & Aspect
https://www.dnr.wa.gov/publications/bc_fp_lidar_pres_moskal.ppt
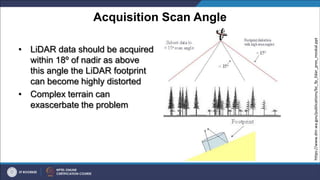
Acquisition Scan Angle
•LiDAR data should be acquired
within 18º of nadir as above
this angle the LiDAR footprint
can become highly distorted
• Complex terrain can
exascerbate the problem
https://www.dnr.wa.gov/publications/bc_fp_lidar_pres_moskal.ppt
23.
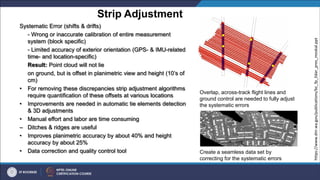
Strip Adjustment
Systematic Error(shifts & drifts)
- Wrong or inaccurate calibration of entire measurement
system (block specific)
- Limited accuracy of exterior orientation (GPS- & IMU-related
time- and location-specific)
Result: Point cloud will not lie
on ground, but is offset in planimetric view and height (10’s of
cm)
• For removing these discrepancies strip adjustment algorithms
require quantification of these offsets at various locations
• Improvements are needed in automatic tie elements detection
& 3D adjustments
• Manual effort and labor are time consuming
– Ditches & ridges are useful
• Improves planimetric accuracy by about 40% and height
accuracy by about 25%
• Data correction and quality control tool
Overlap, across-track flight lines and
ground control are needed to fully adjust
the systematic errors
Create a seamless data set by
correcting for the systematic errors
https://www.dnr.wa.gov/publications/bc_fp_lidar_pres_moskal.ppt
24.
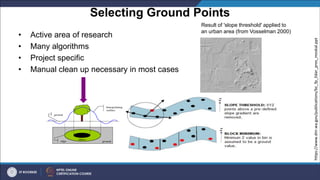
Selecting Ground Points
•Active area of research
• Many algorithms
• Project specific
• Manual clean up necessary in most cases
Result of 'slope threshold' applied to
an urban area (from Vosselman 2000)
https://www.dnr.wa.gov/publications/bc_fp_lidar_pres_moskal.ppt
25.
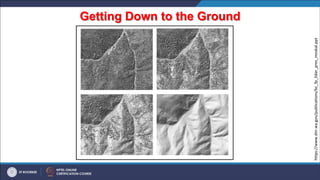
Getting Down tothe Ground
https://www.dnr.wa.gov/publications/bc_fp_lidar_pres_moskal.ppt
26.
Filtering
• Post groundpoint selection filtering is also performed to reduce
the size of the data sets
• This type of filtering should only be applied in even terrain
• Uneven terrain and densely vegetated areas are most
susceptible to removal of critical interpolation points
https://www.dnr.wa.gov/publications/bc_fp_lidar_pres_moskal.ppt
27.
Terrain
• Digital elevationmodel (DEM), digital terrain model (DTM): “Ground”
• Digital surface model (DSM): “top surface”
• In open terrain, the separation surface between air and bare earth
• DEM is different from measured laser points due to very different
reasons:
1. Filtering: classification of points into terrain and off-terrain
2. Basis for DTM generation, detection of topographic objects
28.
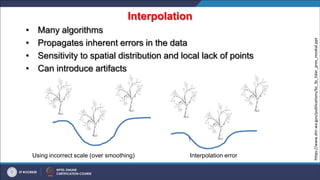
Interpolation
• Many algorithms
•Propagates inherent errors in the data
• Sensitivity to spatial distribution and local lack of points
• Can introduce artifacts
Using incorrect scale (over smoothing) Interpolation error
https://www.dnr.wa.gov/publications/bc_fp_lidar_pres_moskal.ppt
29.
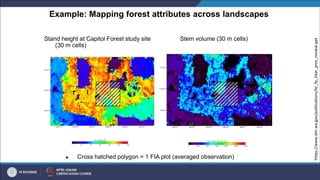
Example: Mapping forestattributes across landscapes
Stand height at Capitol Forest study site
(30 m cells)
Stem volume (30 m cells)
Cross hatched polygon = 1 FIA plot (averaged observation)
https://www.dnr.wa.gov/publications/bc_fp_lidar_pres_moskal.ppt
30.
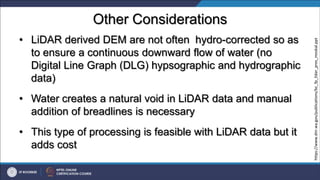
Other Considerations
• LiDARderived DEM are not often hydro-corrected so as
to ensure a continuous downward flow of water (no
Digital Line Graph (DLG) hypsographic and hydrographic
data)
• Water creates a natural void in LiDAR data and manual
addition of breadlines is necessary
• This type of processing is feasible with LiDAR data but it
adds cost
https://www.dnr.wa.gov/publications/bc_fp_lidar_pres_moskal.ppt
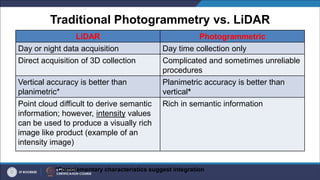
Traditional Photogrammetry vs.LiDAR
LiDAR Photogrammetric
Day or night data acquisition Day time collection only
Direct acquisition of 3D collection Complicated and sometimes unreliable
procedures
Vertical accuracy is better than
planimetric*
Planimetric accuracy is better than
vertical*
Point cloud difficult to derive semantic
information; however, intensity values
can be used to produce a visually rich
image like product (example of an
intensity image)
Rich in semantic information
*Complementary characteristics suggest integration
34.
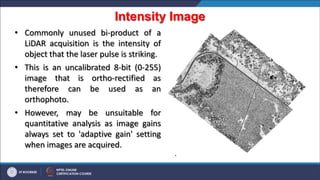
Intensity Image
.
• Commonlyunused bi-product of a
LiDAR acquisition is the intensity of
object that the laser pulse is striking.
• This is an uncalibrated 8-bit (0-255)
image that is ortho-rectified as
therefore can be used as an
orthophoto.
• However, may be unsuitable for
quantitative analysis as image gains
always set to 'adaptive gain' setting
when images are acquired.
35.
Further Analysis &Ground Validation
• Once the DTM or DEM is available GIS can be utilized for further
systematic analysis and modeling
• Accuracy assessment should always be attempted (best
approach is to do ground validation)