Download to read offline
![Leveraging Collaborative Tagging
for Web Item Design
Mahashweta Das, Gautam Das
, Vagelis Hristidis
Presenter : Ajith C Ajjarani
[1000-727269]
1/15/2012
1](https://image.slidesharecdn.com/leveragingcollaborativetaggingforwebitemdesignajithajjarani-120116013020-phpapp02/75/Leveraging-collaborativetaggingforwebitemdesign-ajithajjarani-1-2048.jpg)
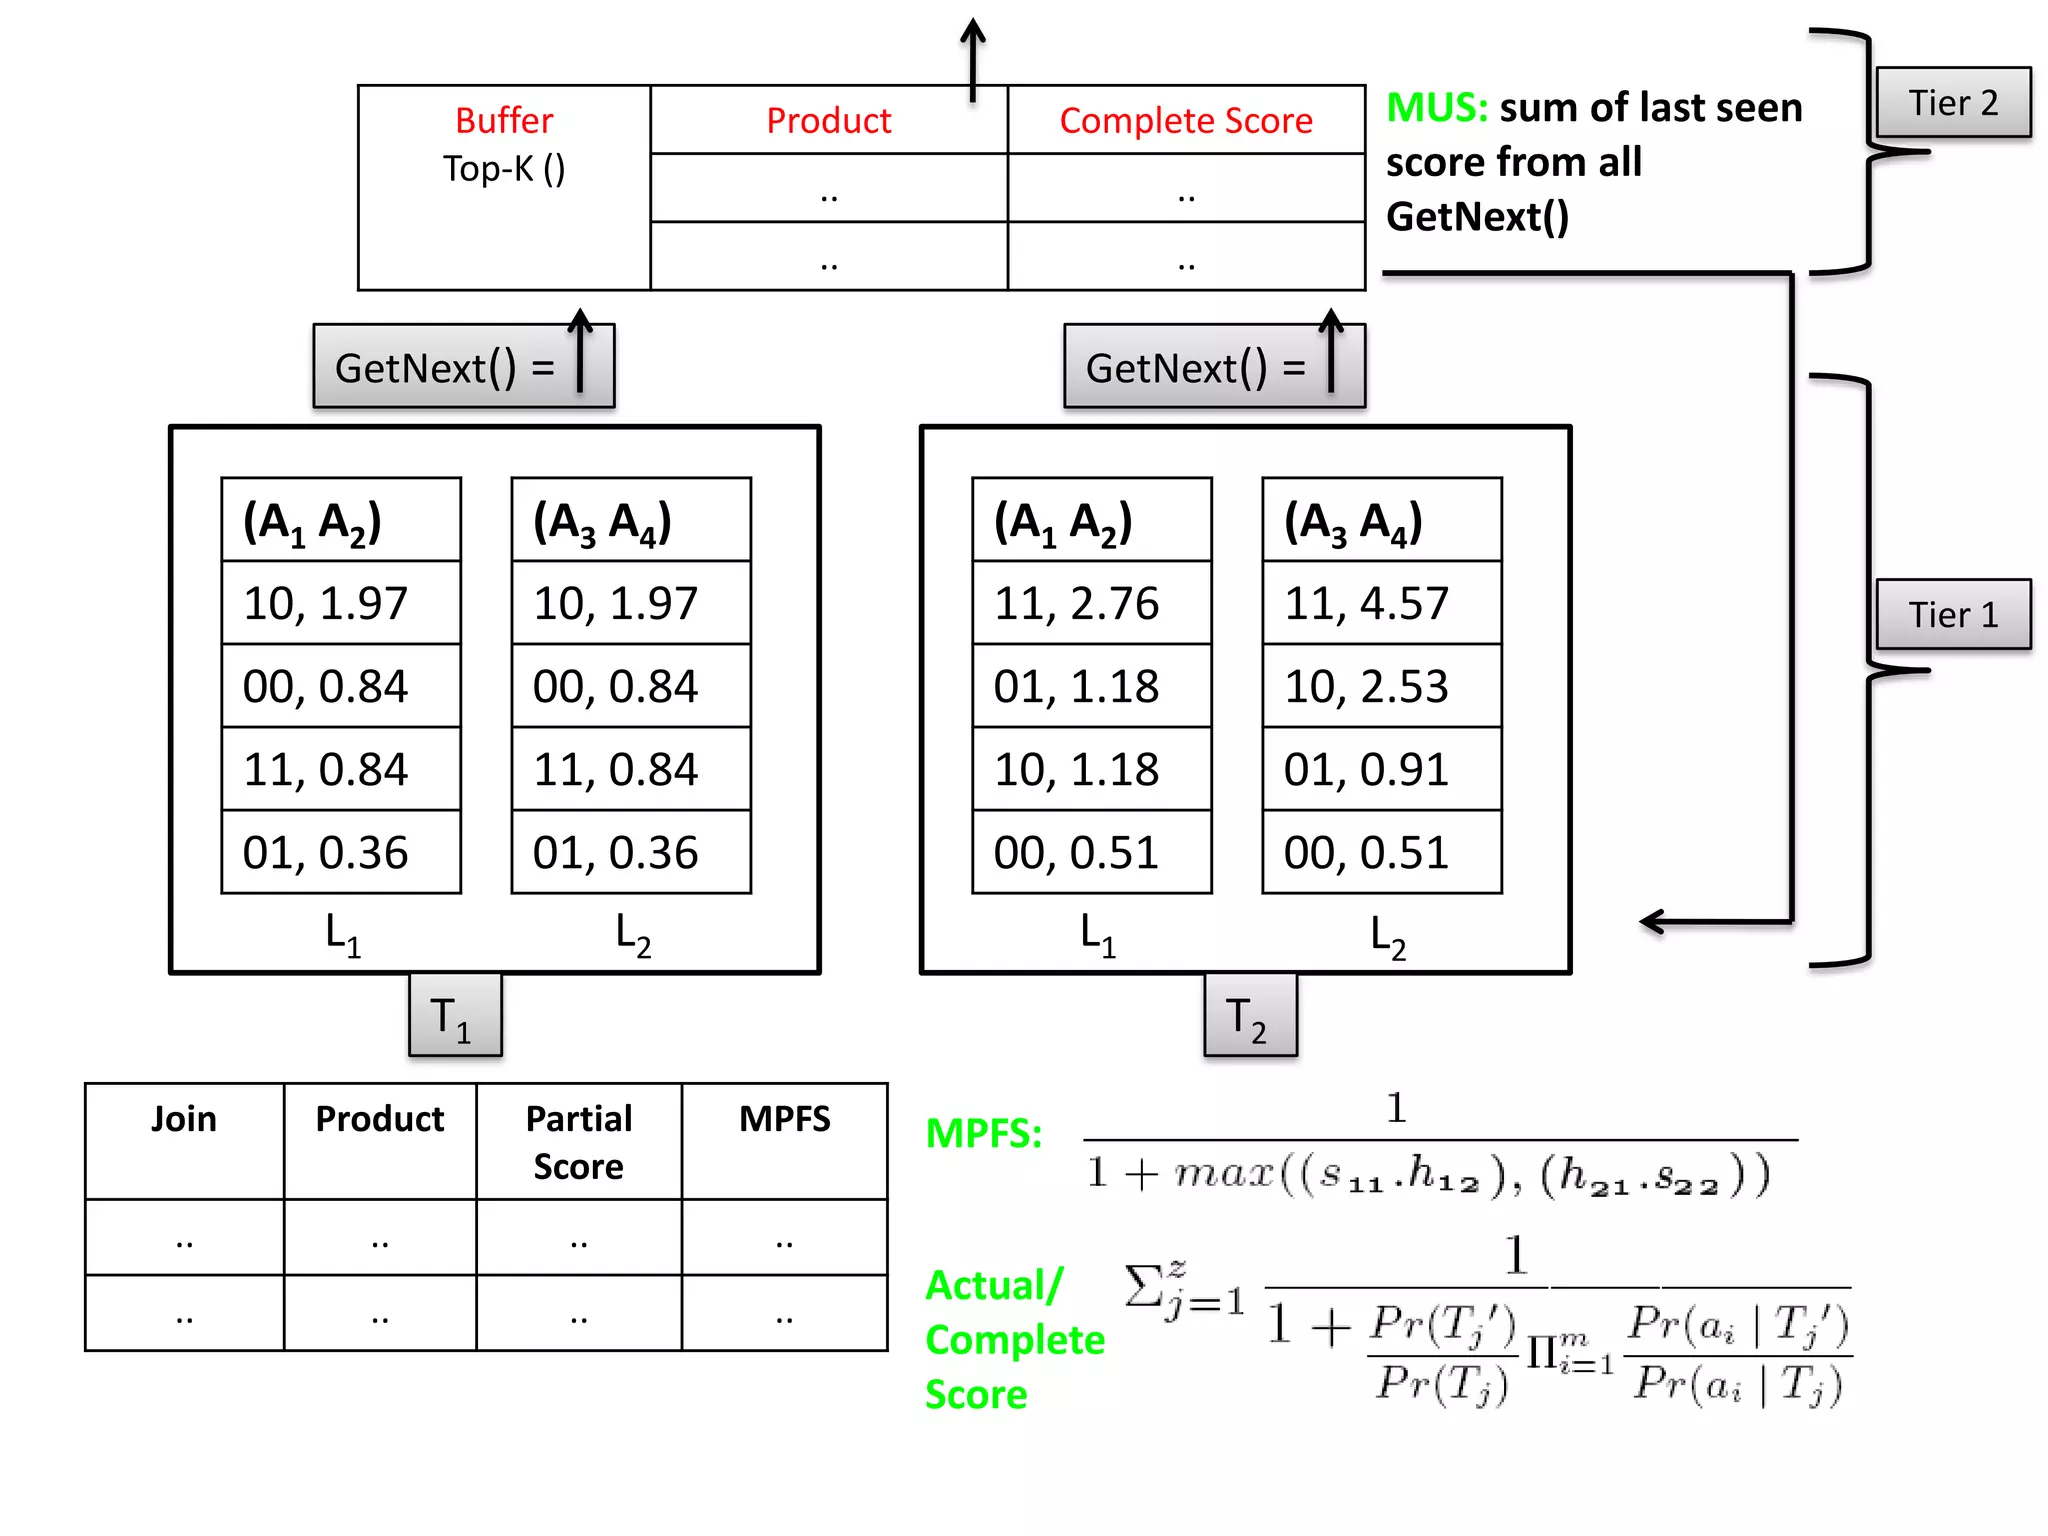
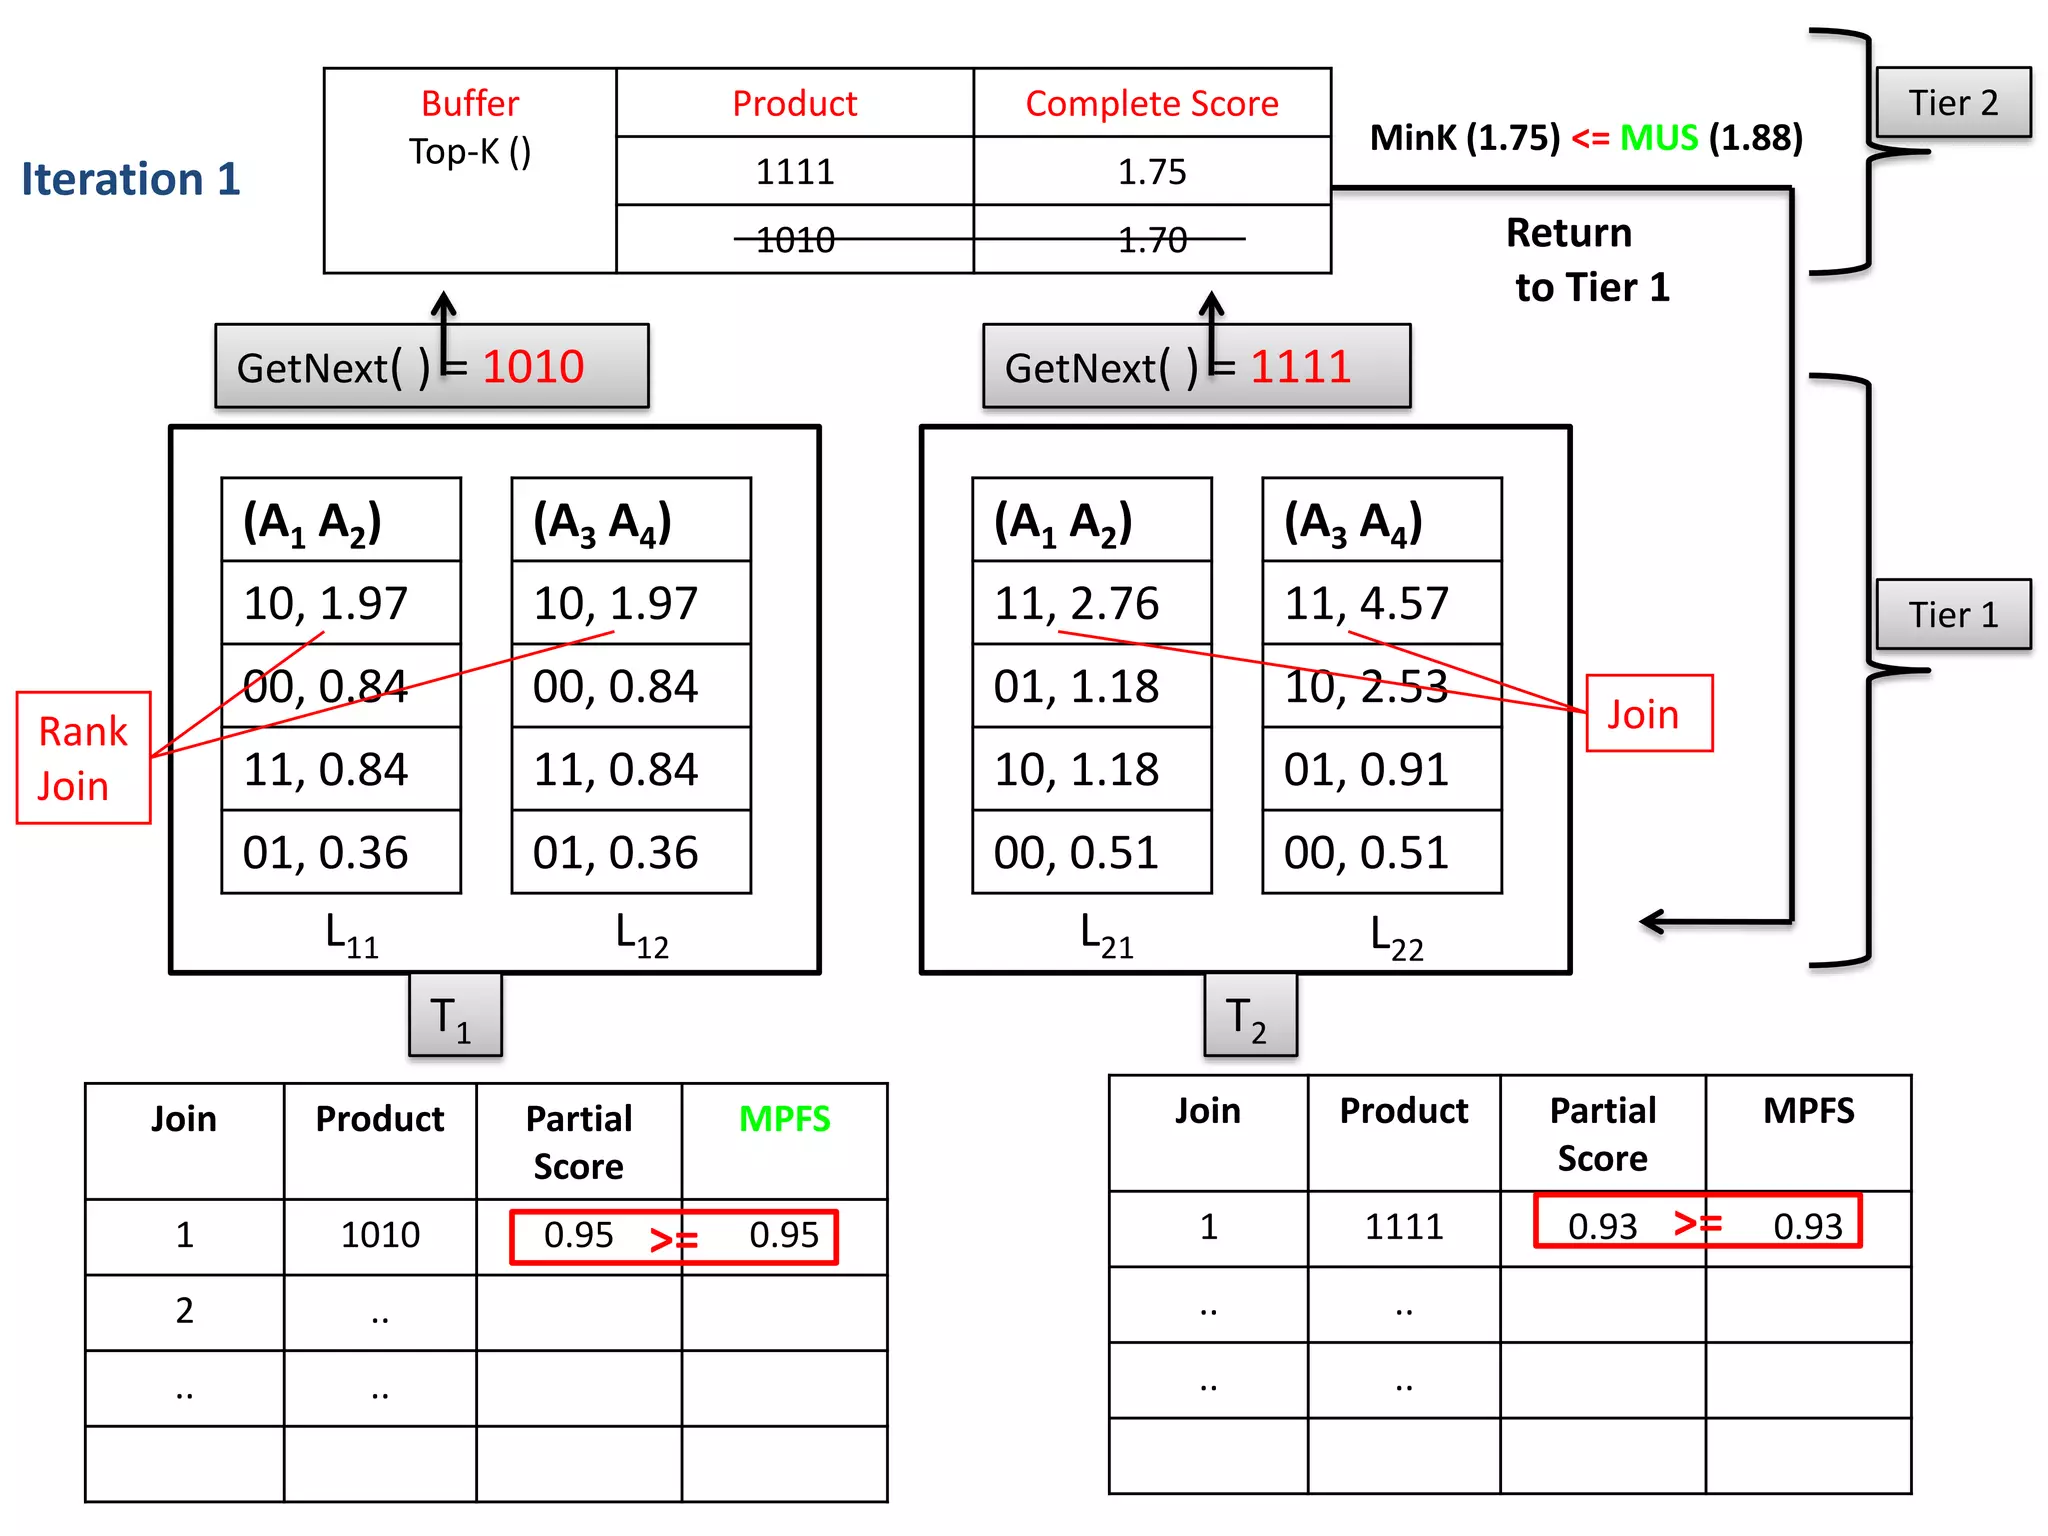
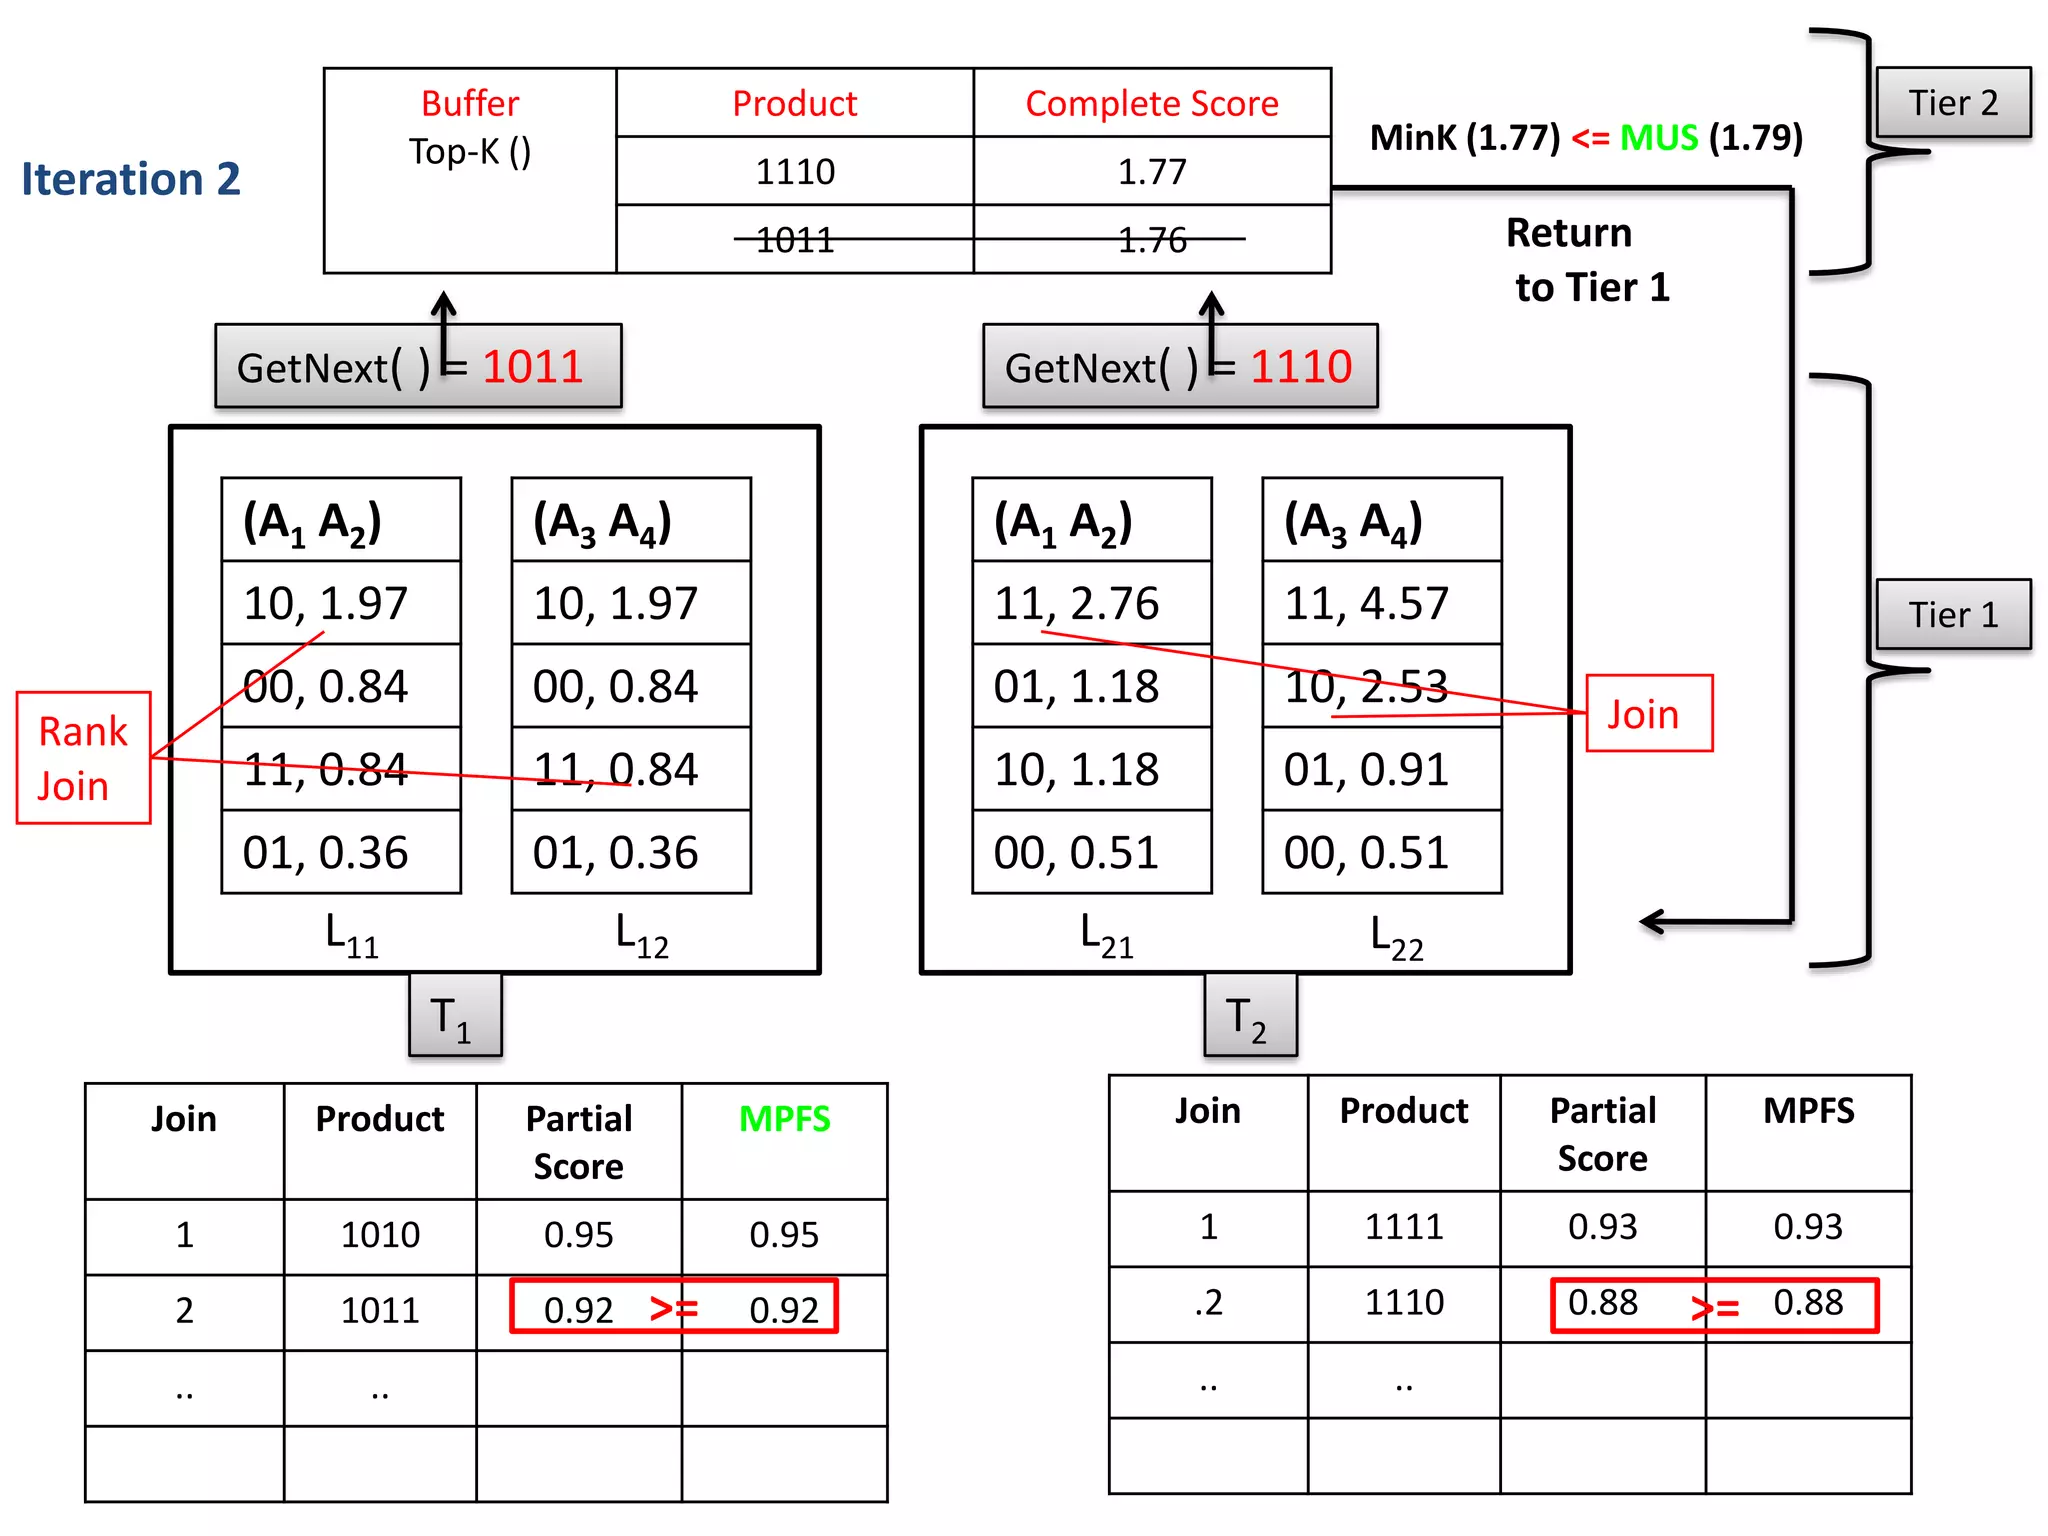
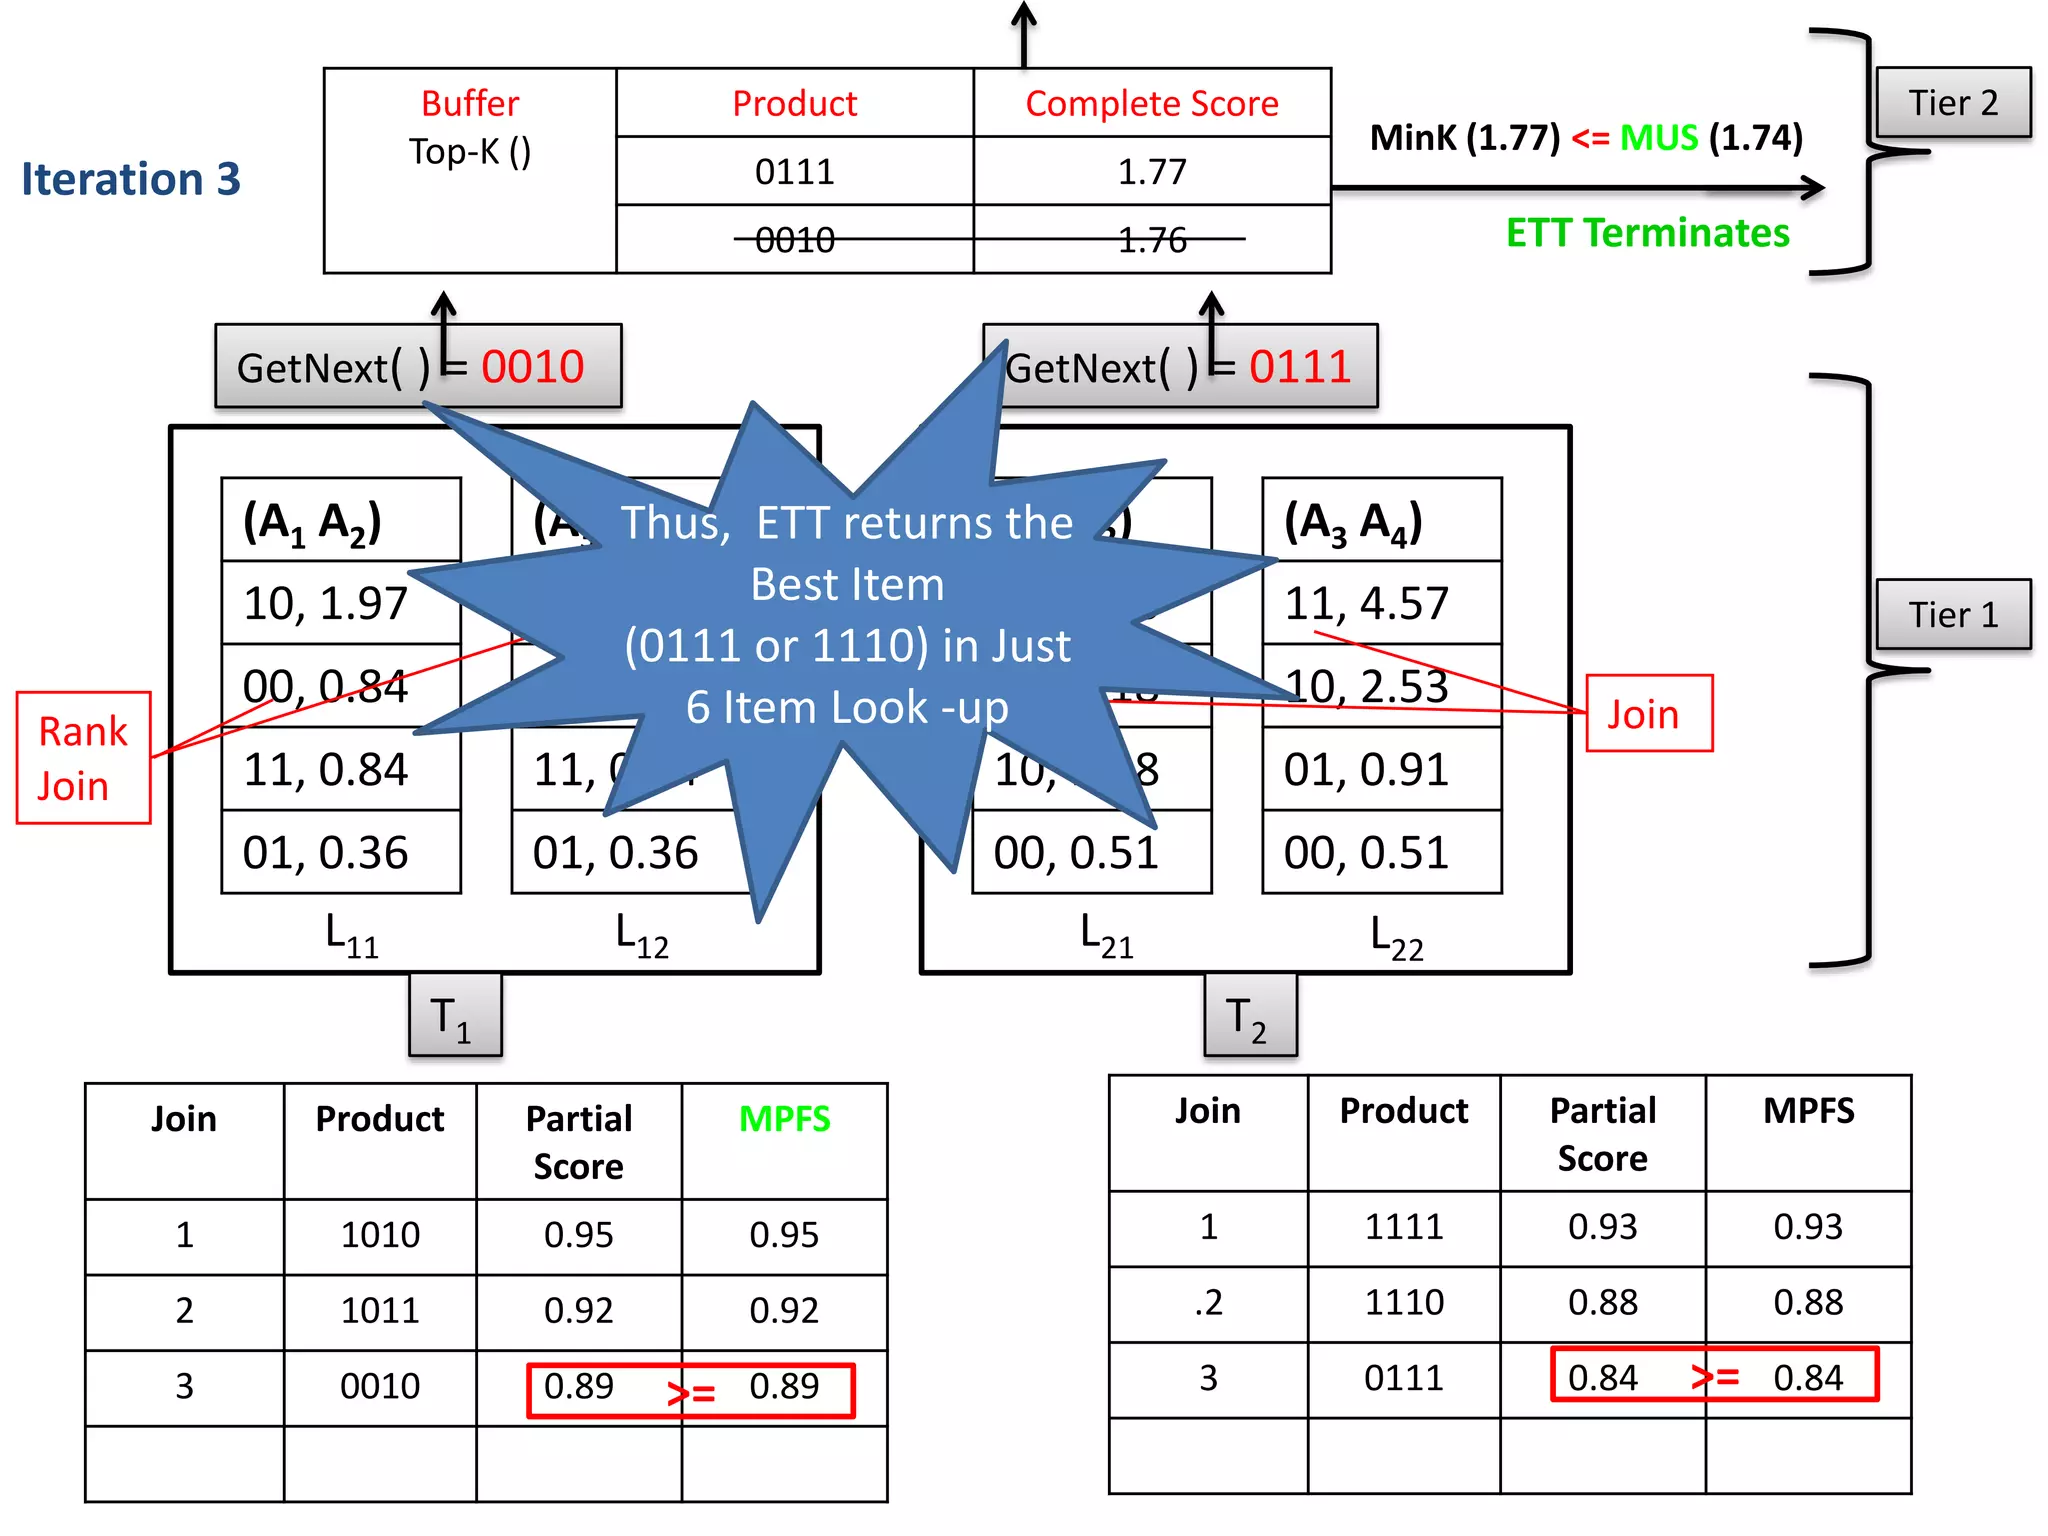
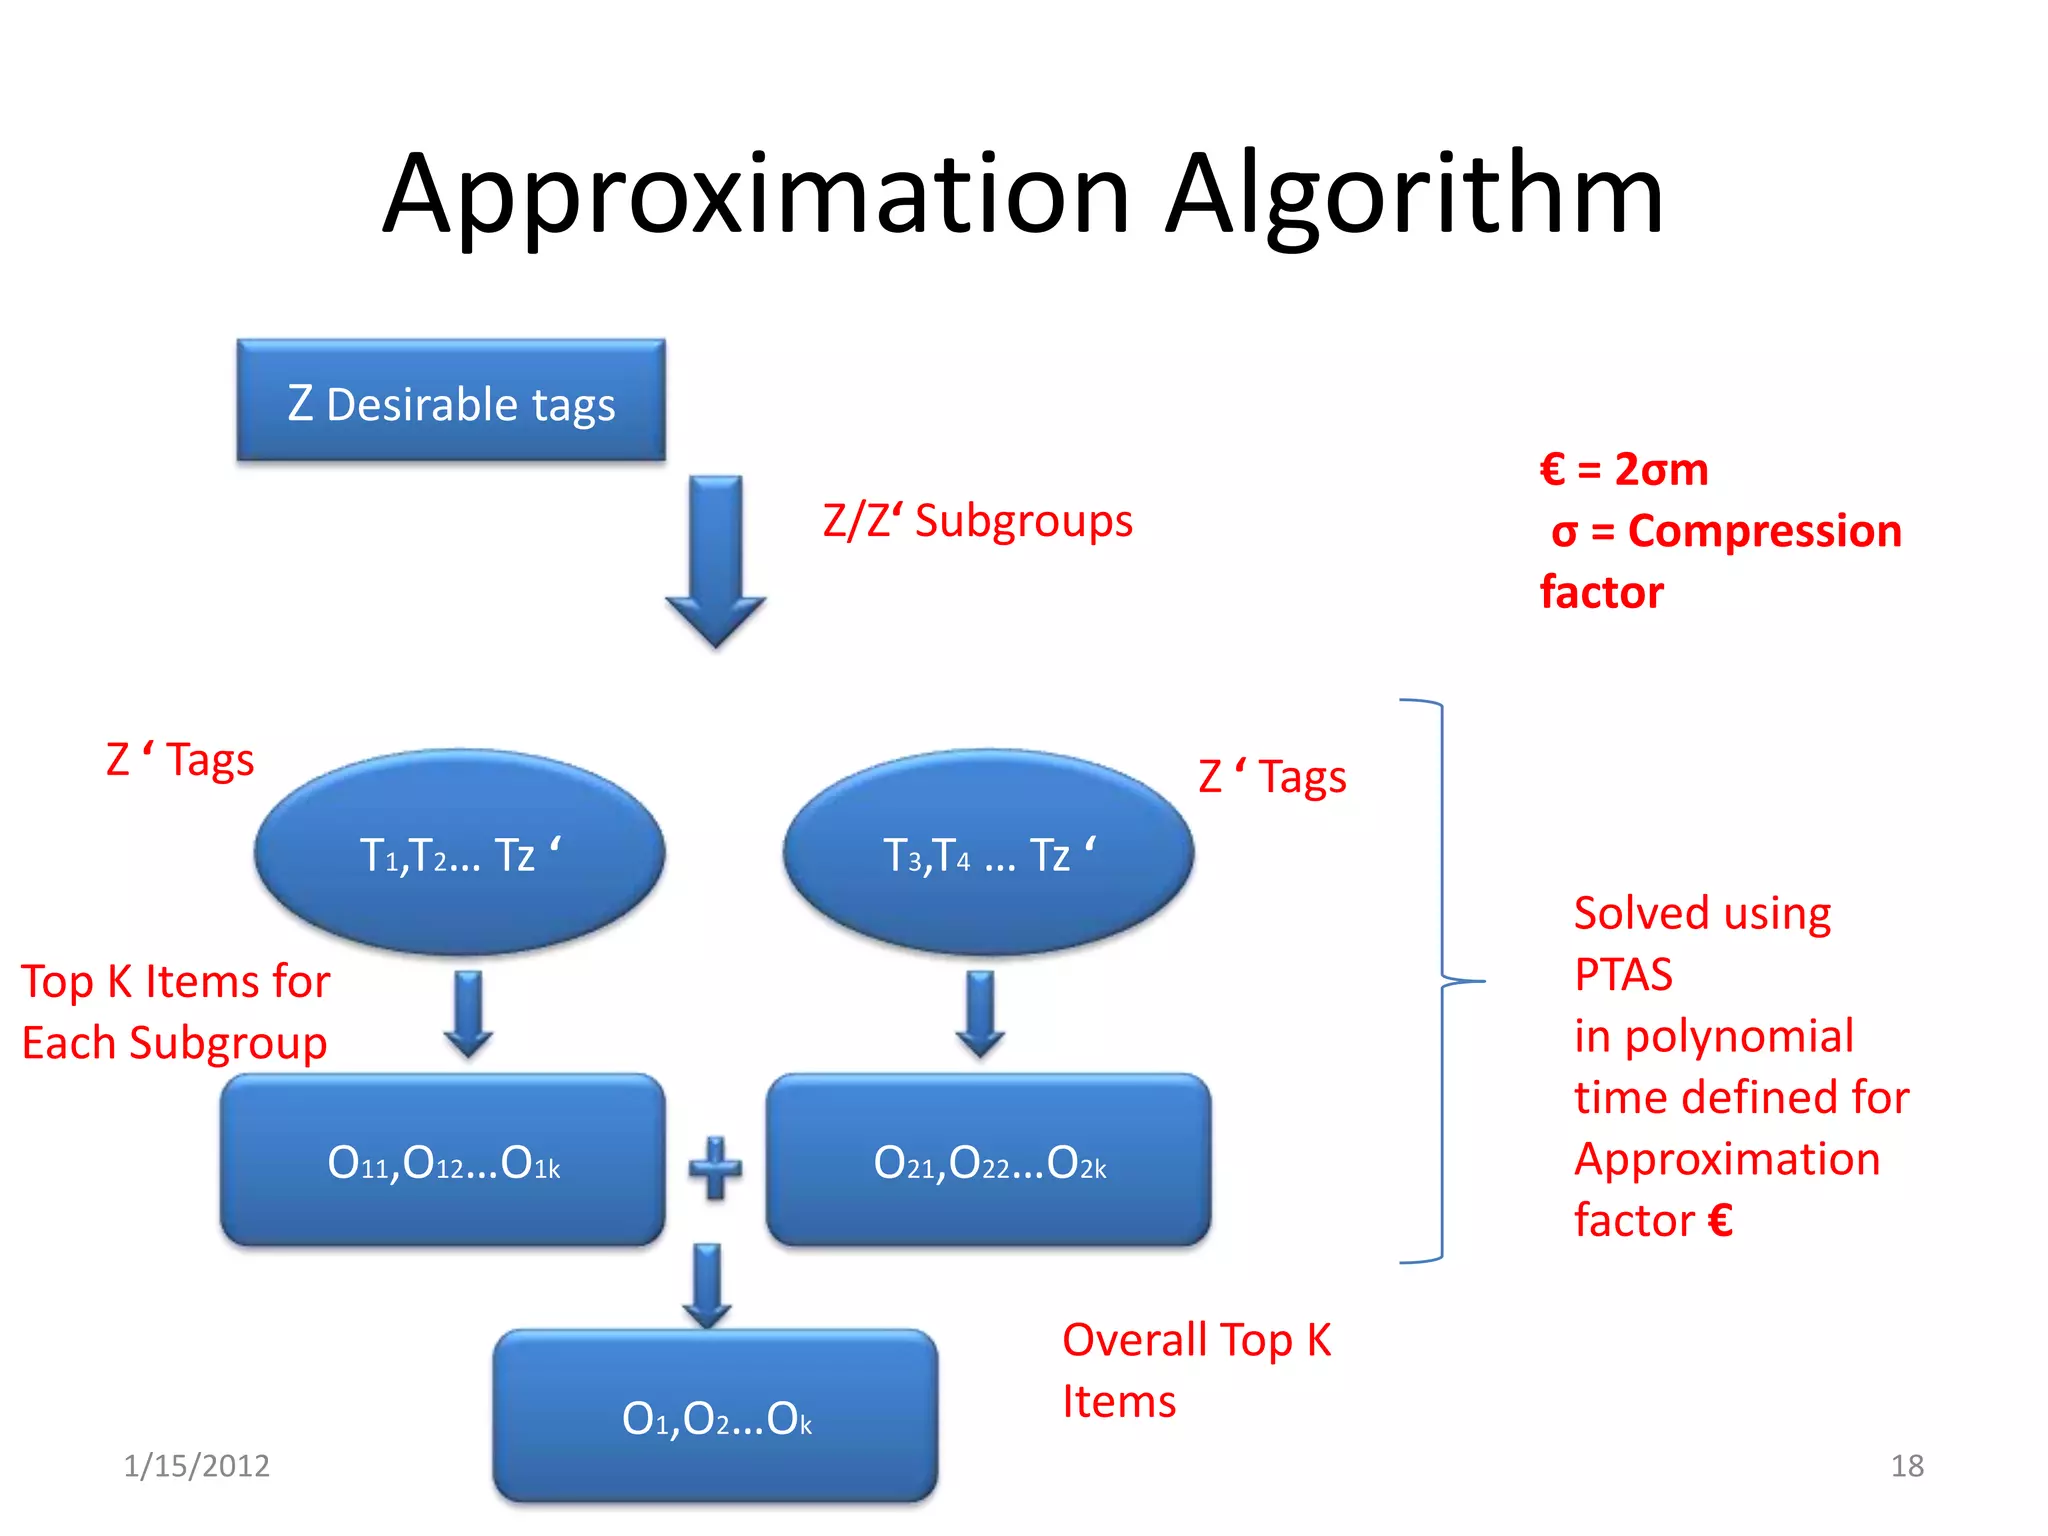
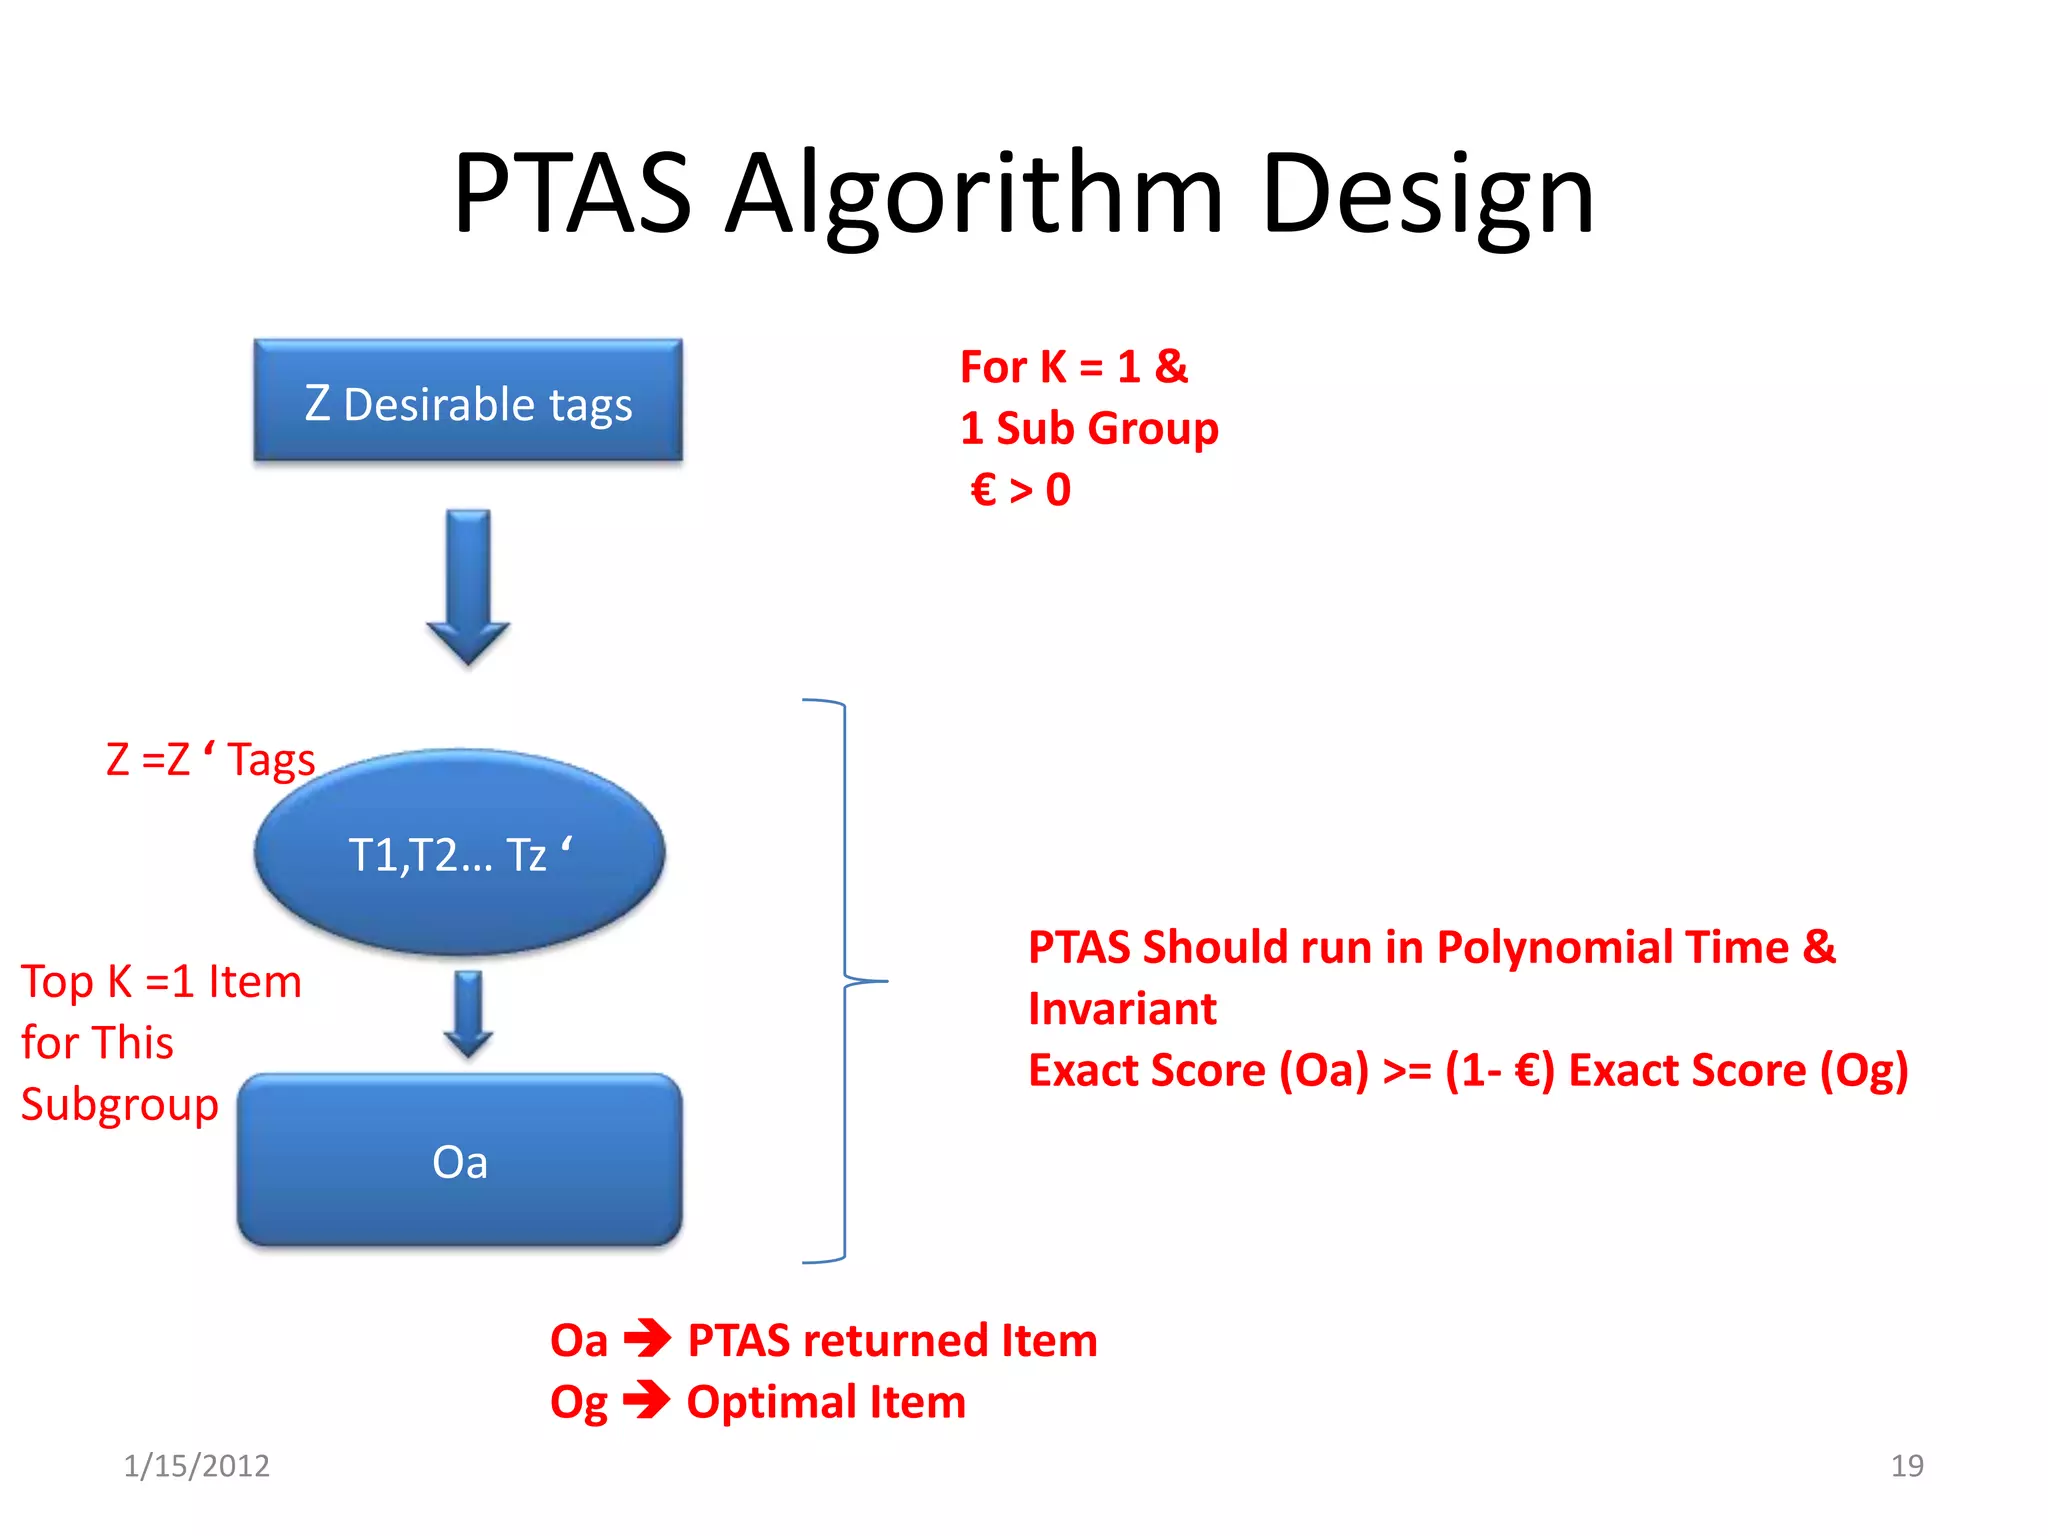
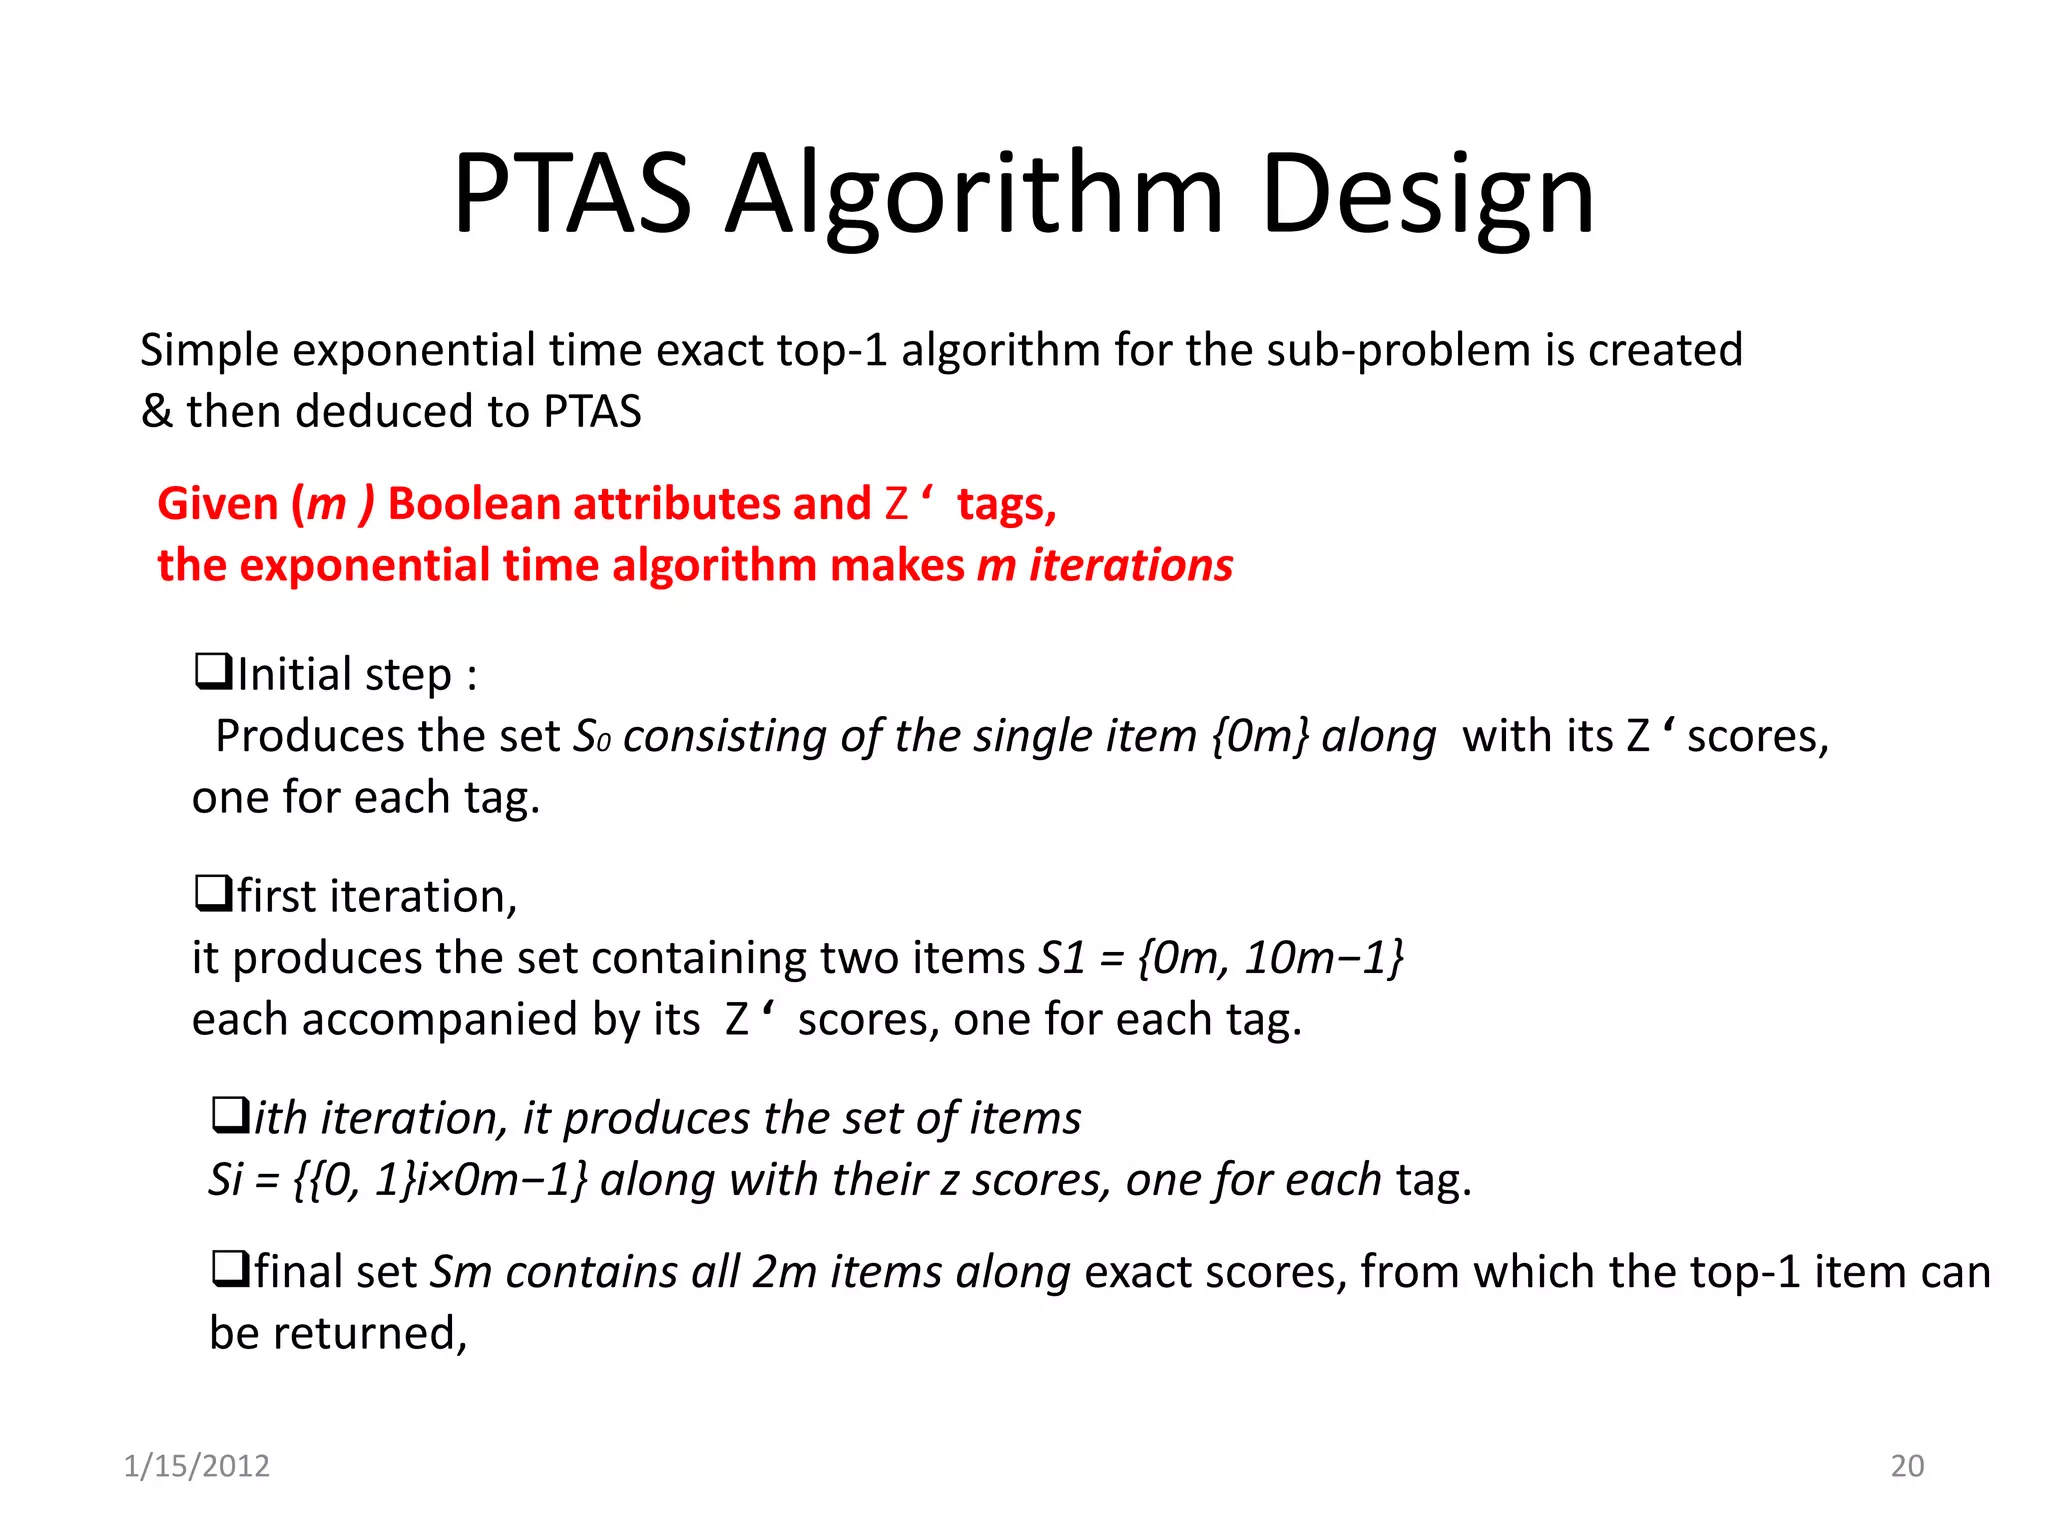
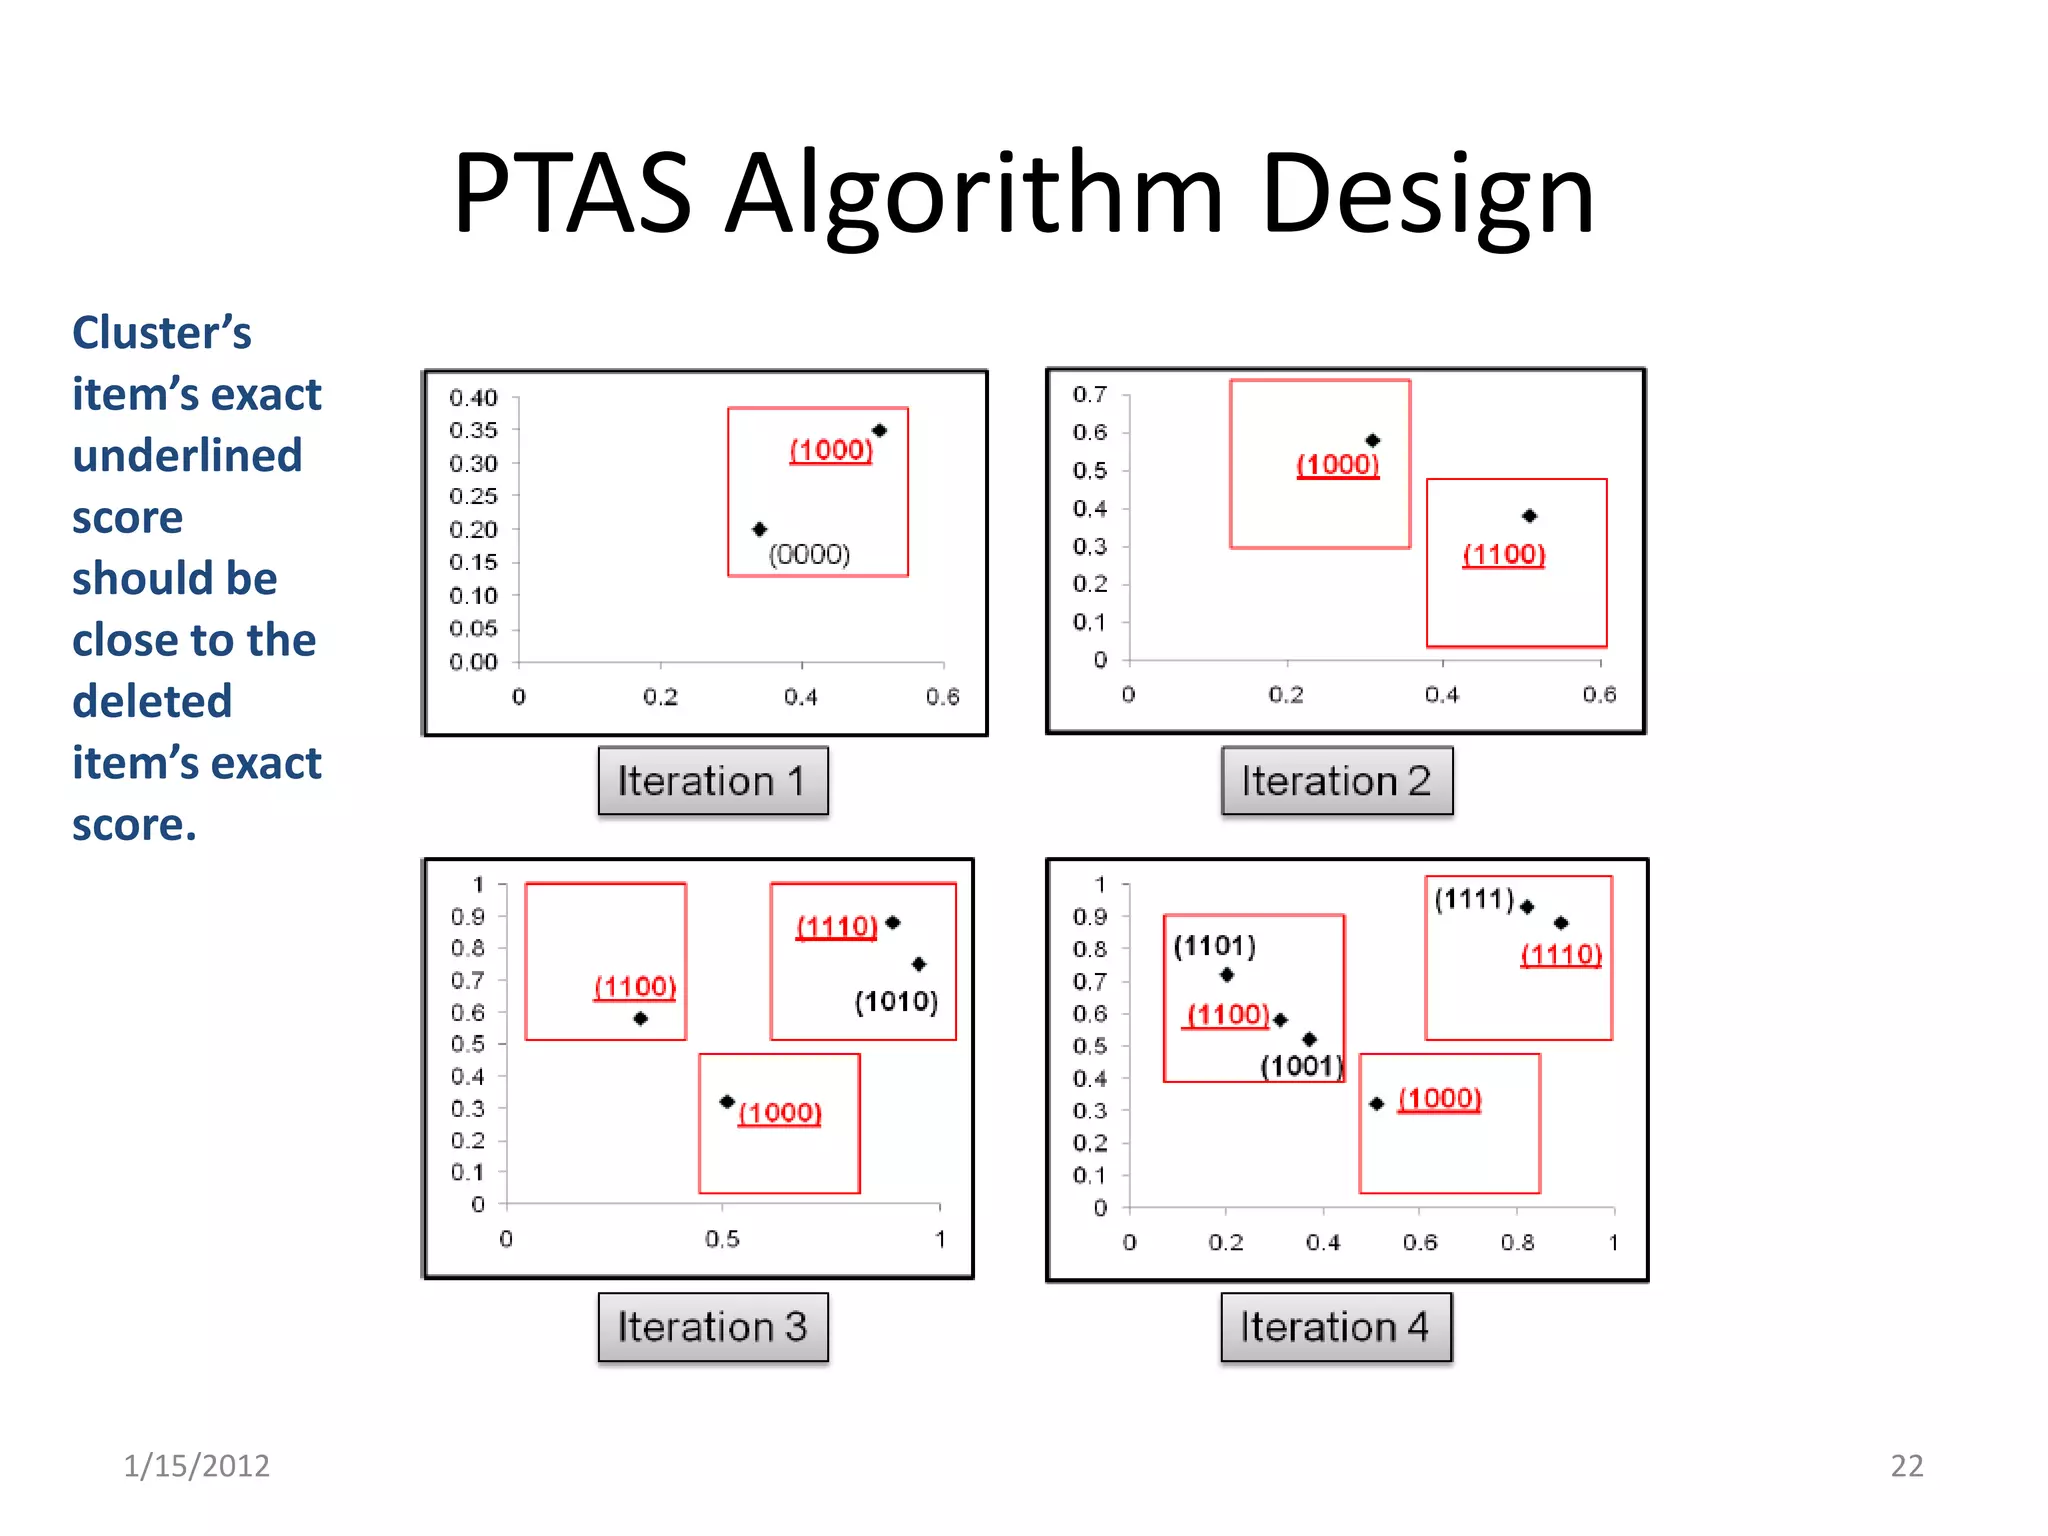
![PTAS Algorithm Design
Consider this Table
Z = Z‘ = 2
σ = 0.5
m=4
€ = (2σm) = 4
Og = {1110} Oa = {1111}
[1.77] = [0.89+0.88] [1.75] = [0.82+0.93]
1/15/2012 21](https://image.slidesharecdn.com/leveragingcollaborativetaggingforwebitemdesignajithajjarani-120116013020-phpapp02/75/Leveraging-collaborativetaggingforwebitemdesign-ajithajjarani-21-2048.jpg)
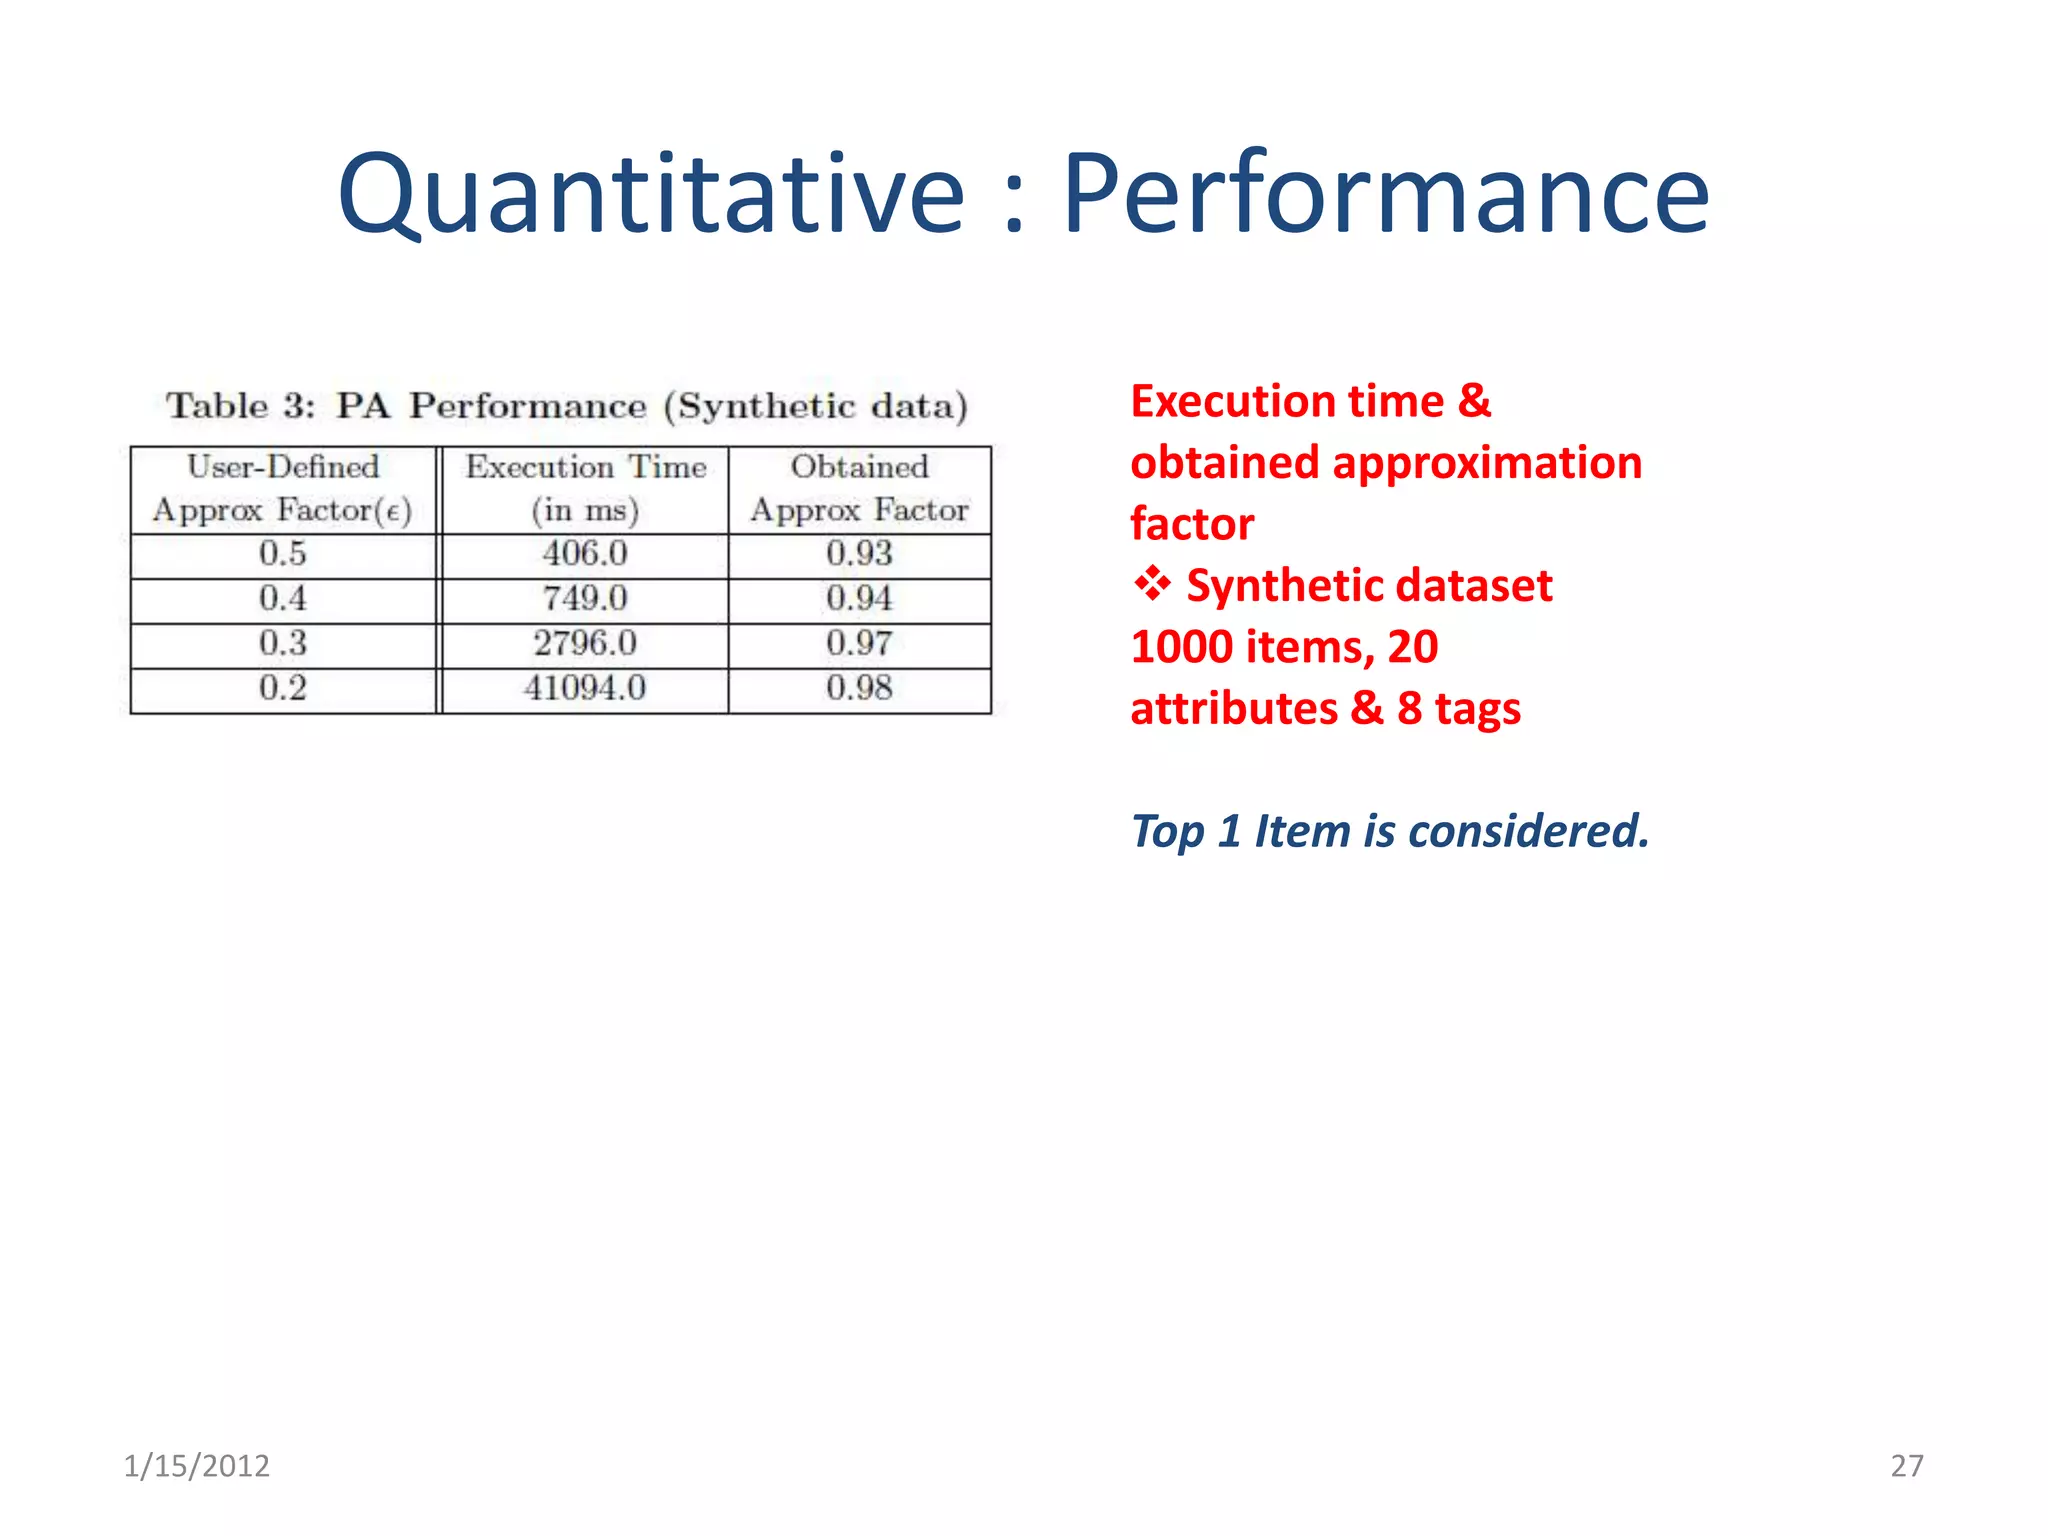


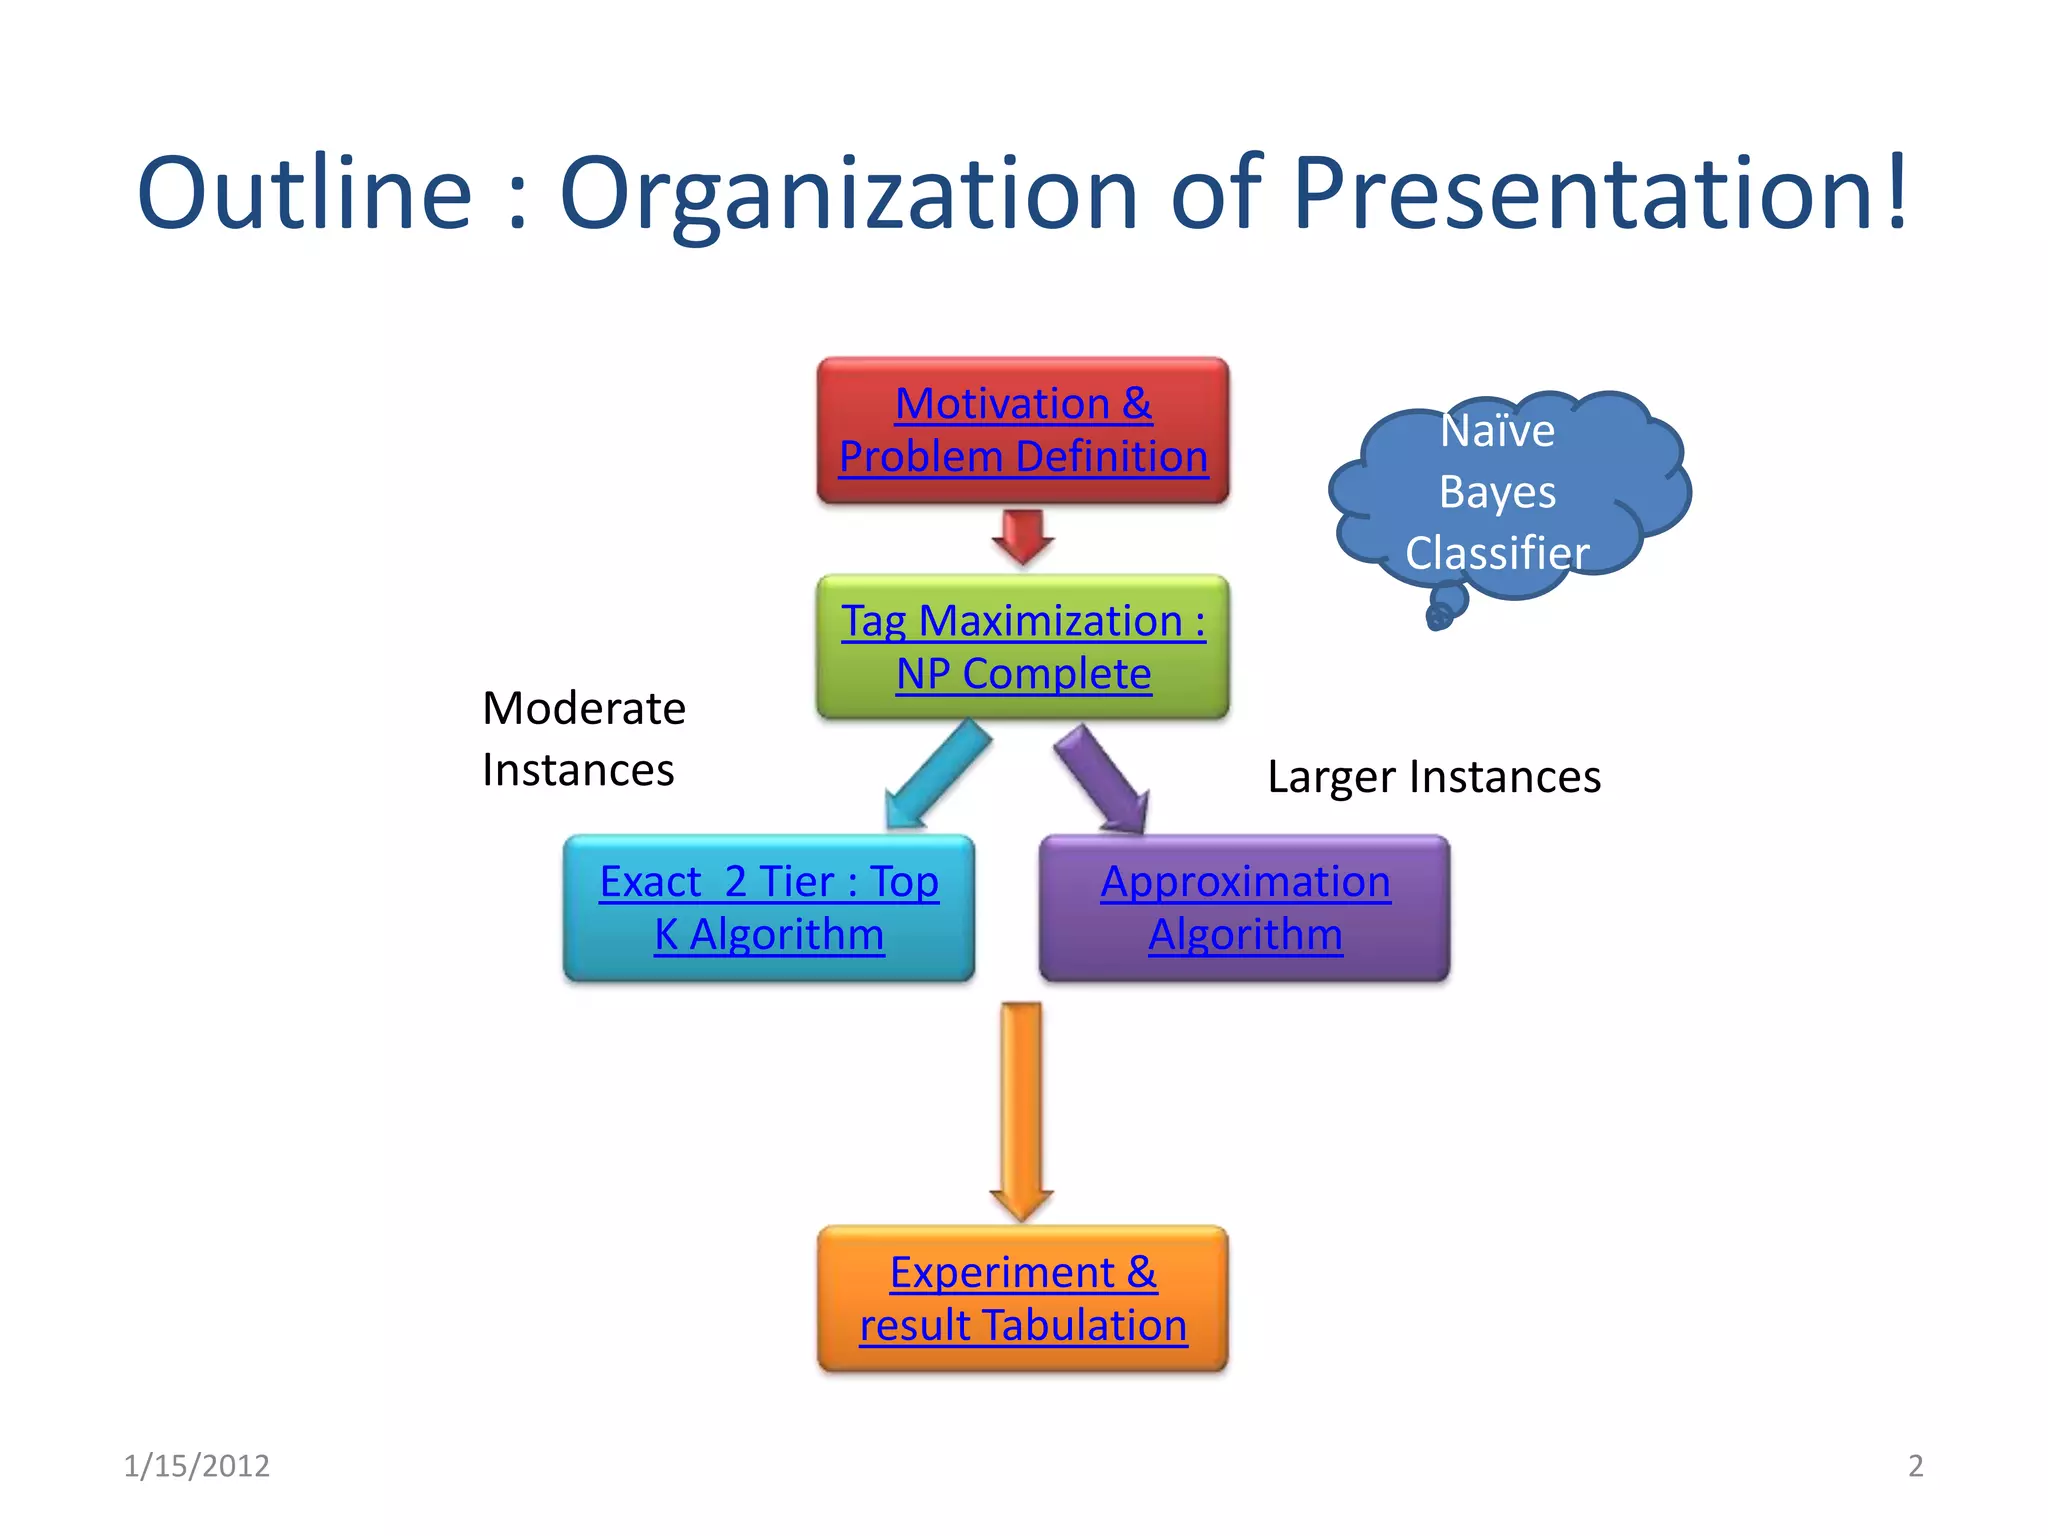
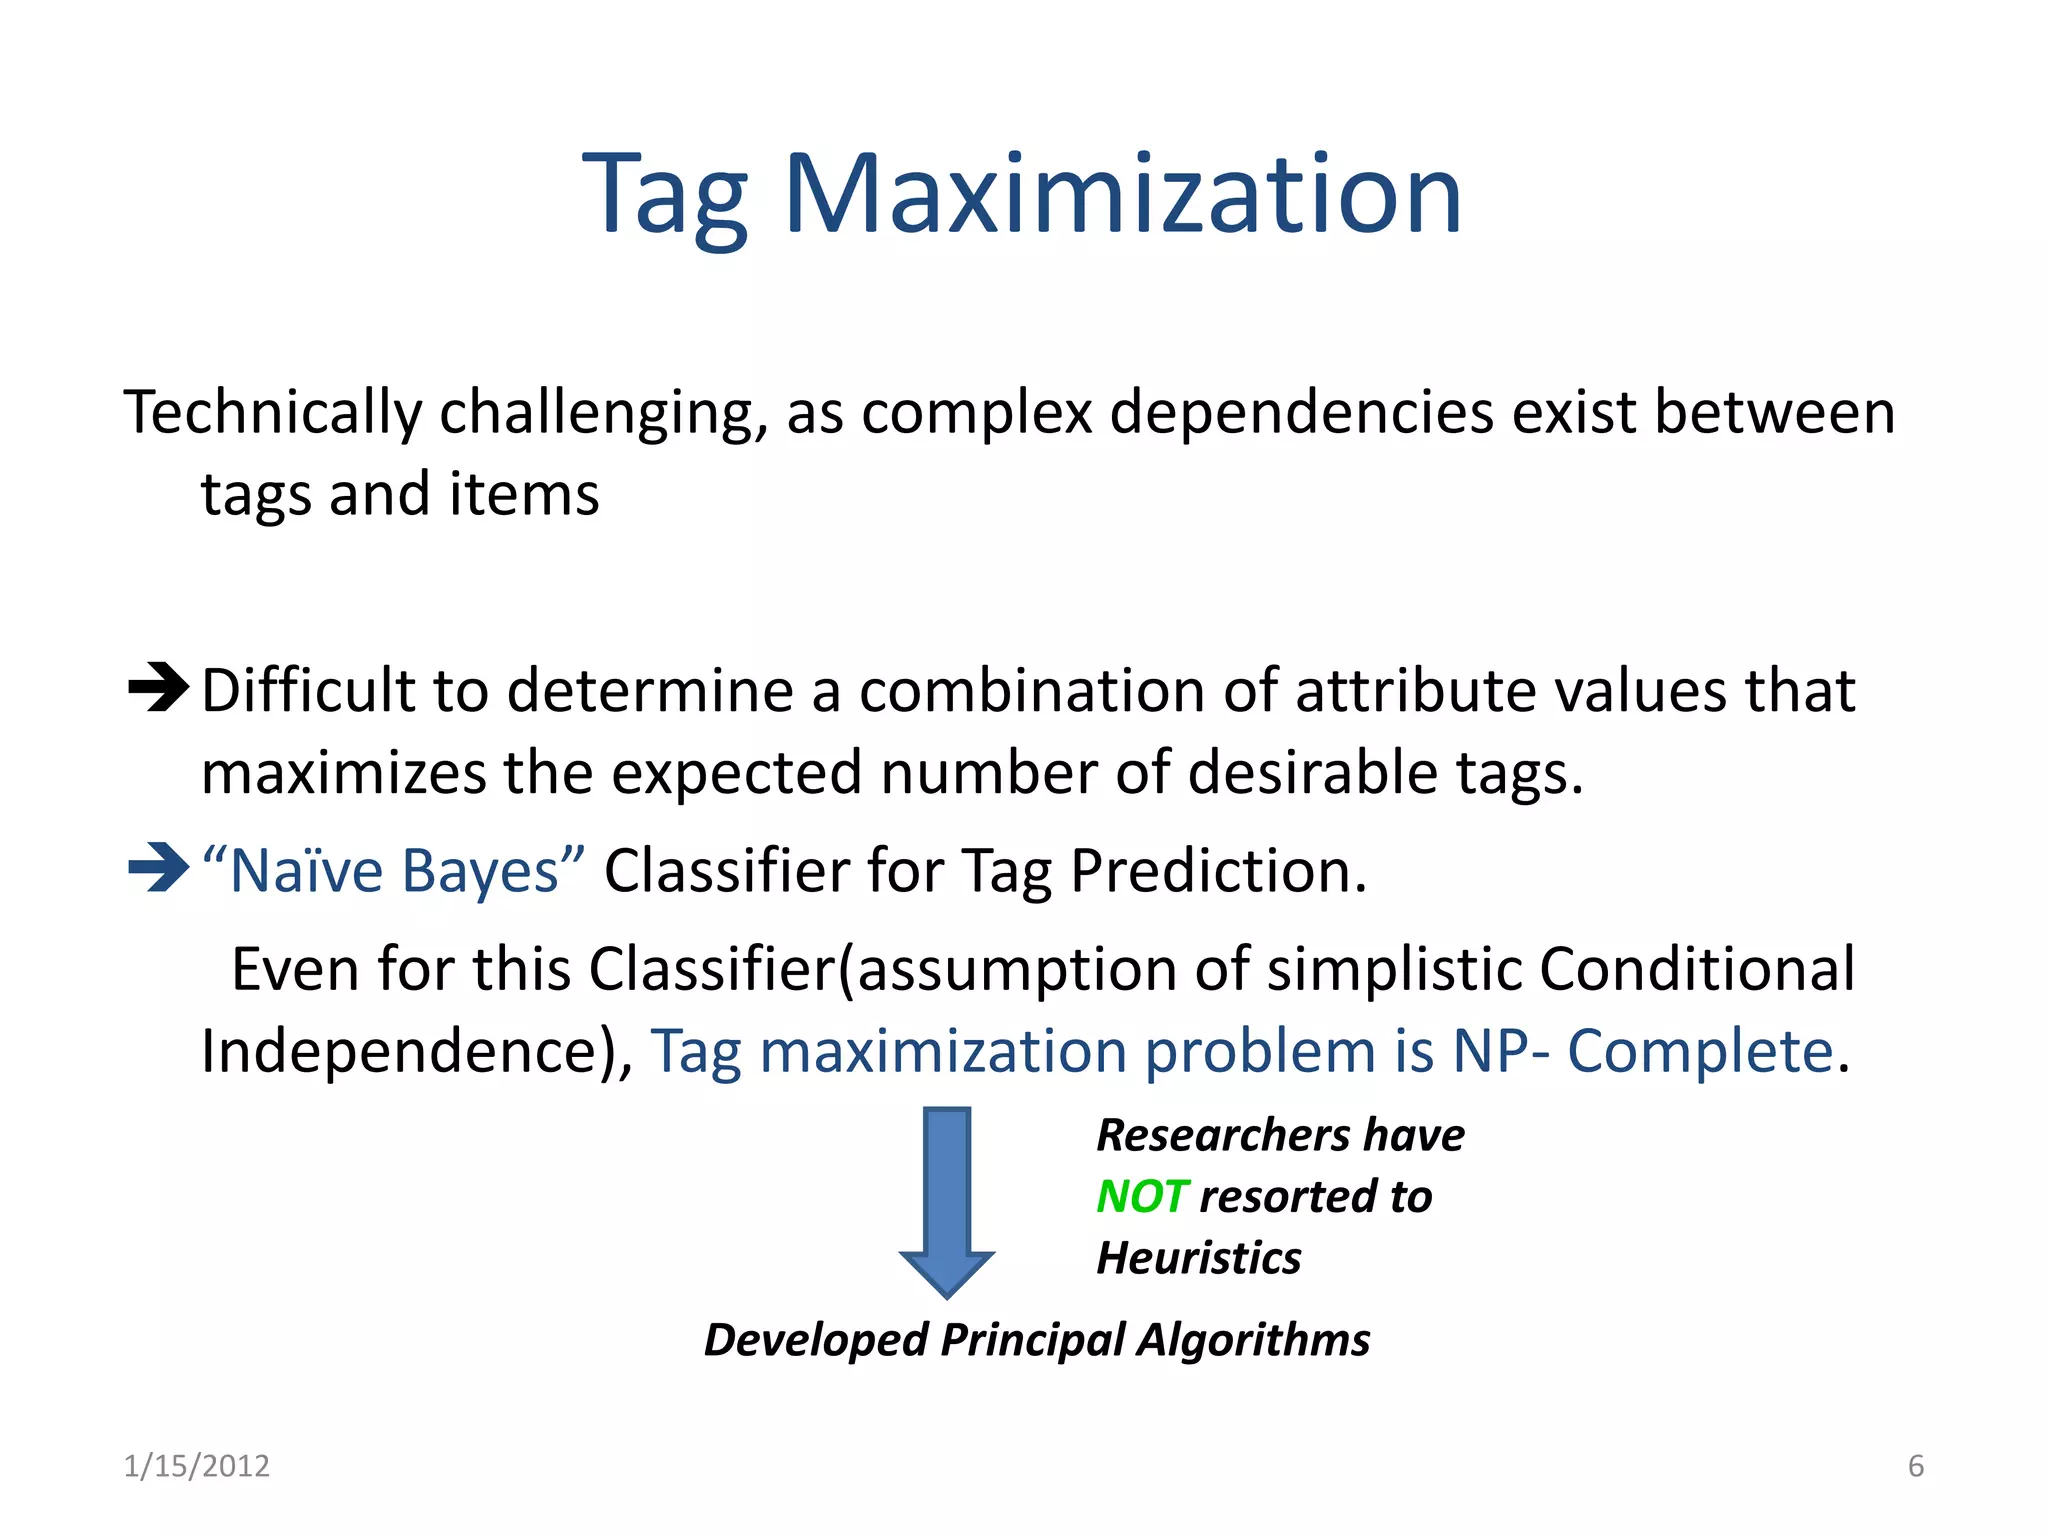
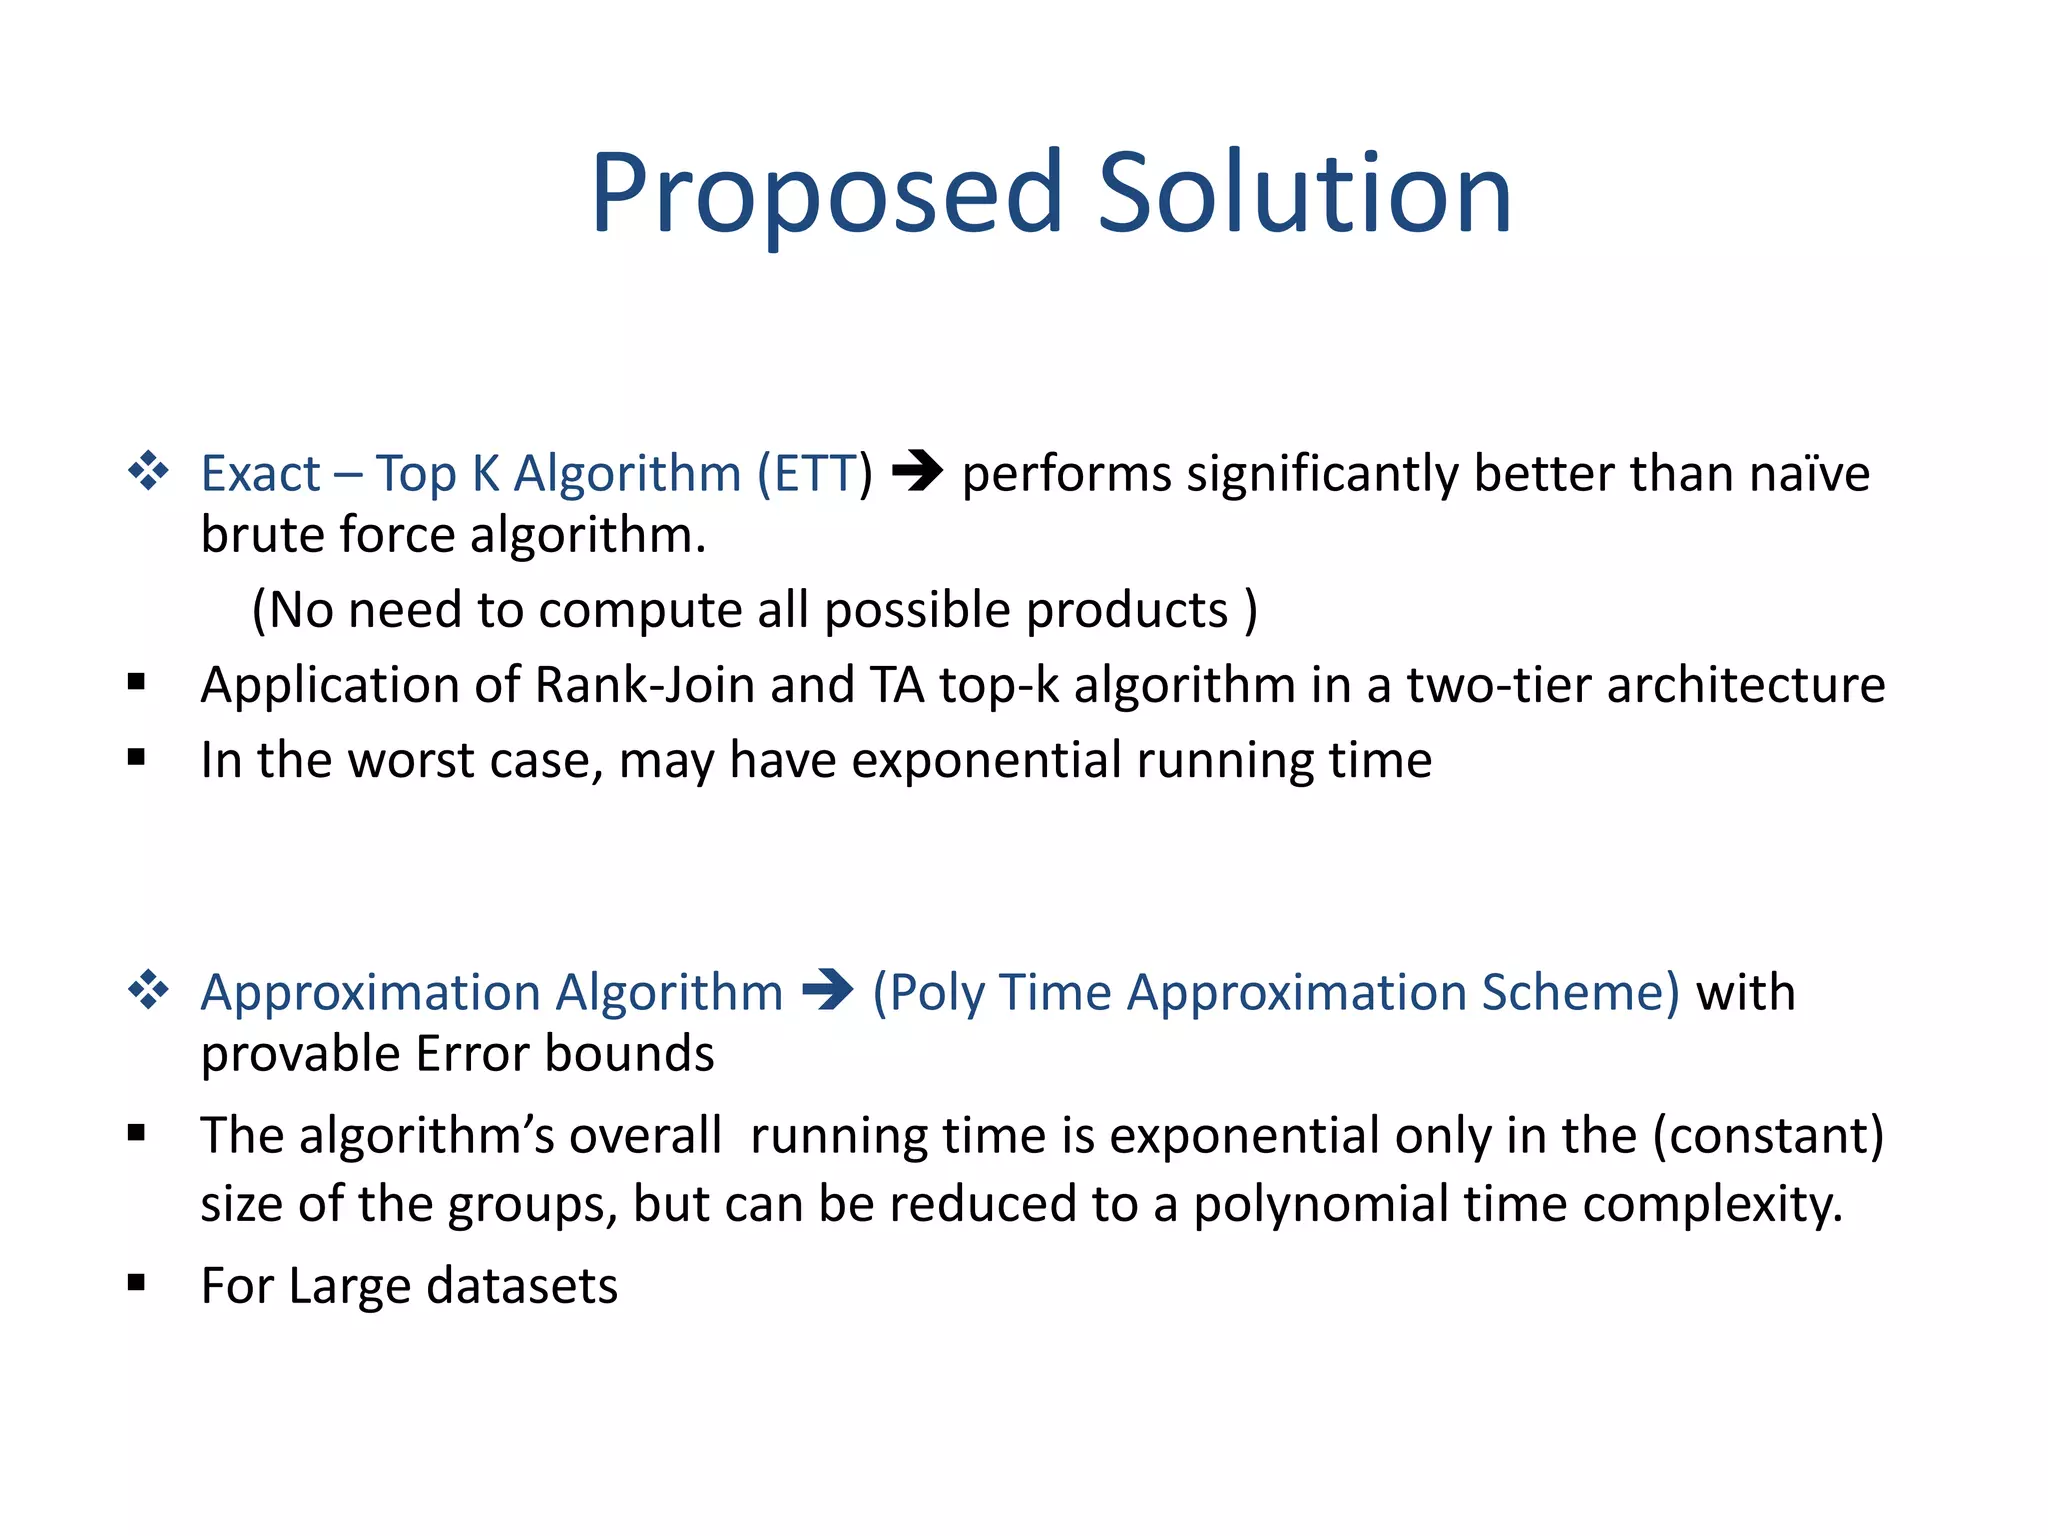
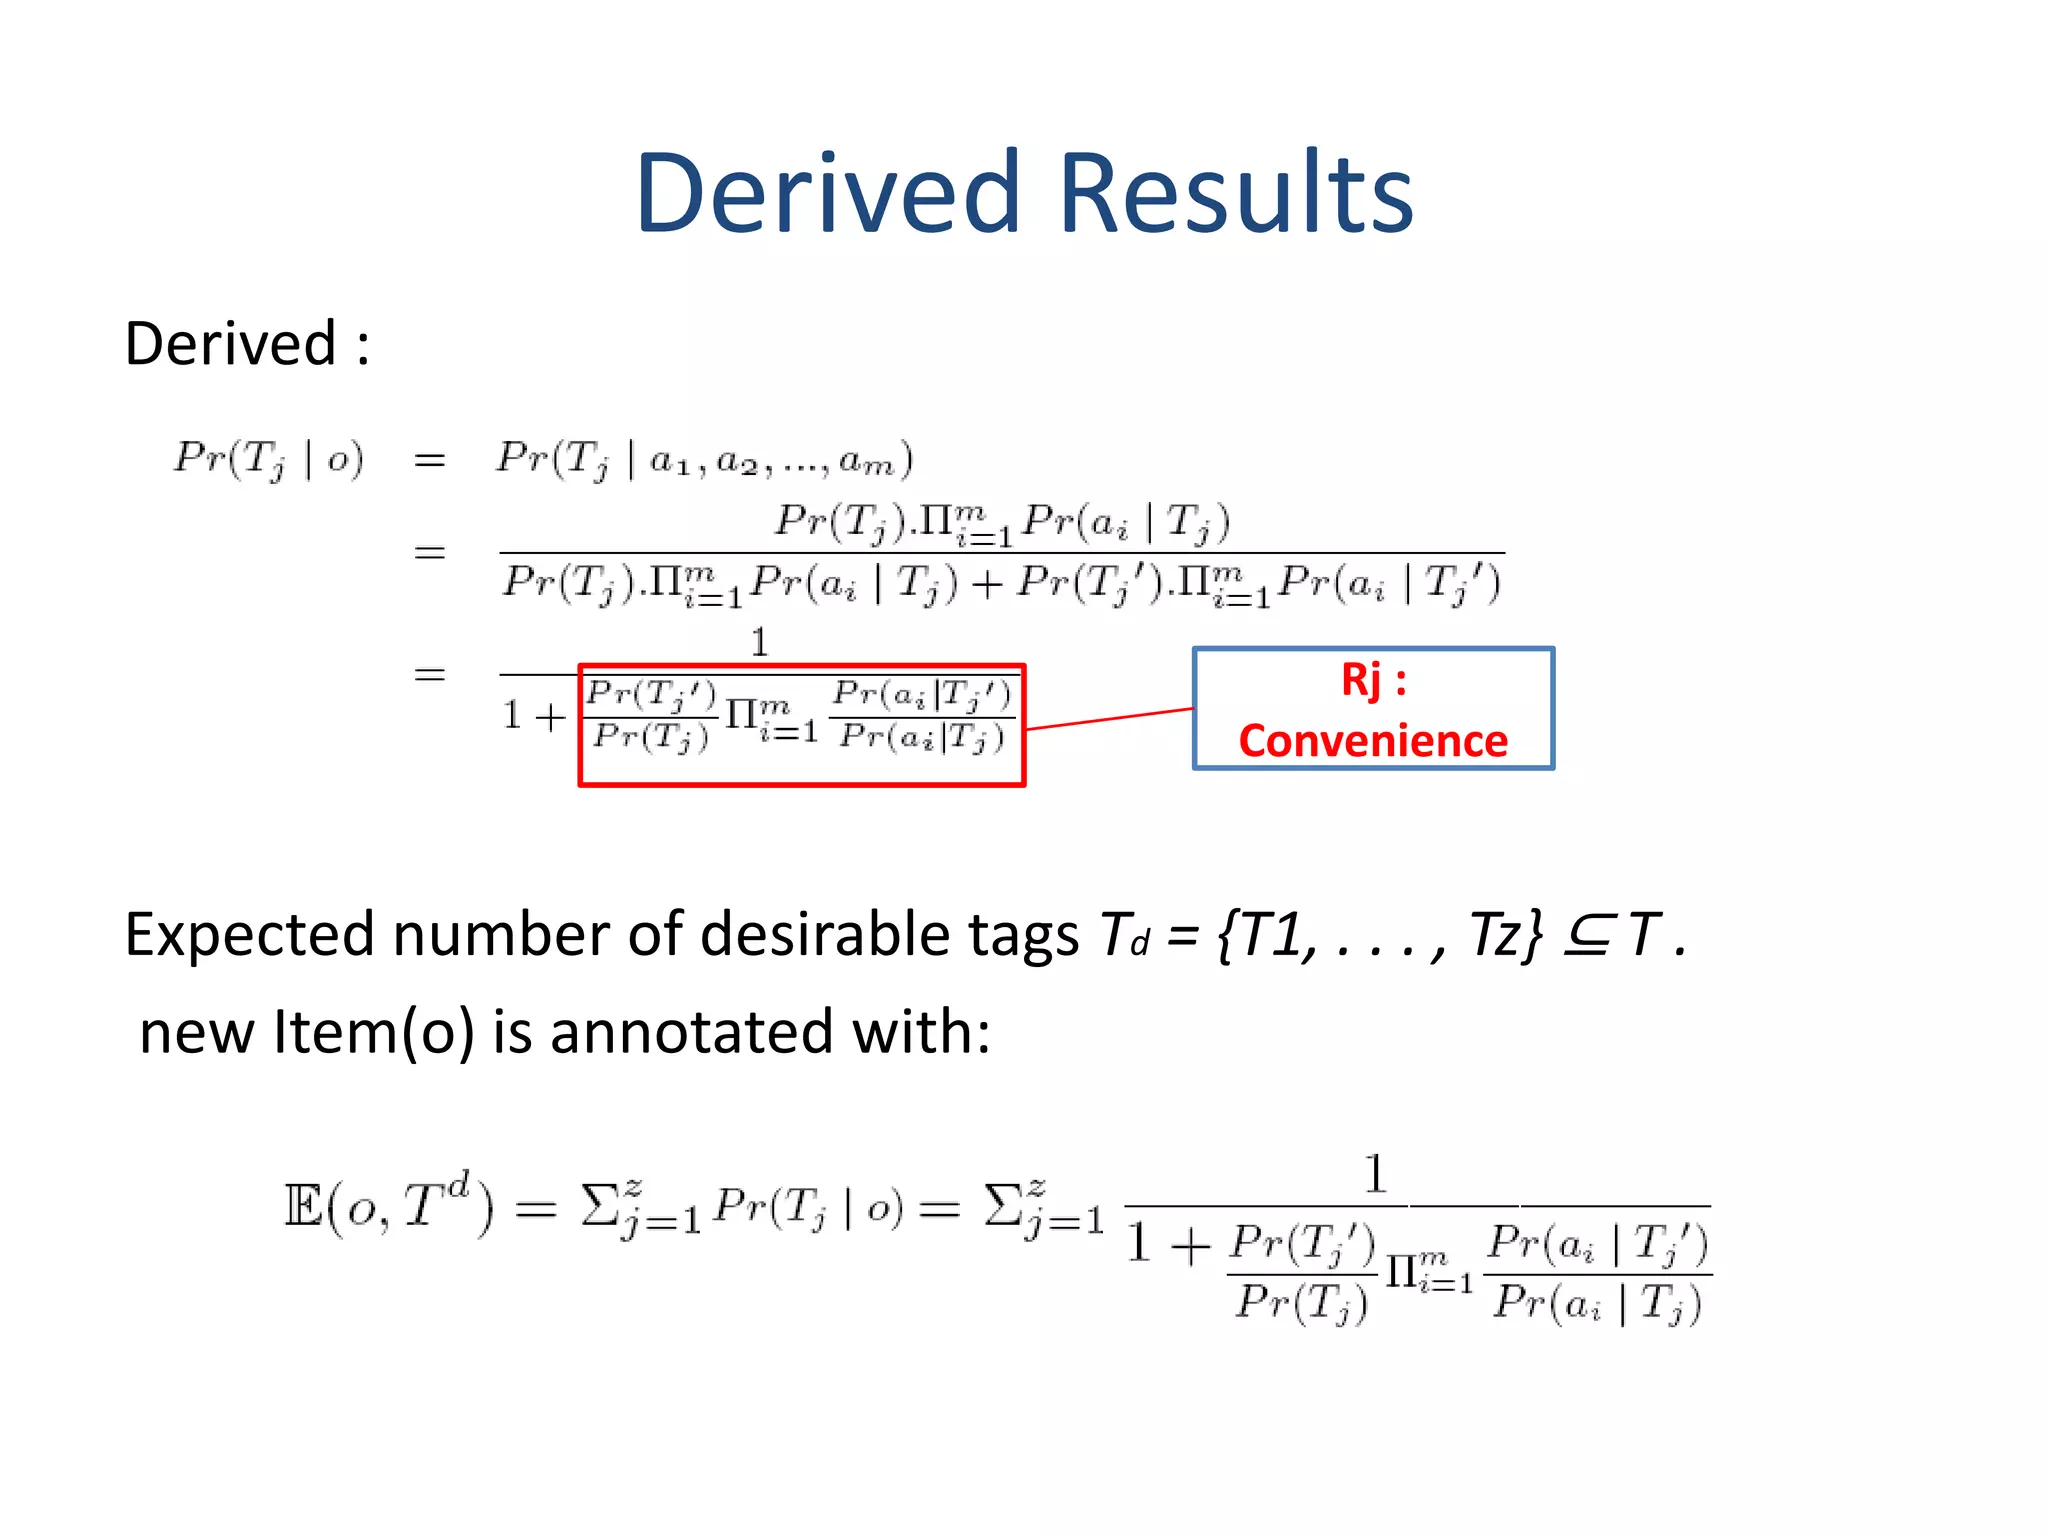
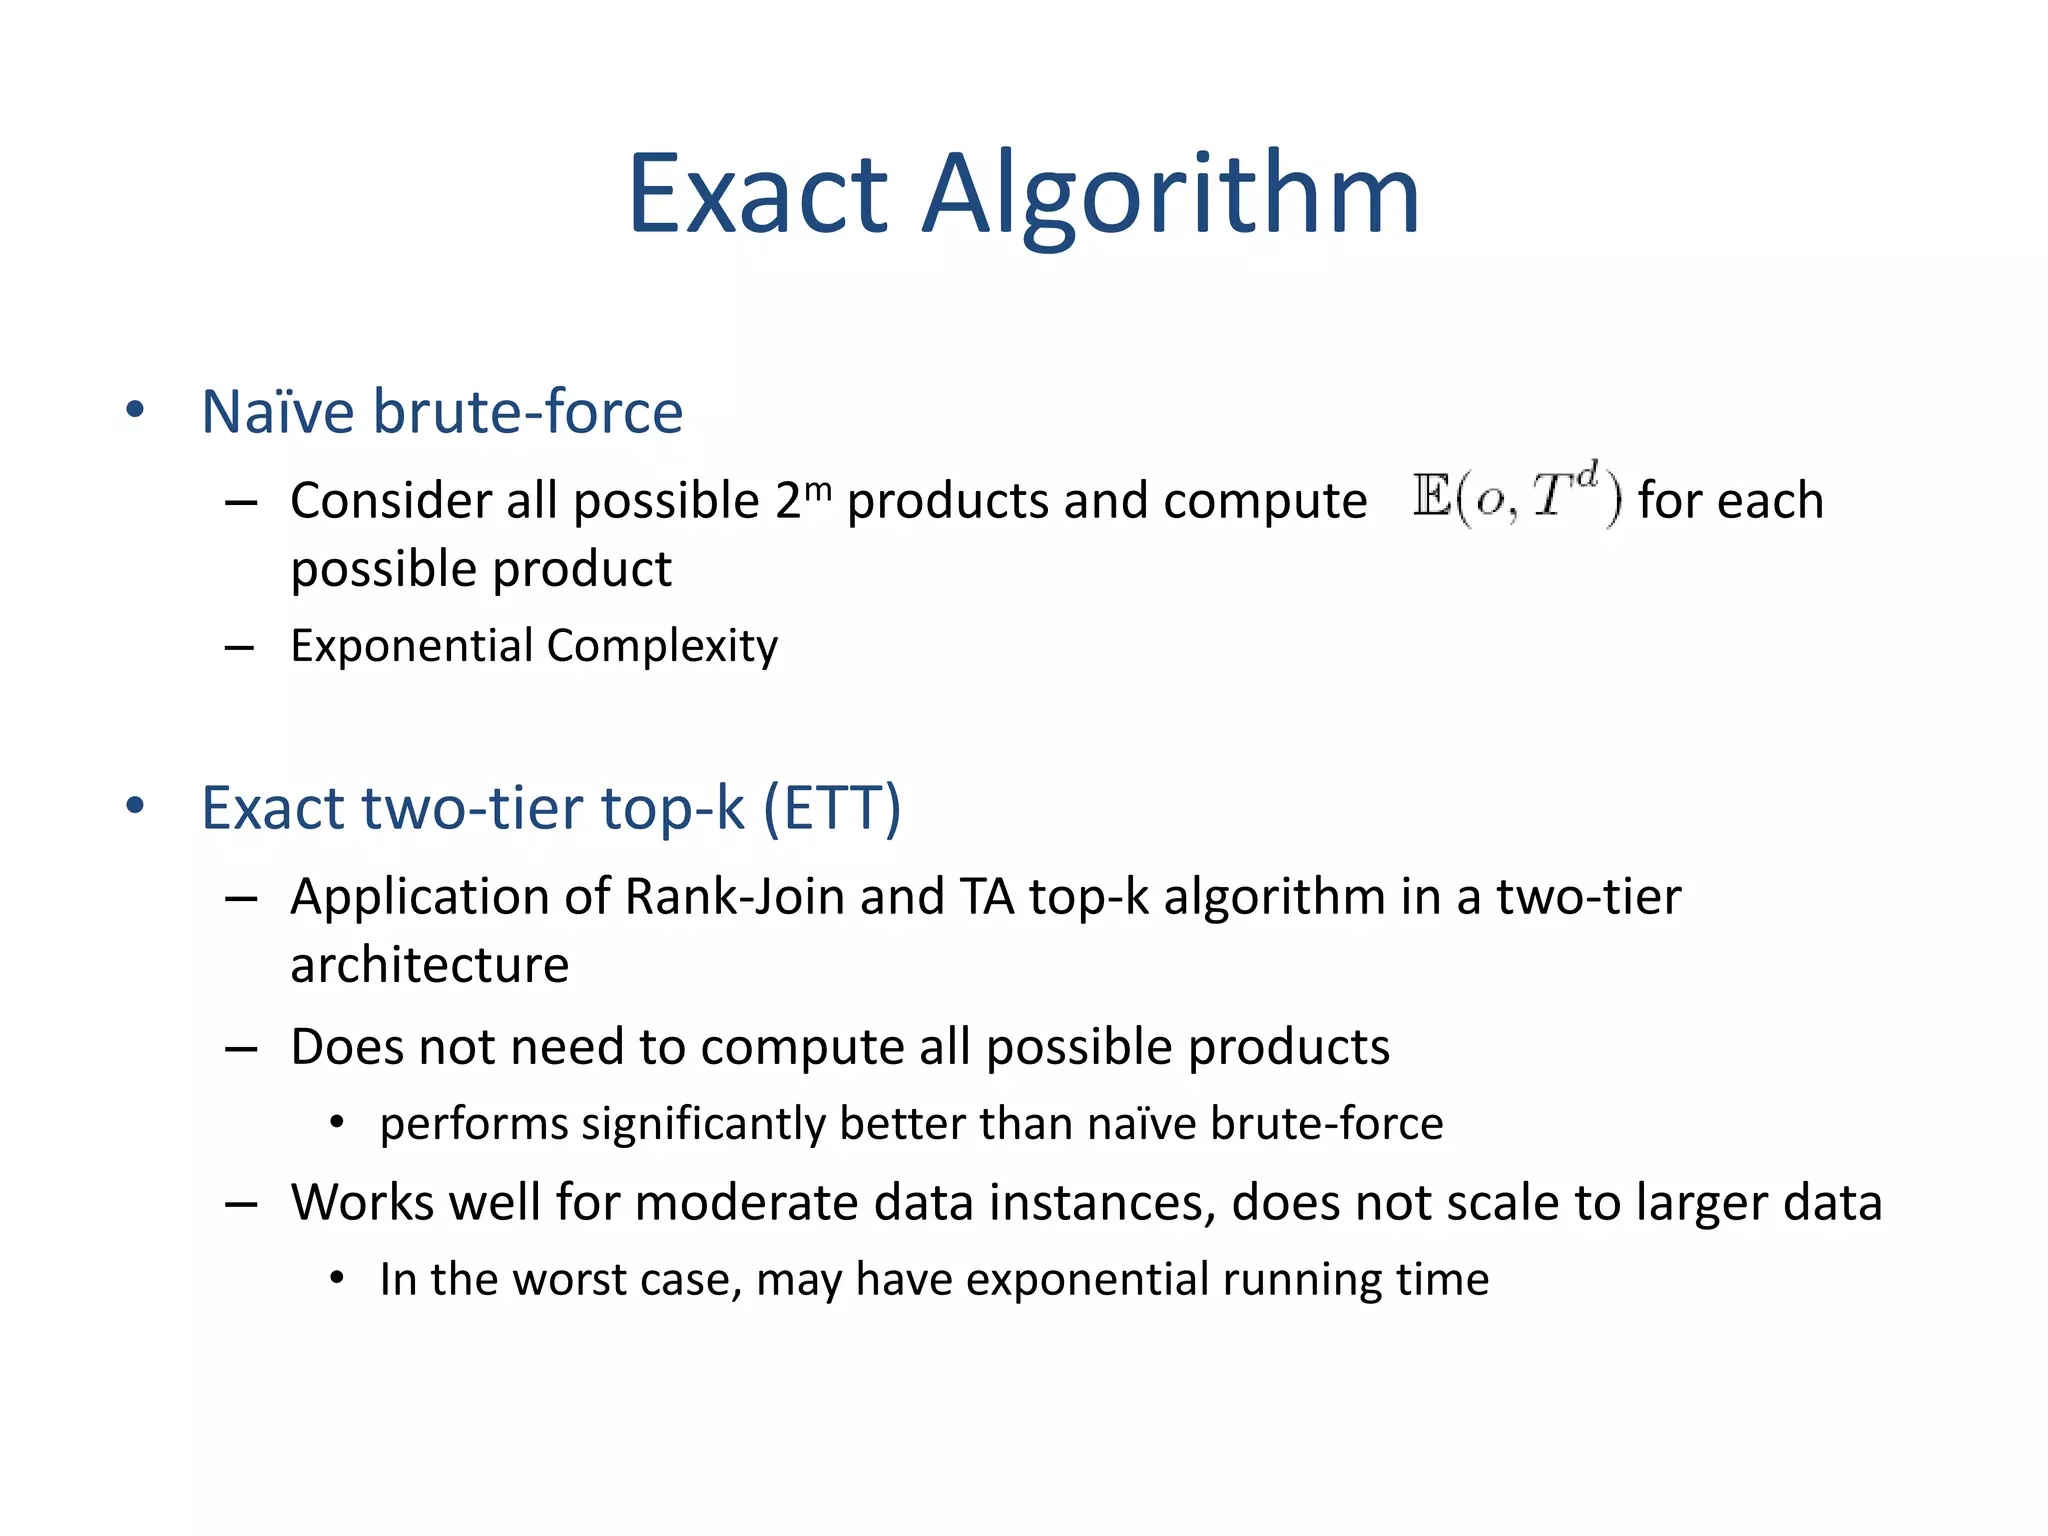
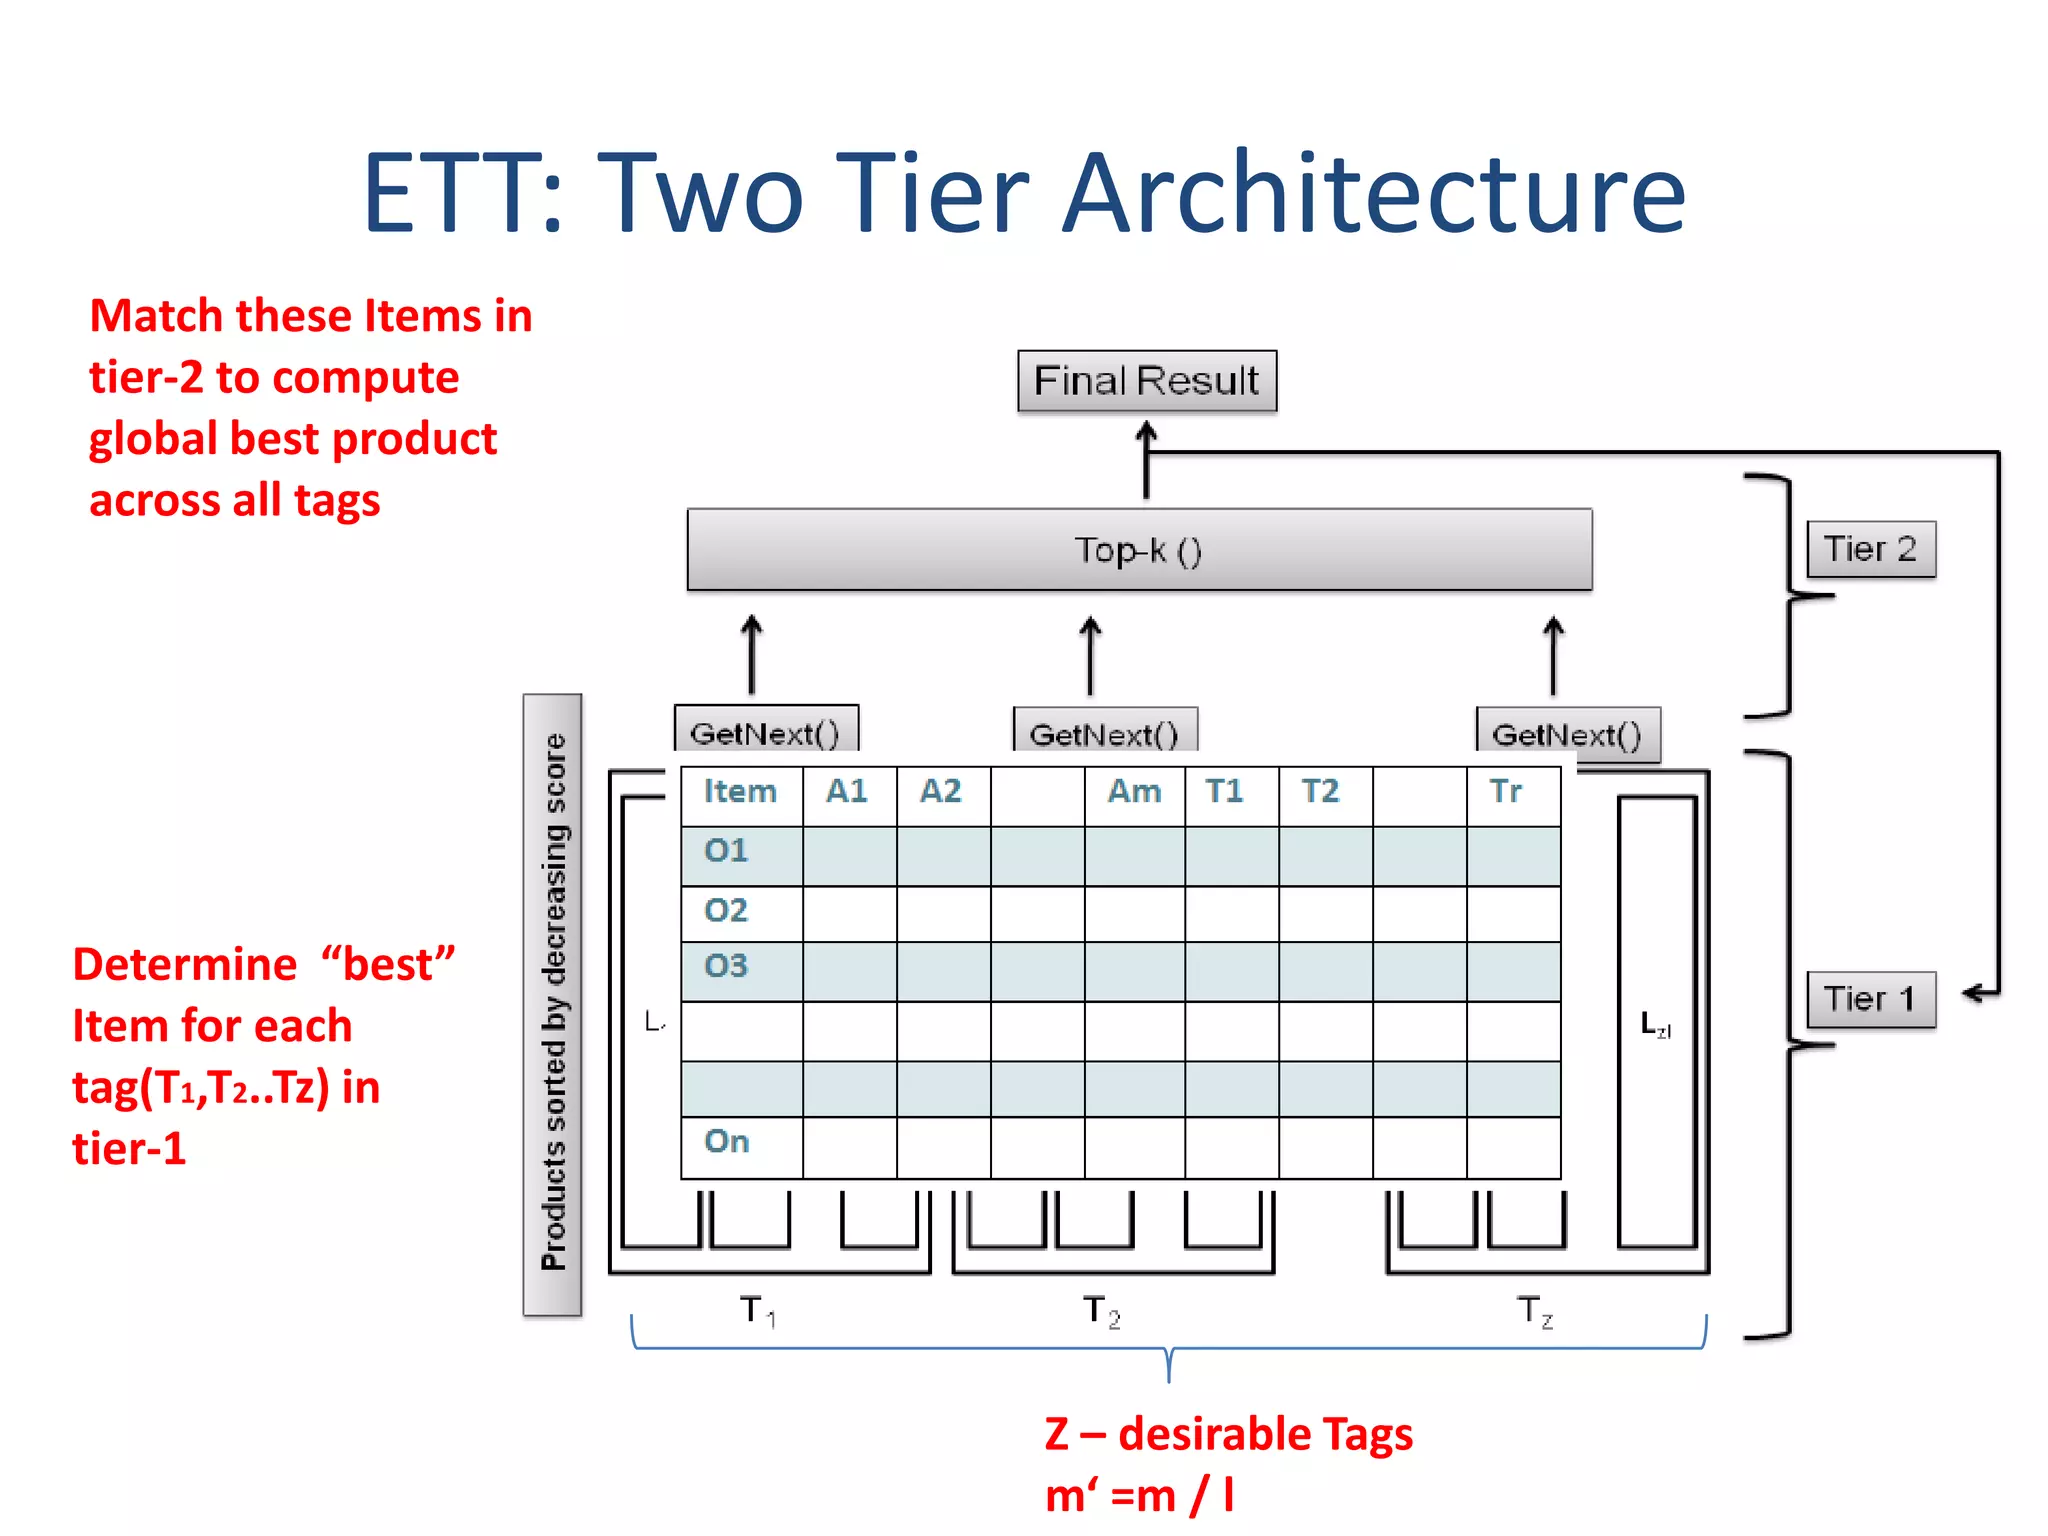
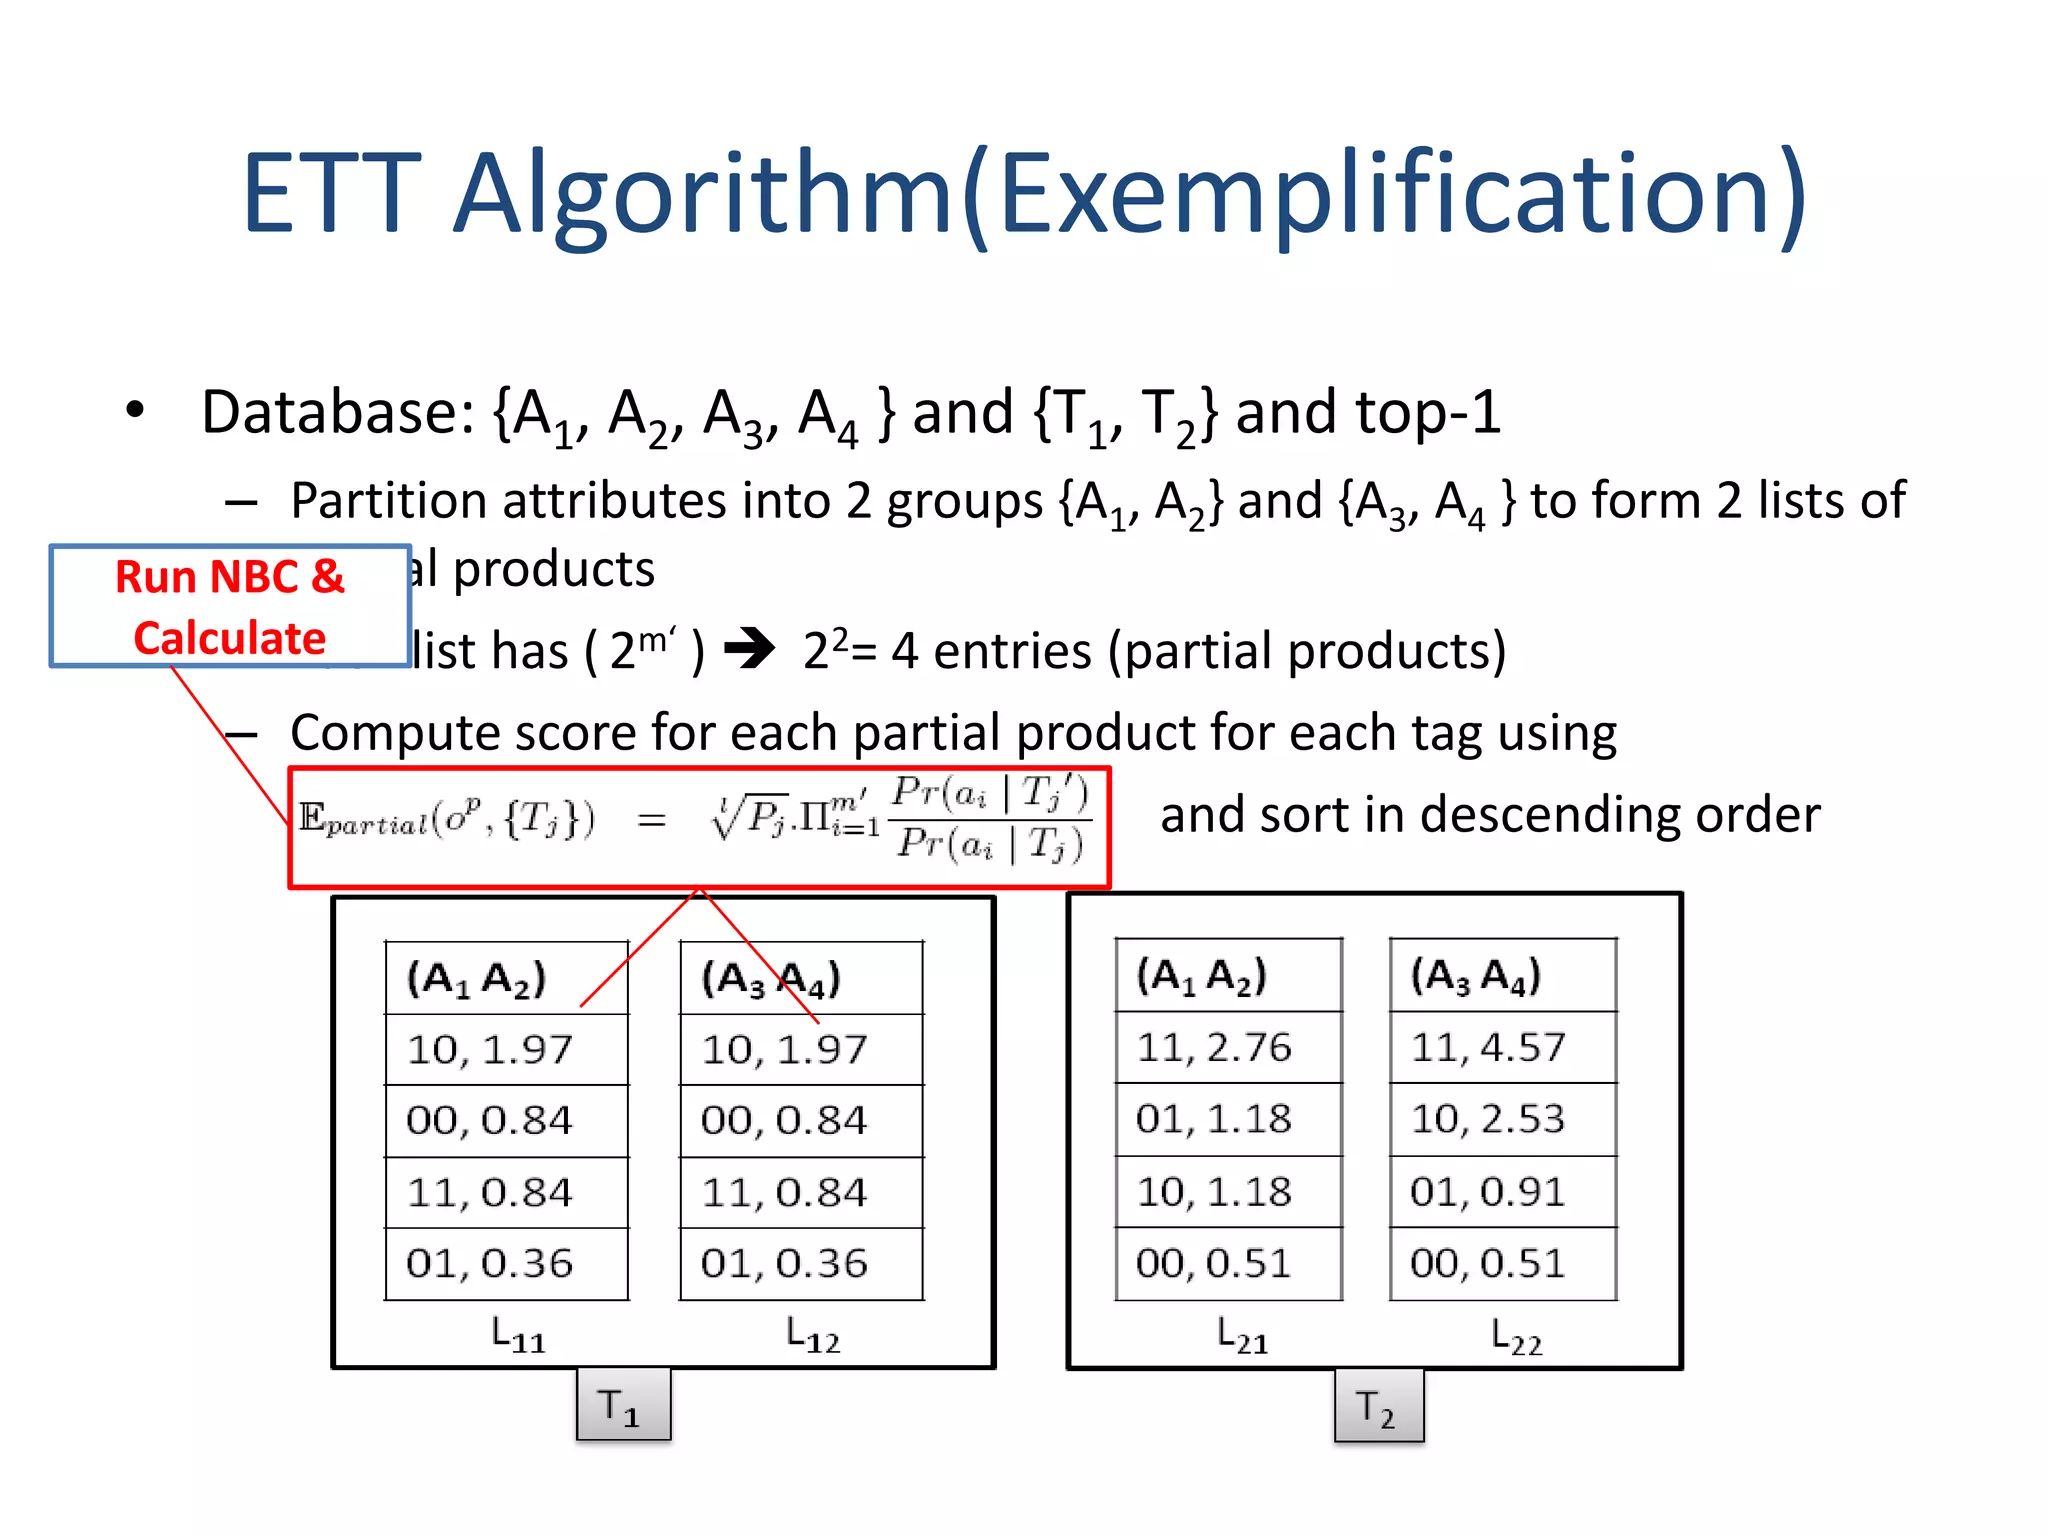
1) The document discusses using collaborative tagging to design new web items that attract maximum tags. It defines the problem as predicting new item attributes to maximize desirable tags. 2) It proposes two algorithms - an Exact Two-Tier Top K algorithm (ETT) that runs in exponential time, and a Polynomial Time Approximation Scheme (PTAS) that runs in polynomial time with provable error bounds. 3) An experiment tests the algorithms on synthetic and real camera datasets. It analyzes performance quantitatively and uses a user study to qualitatively assess algorithm results.


![Vibe Coding vs. Spec-Driven Development [Free Meetup]](https://cdn.slidesharecdn.com/ss_thumbnails/vibecodingvsspecdrivendevelopment-251209105622-43f455e7-thumbnail.jpg?width=640&height=640&fit=bounds)


