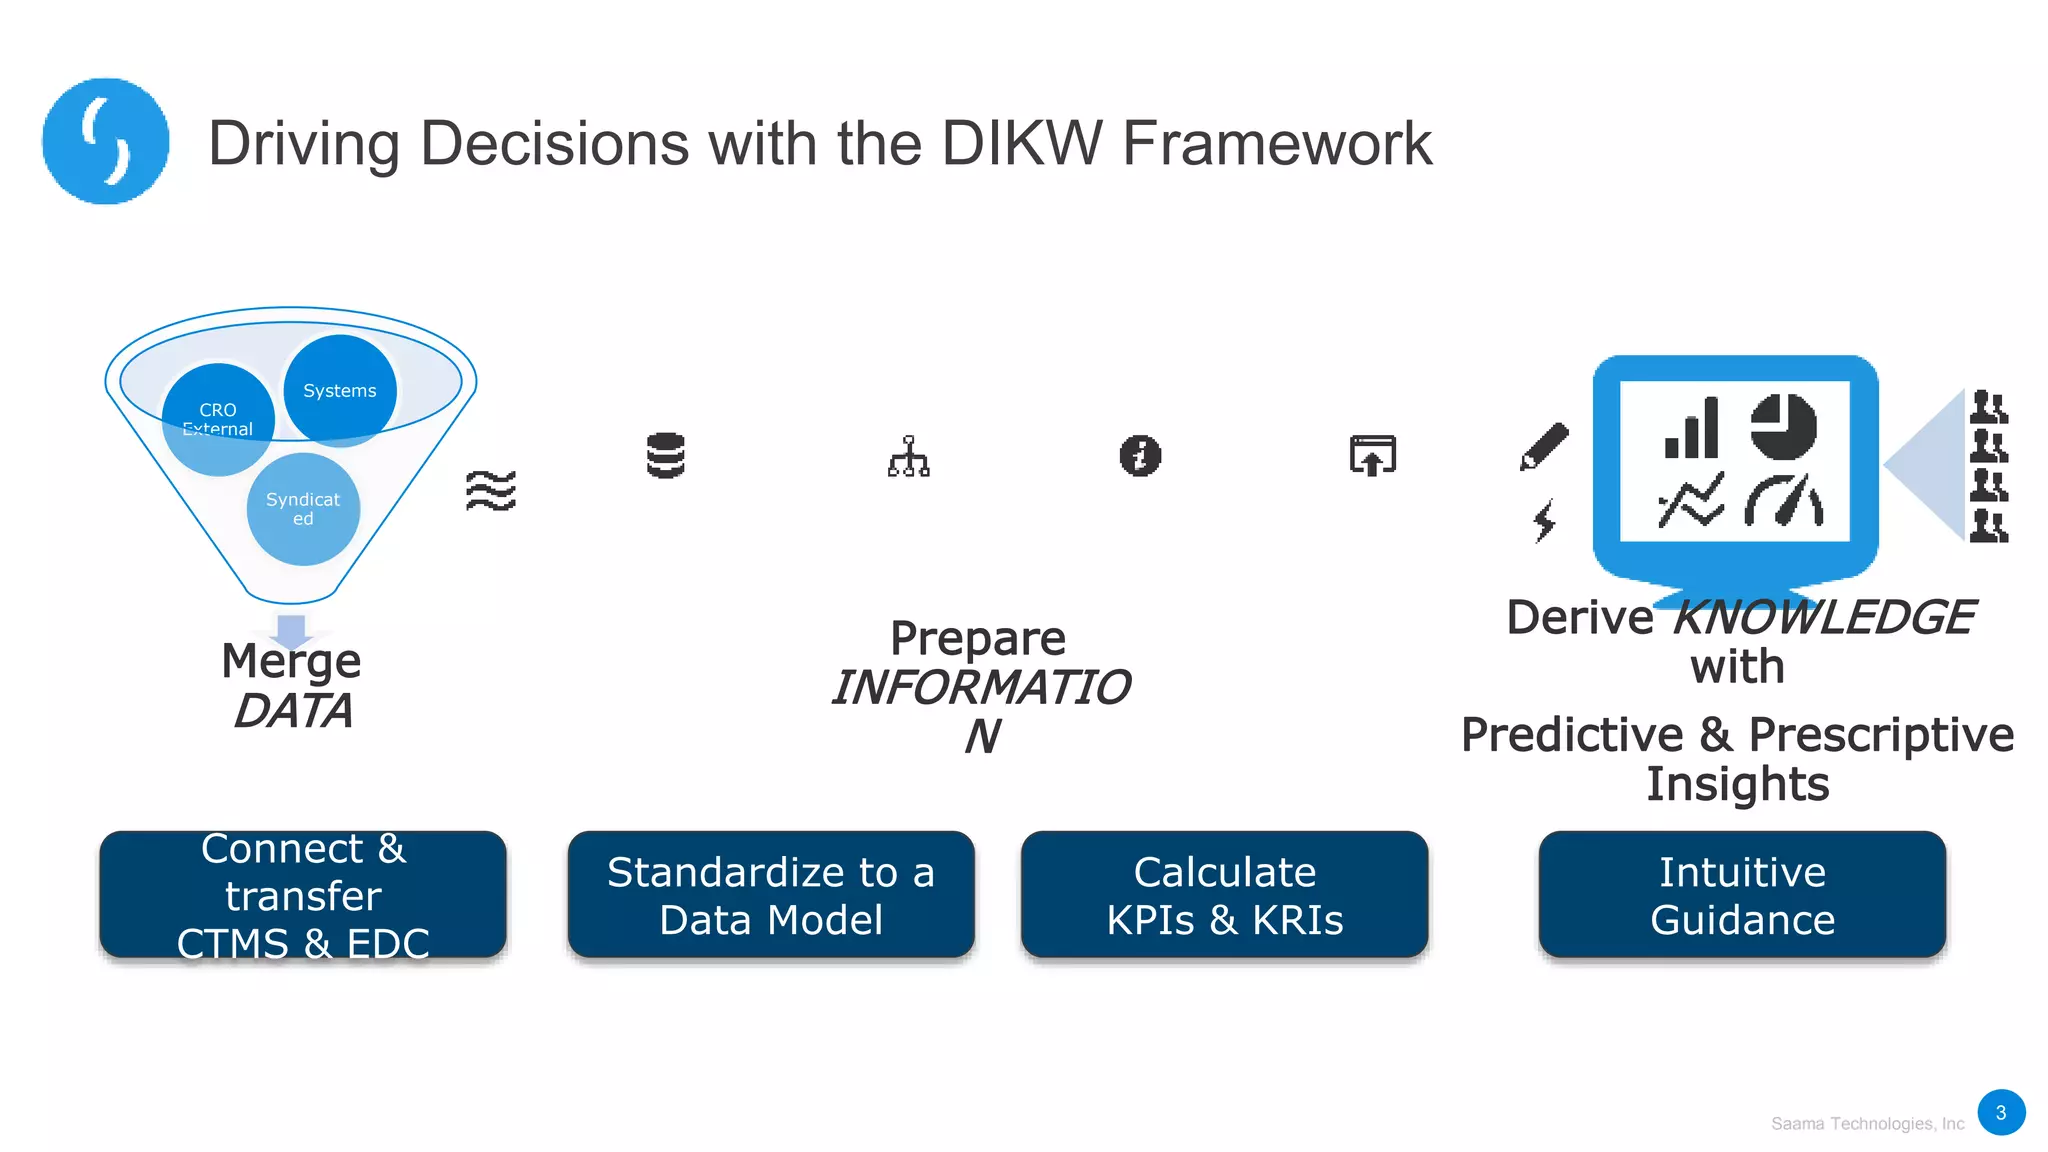
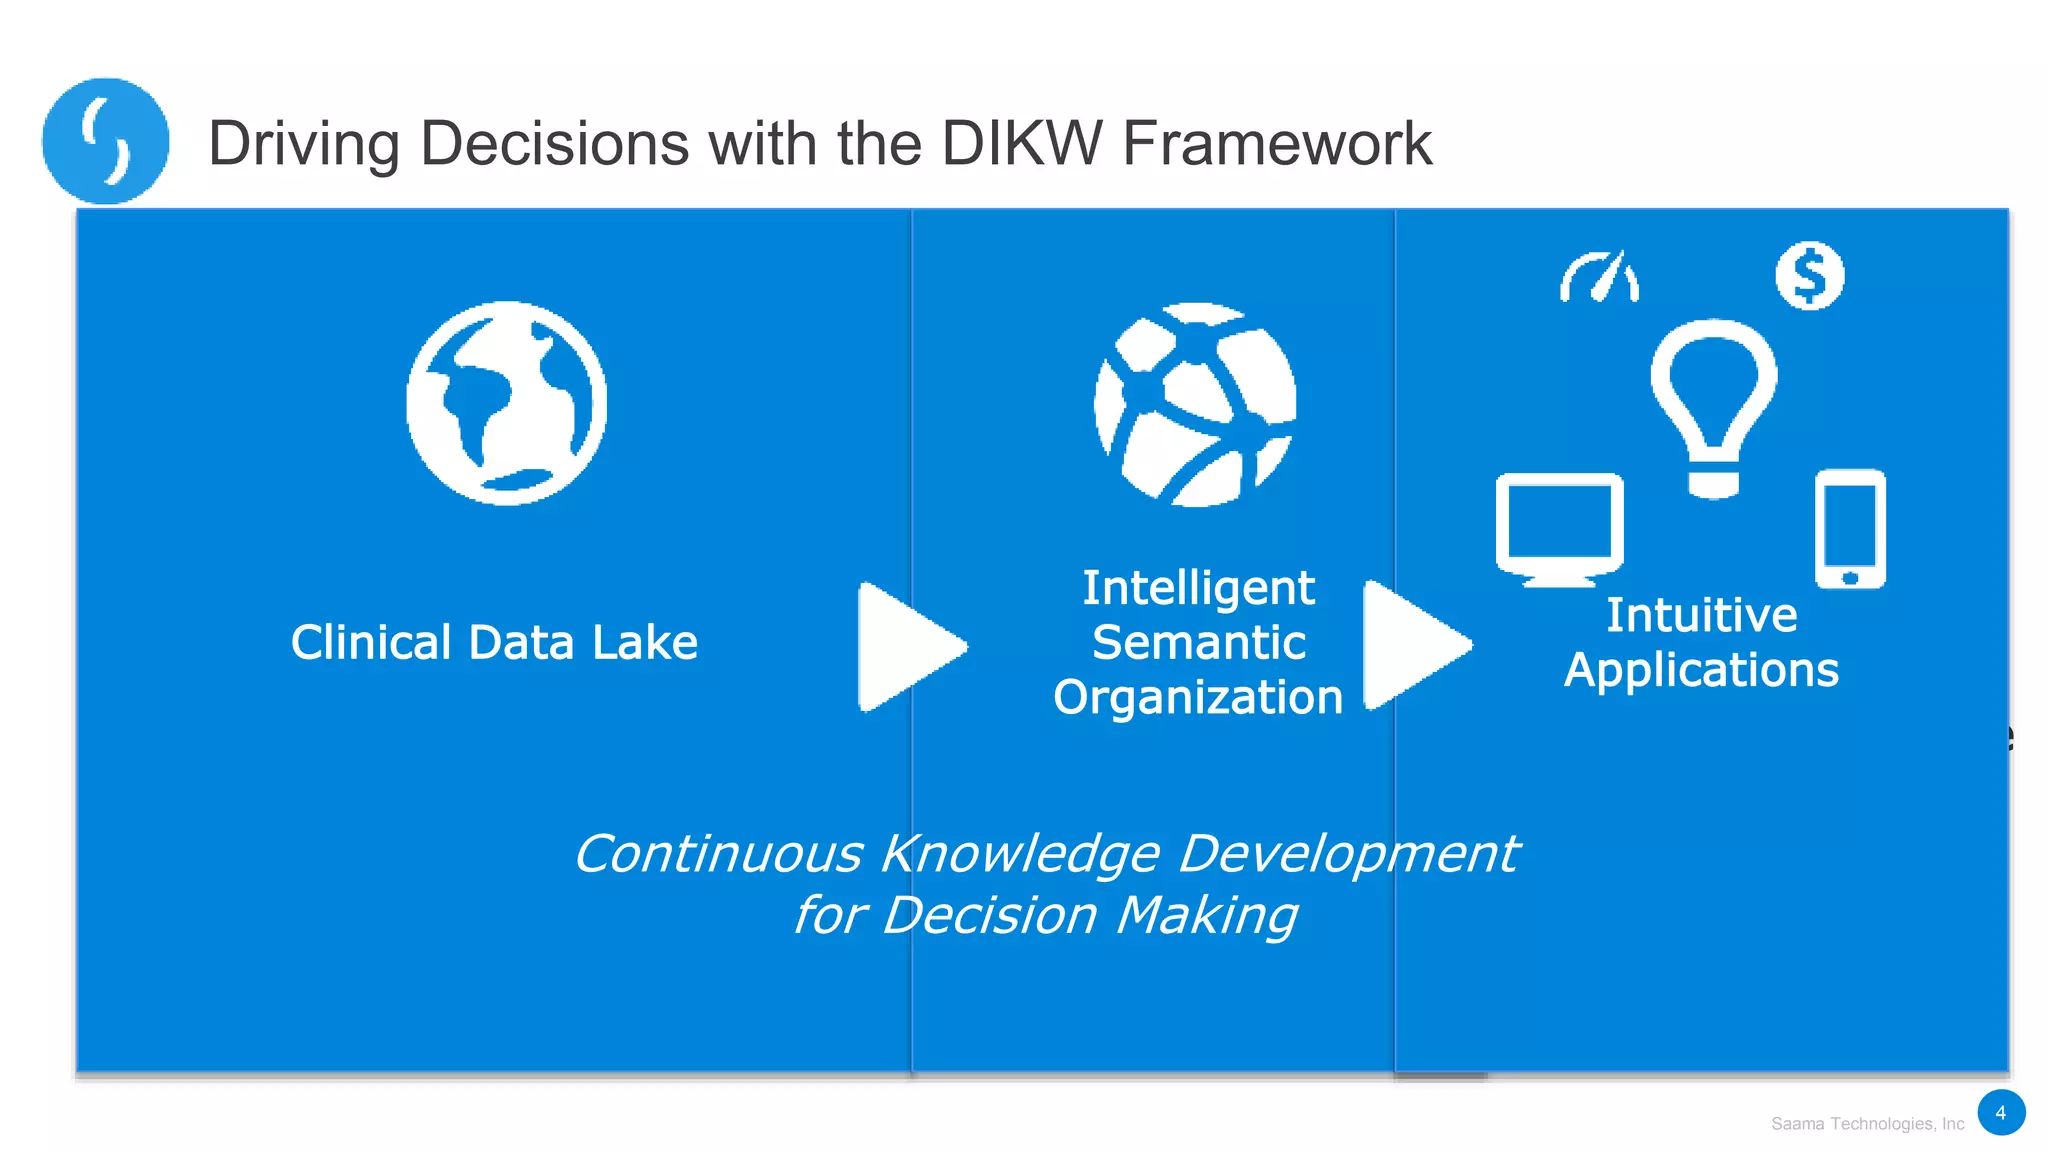
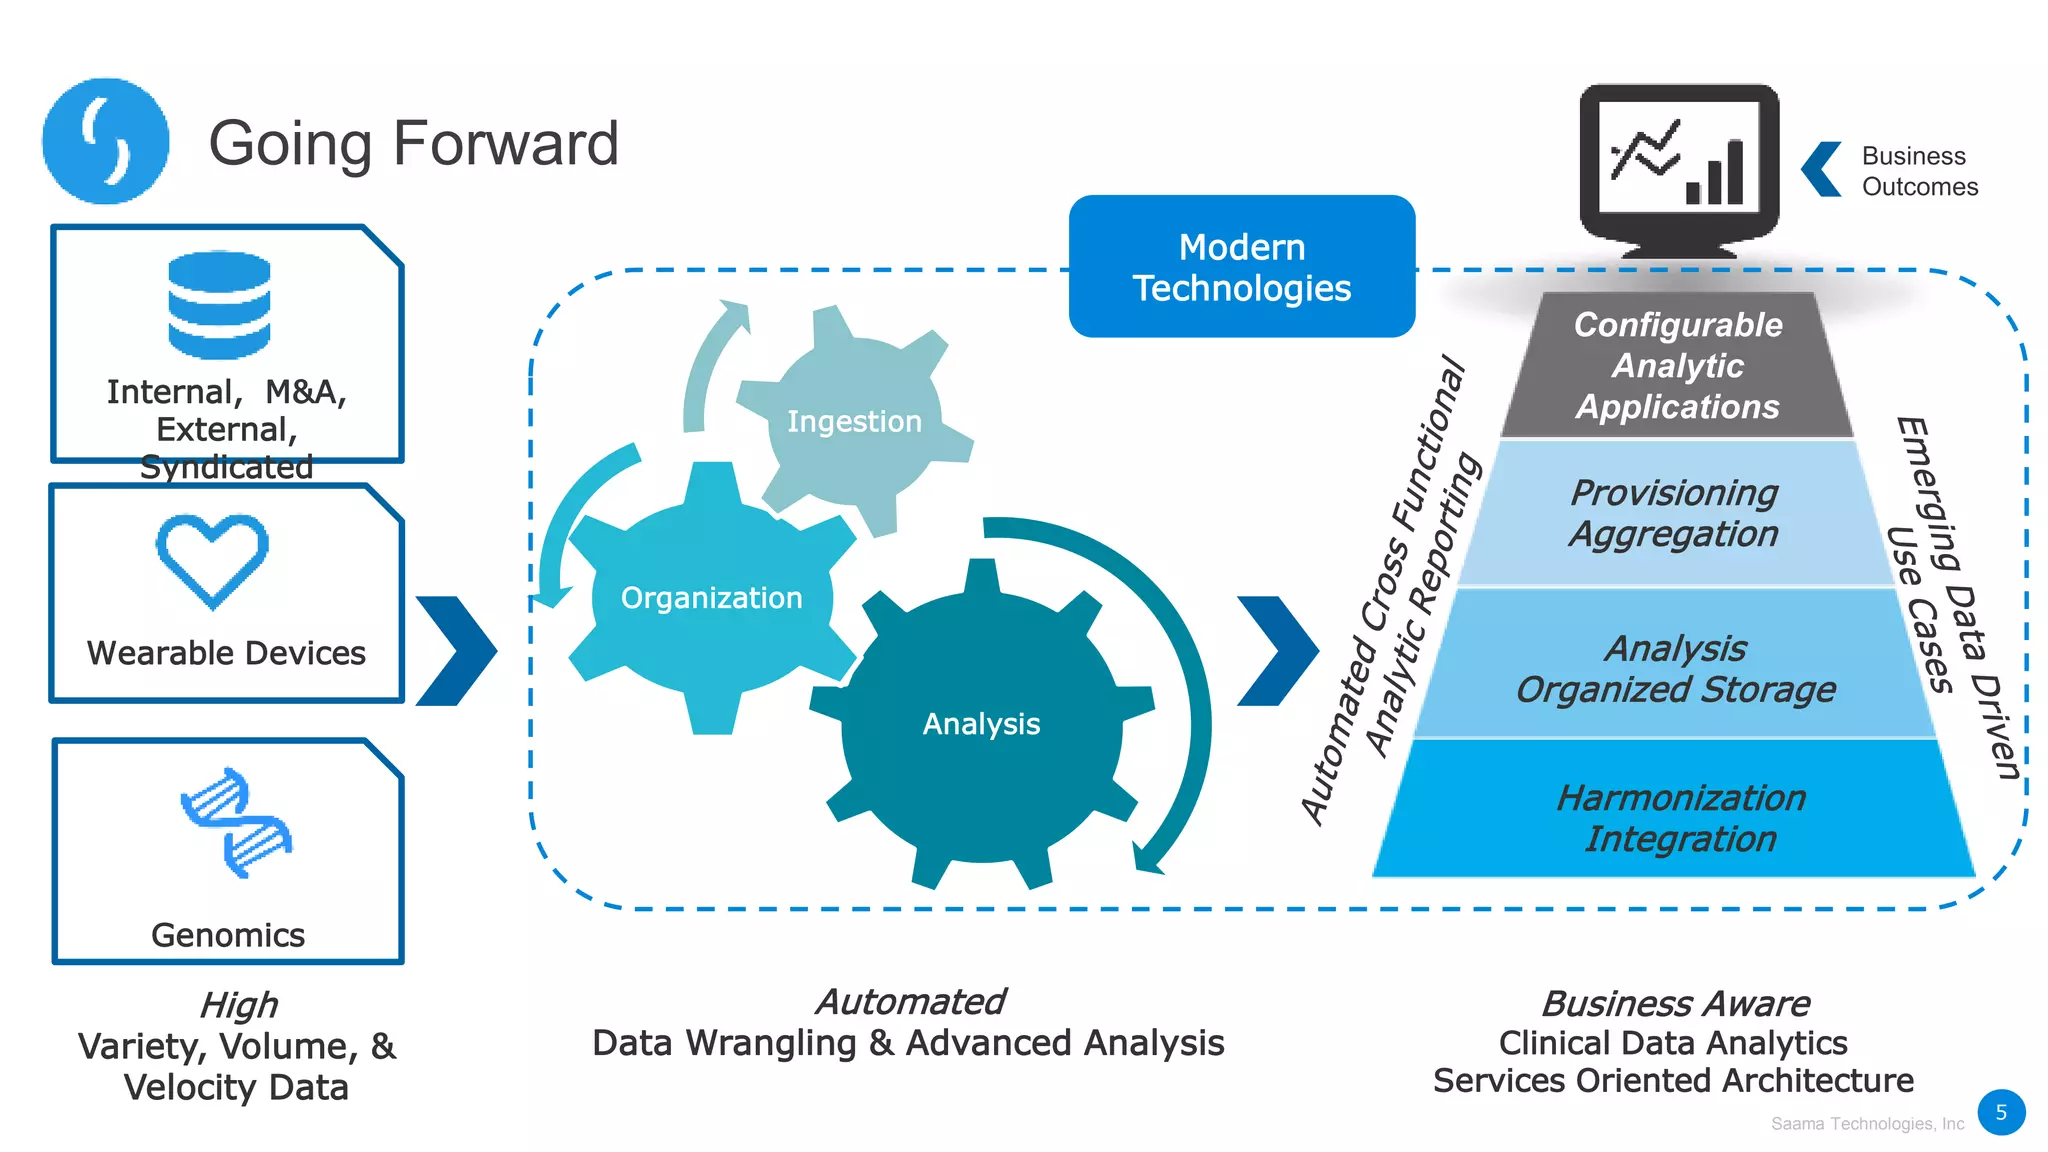
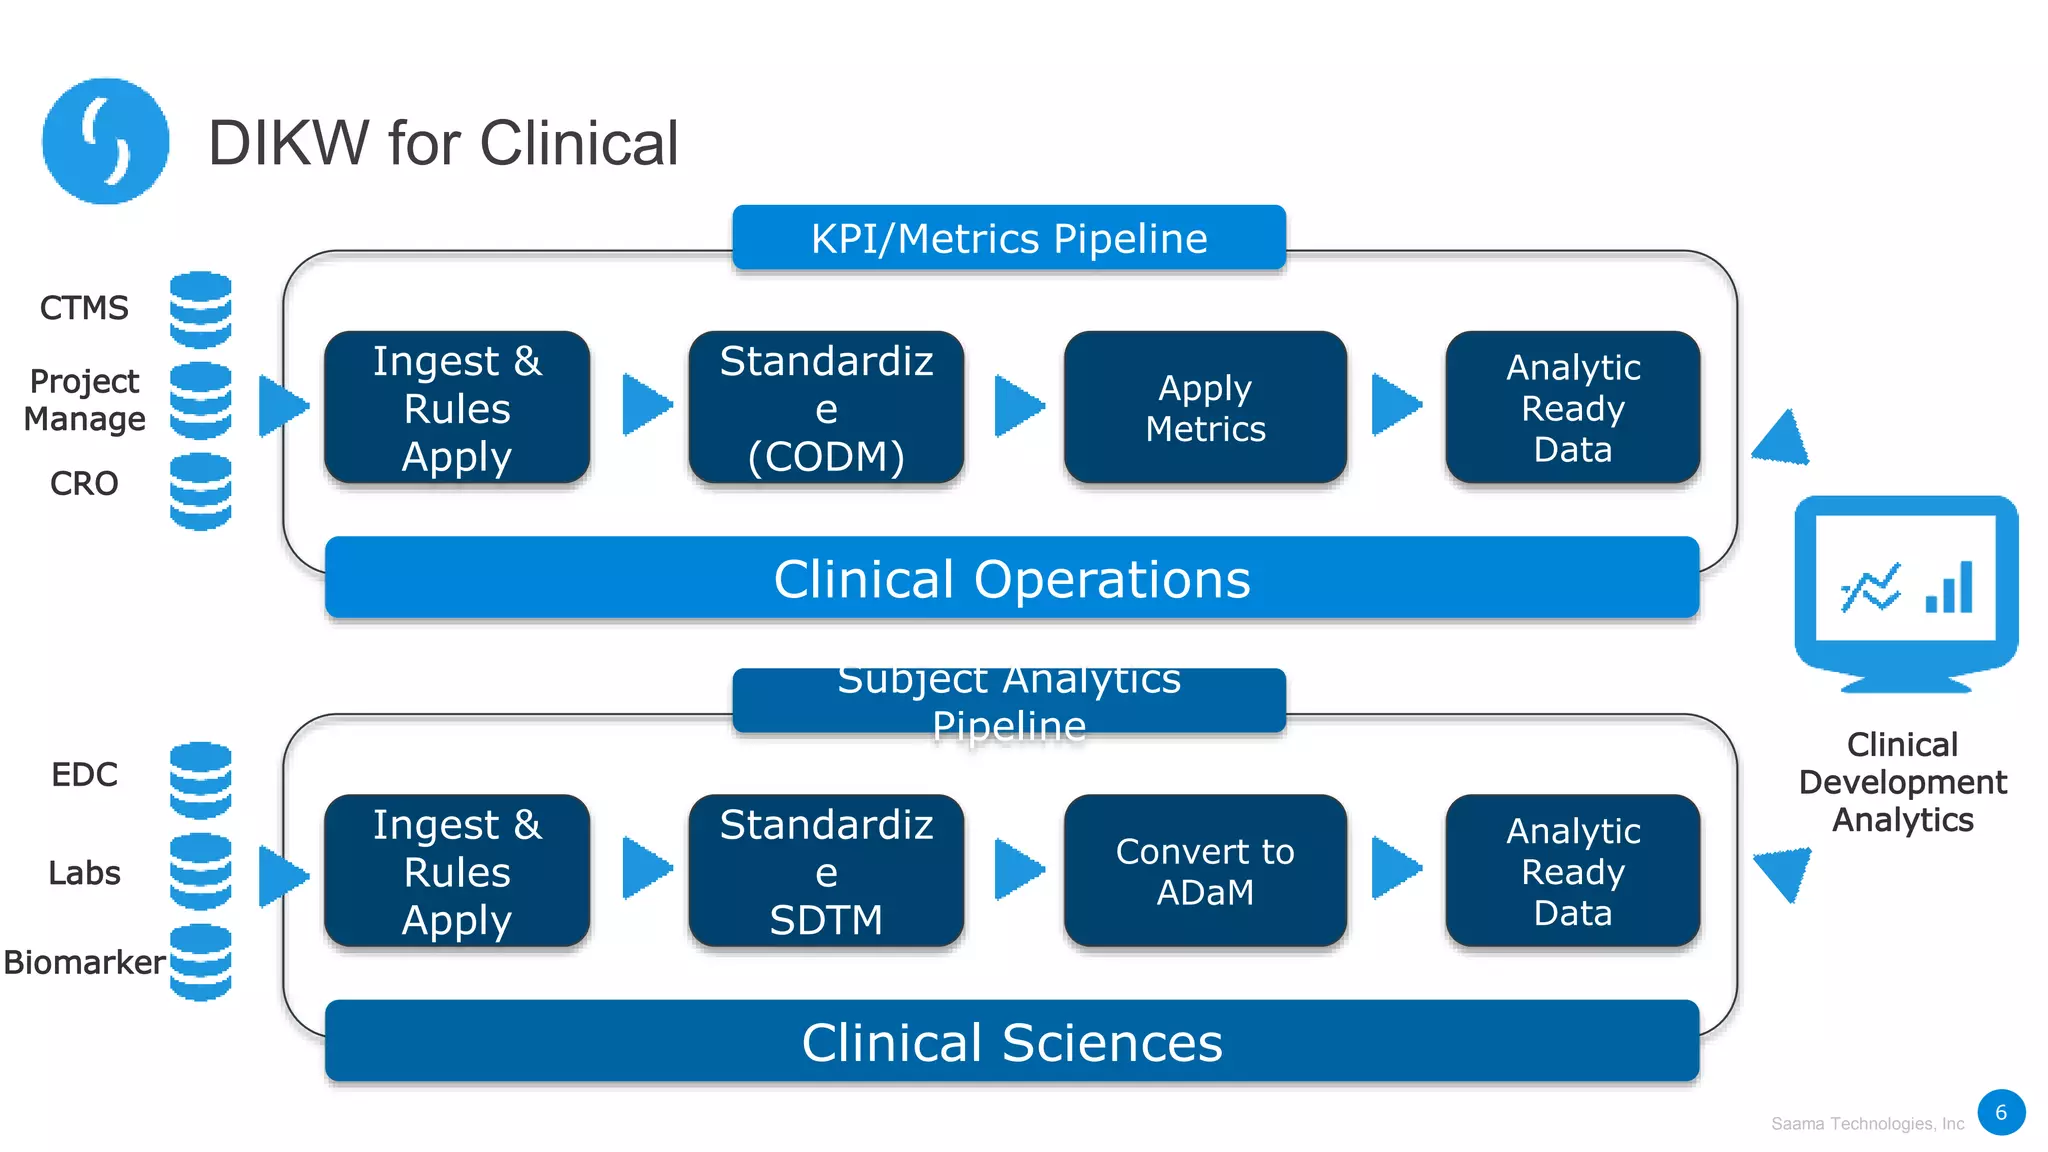
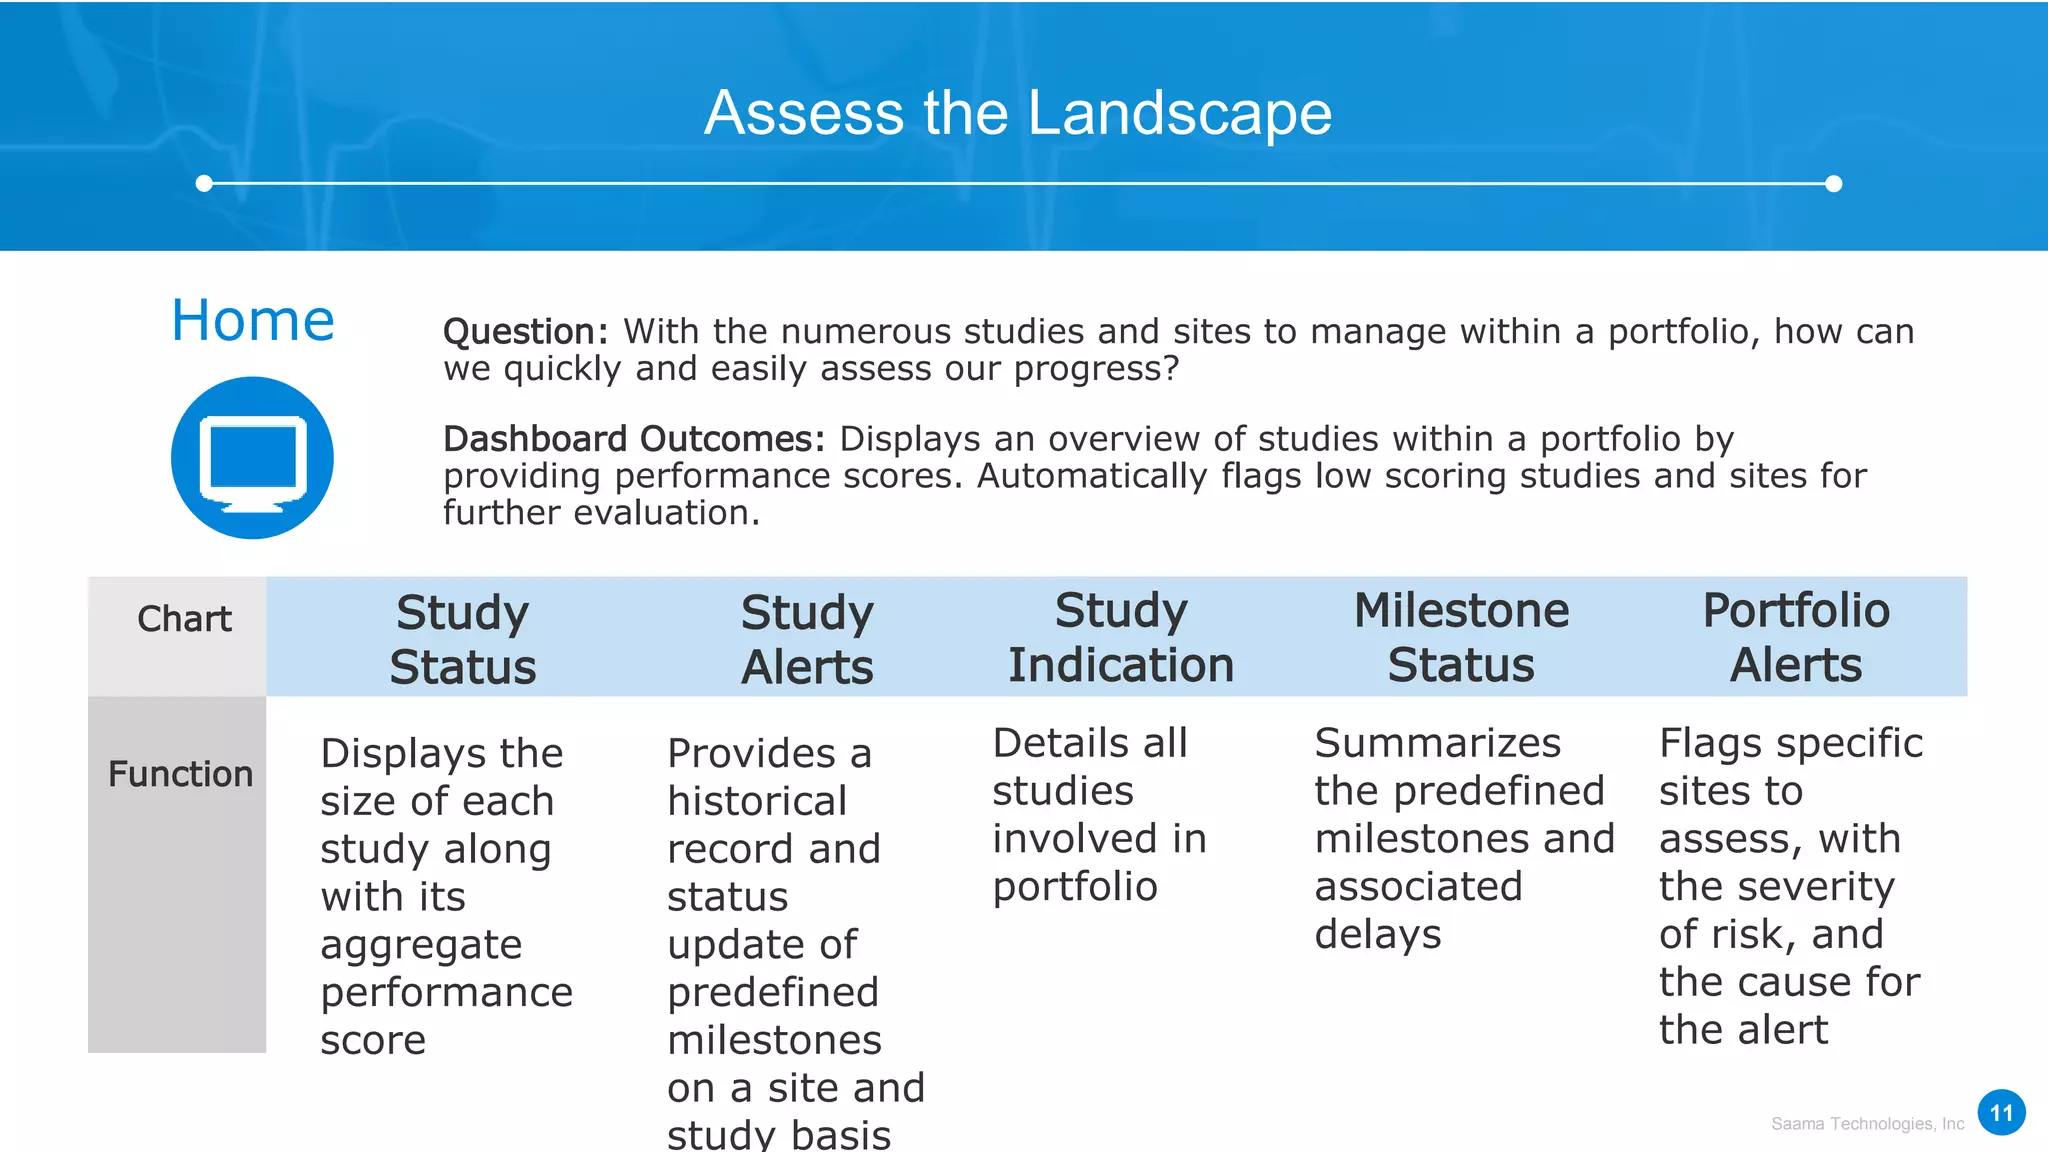
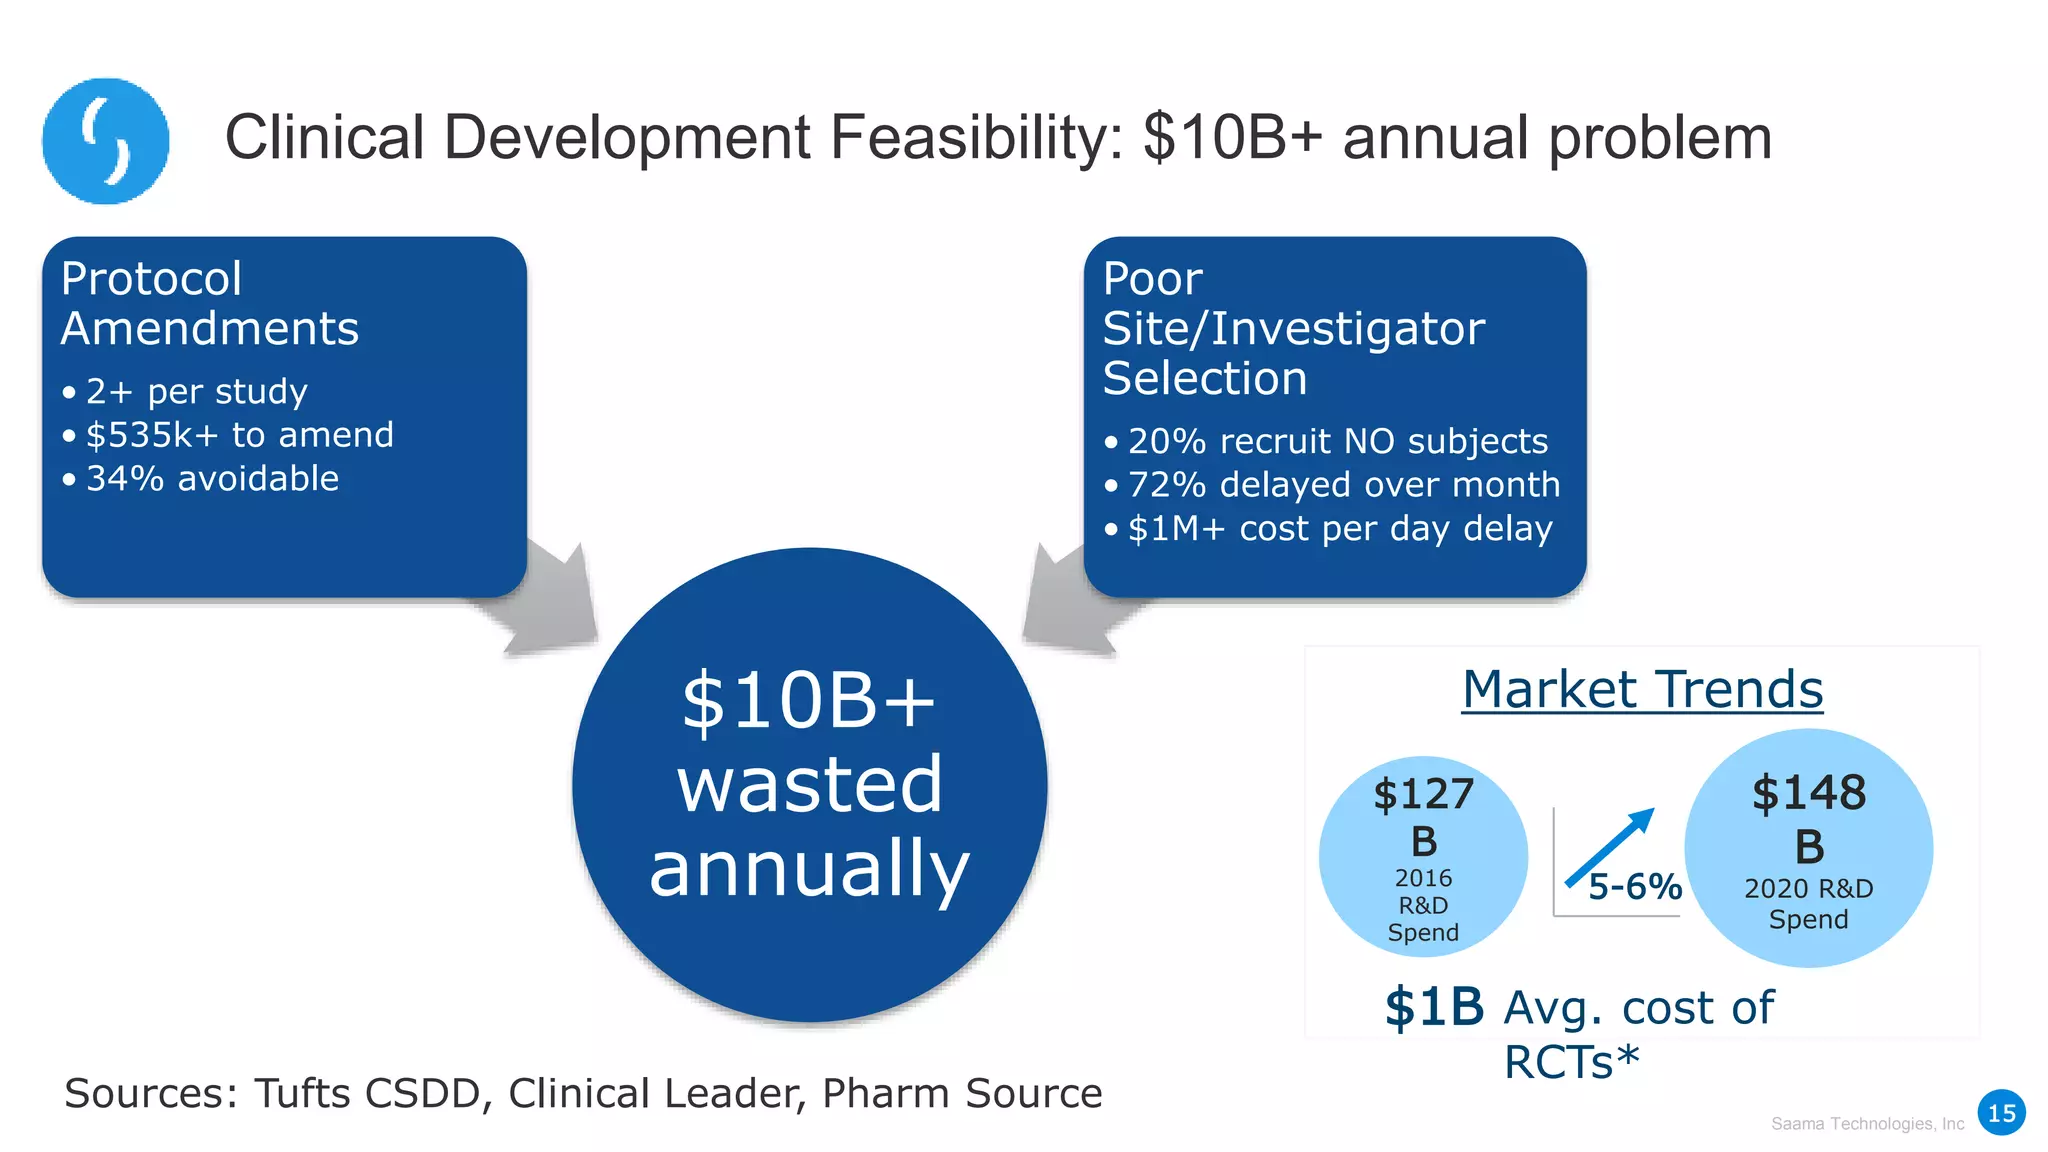
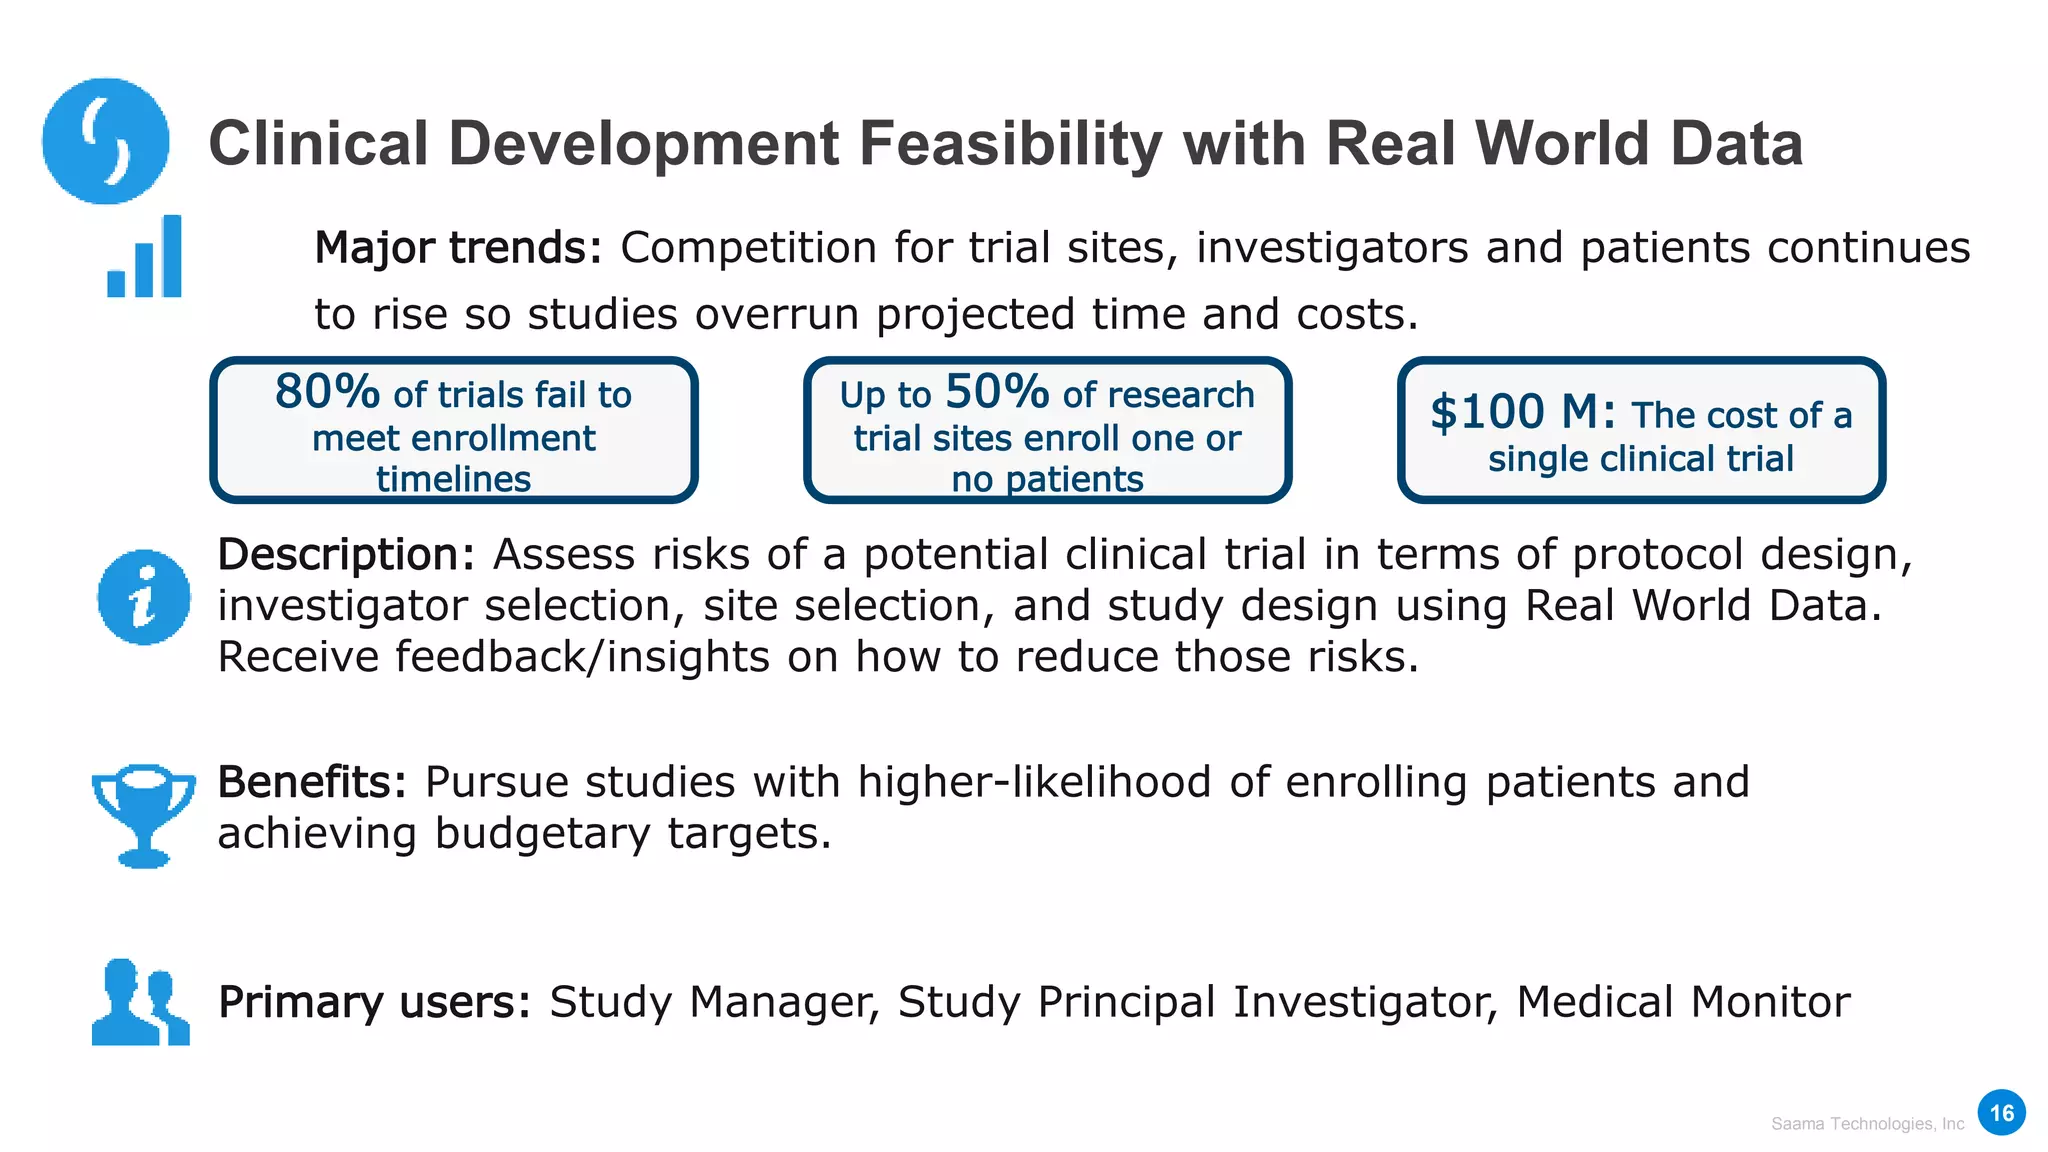
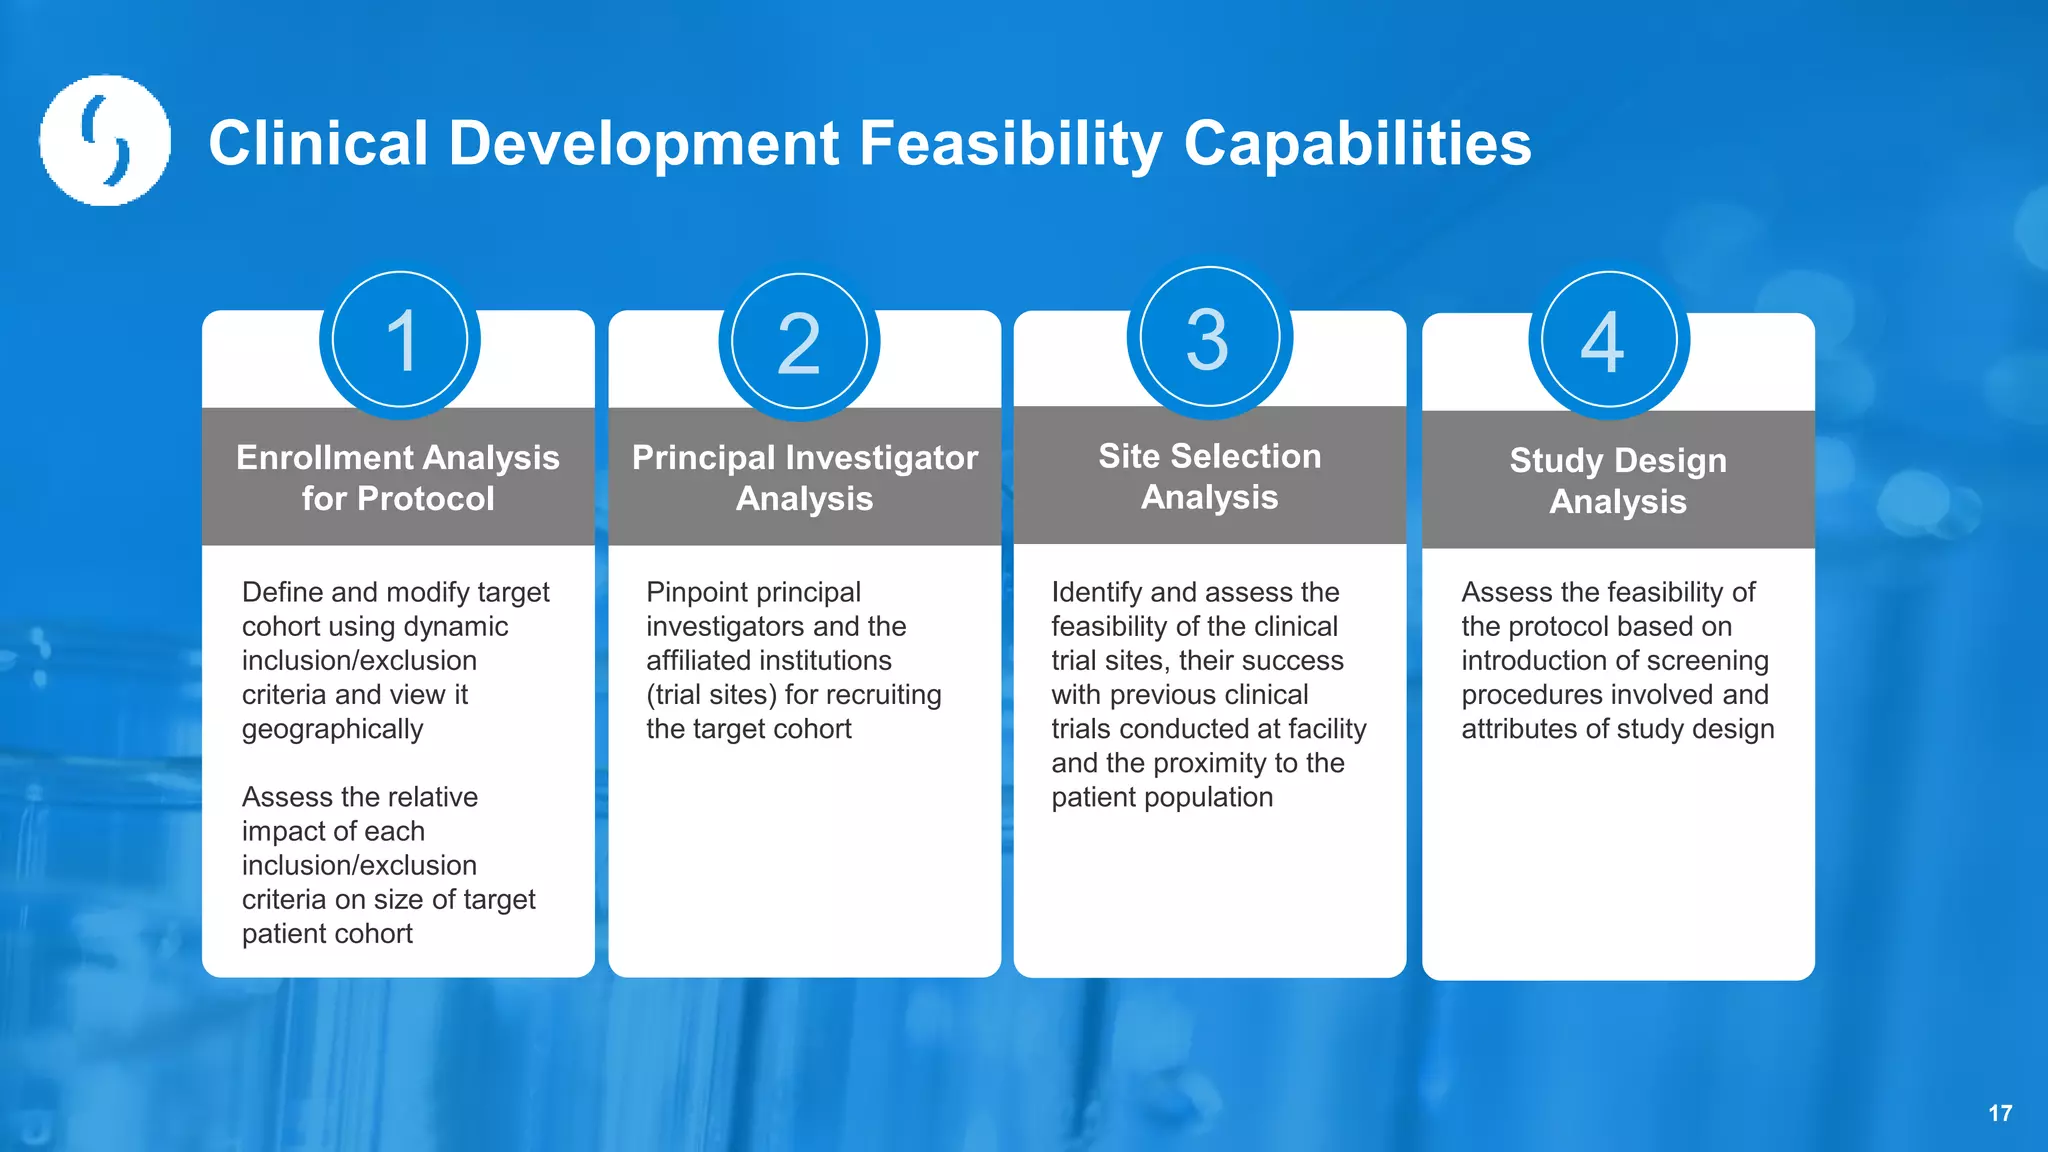
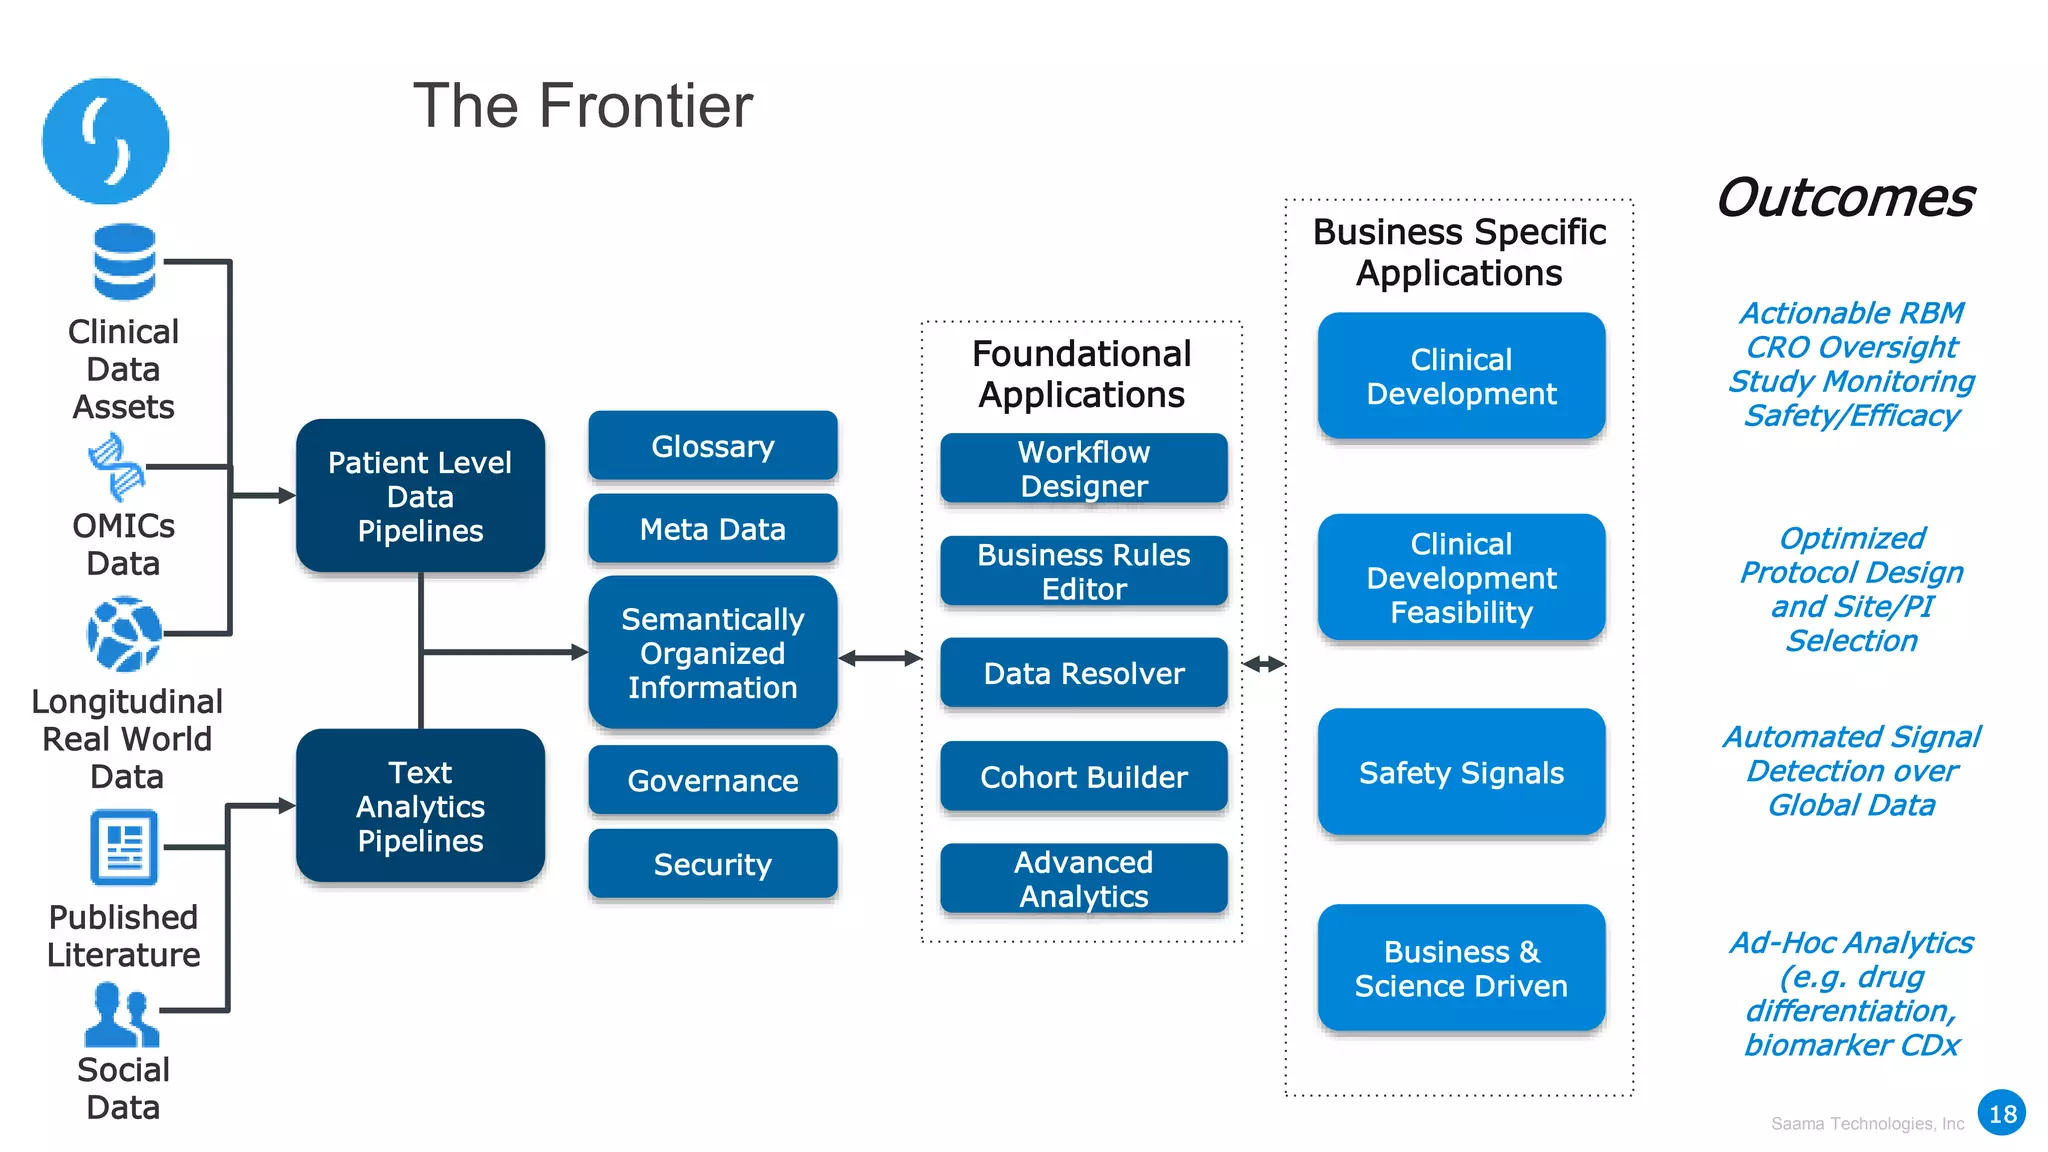
Saama Technologies, Inc
Leverage Big Data Analytics to Enhance
Clinical Trials from Planning to Execution
Nikhil Gopinath, Sr. Solutions Engineer – Life Sciences
2/21/17
Saama Technologies, Inc
Agenda
• A framework to prepare data and drive
impactful trial management
• Data assets including the real world
• Innovative applications and demos
2
Saama Technologies, Inc
Merge
DATA
Syndicat
ed
CRO
External
Systems
Prepare
INFORMATIO
N
Derive KNOWLEDGE
with
Predictive & Prescriptive
Insights
Connect &
transfer
CTMS & EDC
Standardize to a
Data Model
Calculate
KPIs & KRIs
Intuitive
Guidance
Driving Decisions with the DIKW Framework
3
Saama Technologies, Inc
Prepare
INFORMATIO
N
Derive KNOWLEDGE
with
Predictive & Prescriptive
Insights
Connect &
transfer
CTMS & EDC
Standardize to a
Data Model
Calculate
KPIs & KRIs
Intuitive
Guidance
Driving Decisions with the DIKW Framework
4
Clinical Data Lake
Intelligent
Semantic
Organization
Intuitive
Applications
Continuous Knowledge Development
for Decision Making
Saama Technologies, Inc
Genomics
Internal, M&A,
External,
Syndicated
Wearable Devices
High
Variety, Volume, &
Velocity Data
Analysis
Organization
Ingestion
Automated
Data Wrangling & Advanced Analysis
Business Aware
Clinical Data Analytics
Services Oriented Architecture
Harmonization
Integration
Analysis
Organized Storage
Provisioning
Aggregation
Modern
Technologies
Configurable
Analytic
Applications
Business
Outcomes
Going Forward
5
Saama Technologies, Inc
Ingest &
Rules
Apply
Standardiz
e
(CODM)
Apply
Metrics
Analytic
Ready
Data
Clinical Operations
KPI/Metrics Pipeline
Ingest &
Rules
Apply
Standardiz
e
SDTM
Convert to
ADaM
Analytic
Ready
Data
Clinical Sciences
Subject Analytics
Pipeline
CTMS
Project
Manage
CRO
EDC
Labs
Biomarker
Clinical
Development
Analytics
DIKW for Clinical
6
Saama Technologies, Inc
7
• QIDA-I:
• Define Key Capabilities that the
business users will need to meet
their objectives
• BRIA:
• Further refine use cases into
region/role specific needs in
context of data, visualization, &
preferences
• MOA:
• Translate results from first two
steps into traceable design
template in visualization tool
Global Clinops
Stakeholder
Interviews
In-Scope
Reporting
Requirements
Completed
Use Case
Template
360 View of
Use Cases
from all Roles
& Regions
Data Needs:
Dimensions
Measures
Completed
BRIA
Template
Translate
requirements
into design
plan
Iterative
Design:
wireframes &
business
signoff
Completed
MOA
Template
Question from Business
Information Needed
Decision to be driven
Action to be taken
Impact on Business
Business Role-Based Intelligence Analysis
Methods Of Analysis
: Business : Systems/IT
Business Analytics Engagement
Saama Technologies, Inc
QIDA-I
8
Use
Case
ID
Functional
Role(s)
Requesting
Use Case
(Business
Question)
Information Needed
to Answer
Decision or
Action to be
Driven
Business
Impact
Trace to
ID’s
U1.0 Clinical
Data
Manageme
nt
What is the
query trend,
origin of
query, type
of query &
time to
resolve?
• Rate of queries
• Query origin
• Region & Sub
region
• Resolution Time
 Site
Engagemen
t
 Query
Resolution
 EDC
Validation
 Planned
vs. Actual
Timeline
Impact
(DBL)
 Data
Quality
O1,
U1.0
Objective ID Use Case ID Dashboard Use Case (Business Question)
01 U1.0 Inquiries What is the query trend, origin of query, type of
query & time to resolve?
Saama Technologies, Inc
BRIA
9
Use Case ID: U1.0 Role(s) Requesting: Clinical Data Management
Use Case
(Business Question):
What is the query trend, origin of query, type of query & time to
resolve?
Information /
Metrics
Time
Frequency
Information View
/ Display Format
Data Source(s) Comments
Rate of queries by
selectable Time
Period
Weekly 1. Query
Dashboard
2. Regional
Dashboard
EDC
Data Validation
Tool Output
Metric Selection
Present Country, Hub,
Rollup Hierarchy as
Prompt
Include metric
flagging and
forwarding to
stakeholders
Saama Technologies, Inc
MOA
10
Krishnankutty B, Bellary S, Kumar NBR, Moodahadu LS. Data management in clinical research: An
overview. Indian Journal of Pharmacology. 2012;44(2):168-172. doi:10.4103/0253-7613.93842.
Portfolio
Country
Site
Saama Technologies, Inc
Target Specific SitesAssess the Landscape
Home Question: With the numerous studies and sites to manage within a portfolio, how can
we quickly and easily assess our progress?
Dashboard Outcomes: Displays an overview of studies within a portfolio by
providing performance scores. Automatically flags low scoring studies and sites for
further evaluation.
Displays the
size of each
study along
with its
aggregate
performance
score
Study
Status
Provides a
historical
record and
status
update of
predefined
milestones
on a site and
study basis
Study
Alerts
Details all
studies
involved in
portfolio
Study
Indication
Summarizes
the predefined
milestones and
associated
delays
Milestone
Status
Flags specific
sites to
assess, with
the severity
of risk, and
the cause for
the alert
Portfolio
Alerts
Chart
Function
11
Saama Technologies, Inc
Target Specific SitesDrill Into Problematic Regions
Showcases
the country’s
ability to
effectively
enroll
patients for
their studies
Global View –
Enrollment Ratio
Details
each
country’s
max
screen
failures
Country:
SFR
Shows the
number of
sites that
are on
track and
ones that
are
potentially
delayed
Most Delayed
Countries
Compares
the actual
vs. planned
cost by each
country
Cost Up
to Date
Shows the
number of
milestones
per site
that are on
track and
the ones
that are
potentially
delayed
Most Delayed
Sites
Chart
Function
Country Question: With so many studies reaching across the globe, how can we manage and
asses different countries to determine the most promising sites for effective research?
Dashboard Outcomes: Evaluates each country by participation and effectiveness in
Clinical Trials based on different aspects.
Details the
delay for
each
predefined
milestone
Milestone
Box Plot
12
Saama Technologies, Inc
Target Specific SitesTarget Specific Sites
Alerts the user of
issues with this
particular site
and provides
details, a
suggested
mitigation, and
reliability
assessment of
the information
Summary
Bar
Outlines the
predicted
enrollment,
actual
enrollment,
planned
enrollment, and
screen failures
across time
Enrollment
Performance
Details a site’s
compliance with
a planned
schedule across
predefined
milestones
Conduct Site
Milestone
Identifies high-
risk sites based
on low enrollment
percentages
High-Risk
Sites
Compares the
actual and
planned of each
site
Cost Up
To Date
Chart
Function
Site Question: In any study, there are several sites to manage and track. How can I
quickly oversee all studies and be alerted of specific sites that require help?
Dashboard Outcomes: Provides a complete status evaluation that will alert to
problems within the site and recommend a solution.
13
Saama Technologies, Inc 14
Data Assets
Traditional
Systems
Additional
Sources
Bridge to
Real World
CTMS
EDC
IvRS
ERP
ePRO
Claims
EMR
FDA
ClinicalTrials.gov
Population
Health Forums
CRO
TrialsTrove
Registries
1 2 3
Saama Technologies, Inc
$10B+
wasted
annually
Protocol
Amendments
• 2+ per study
• $535k+ to amend
• 34% avoidable
Poor
Site/Investigator
Selection
• 20% recruit NO subjects
• 72% delayed over month
• $1M+ cost per day delay
Clinical Development Feasibility: $10B+ annual problem
Avg. cost of
RCTs*
$1B
Sources: Tufts CSDD, Clinical Leader, Pharm Source
$127
B
2016
R&D
Spend
$148
B
2020 R&D
Spend
5-6%
Market Trends
15
Saama Technologies, Inc
Clinical Development Feasibility with Real World Data
Major trends: Competition for trial sites, investigators and patients continues
to rise so studies overrun projected time and costs.
16
80% of trials fail to
meet enrollment
timelines
Up to 50% of research
trial sites enroll one or
no patients
$100 M: The cost of a
single clinical trial
Description: Assess risks of a potential clinical trial in terms of protocol design,
investigator selection, site selection, and study design using Real World Data.
Receive feedback/insights on how to reduce those risks.
Benefits: Pursue studies with higher-likelihood of enrolling patients and
achieving budgetary targets.
Primary users: Study Manager, Study Principal Investigator, Medical Monitor
Saama Technologies, Inc 17
Clinical Development Feasibility Capabilities
Enrollment Analysis
for Protocol
Principal Investigator
Analysis
Site Selection
Analysis
Study Design
Analysis
Define and modify target
cohort using dynamic
inclusion/exclusion
criteria and view it
geographically
Assess the relative
impact of each
inclusion/exclusion
criteria on size of target
patient cohort
Identify and assess the
feasibility of the clinical
trial sites, their success
with previous clinical
trials conducted at facility
and the proximity to the
patient population
Assess the feasibility of
the protocol based on
introduction of screening
procedures involved and
attributes of study design
Pinpoint principal
investigators and the
affiliated institutions
(trial sites) for recruiting
the target cohort
1 2 3 4
Saama Technologies, Inc
Clinical
Data
Assets
Longitudinal
Real World
Data
Published
Literature
Social
Data
OMICs
Data
Patient Level
Data
Pipelines
Text
Analytics
Pipelines
Foundational
Applications
Workflow
Designer
Advanced
Analytics
Data Resolver
Business Rules
Editor
Cohort Builder
Business Specific
Applications
Clinical
Development
Clinical
Development
Feasibility
Safety Signals
Business &
Science Driven
Actionable RBM
CRO Oversight
Study Monitoring
Safety/Efficacy
Optimized
Protocol Design
and Site/PI
Selection
Automated Signal
Detection over
Global Data
Ad-Hoc Analytics
(e.g. drug
differentiation,
biomarker CDx
Outcomes
The Frontier
18
Semantically
Organized
Information
Meta Data
Security
Governance
Glossary
Saama Technologies, Inc
“If you look at history, innovation doesn’t come just from giving
people incentives; it comes from creating environments where
their ideas can connect.”
-Steven Johnson
Summary
• Apply DIKW framework, experience, and best practice for improving
operations.
• Addition of data assets such as Real World Information adds perspective
• Analytic applications (regardless of the presentation tool) should have
purposeful design therefore driving adoption and change.
19
Saama Technologies, Inc
2
0

Leverage Big Data Analytics to Enhance Clinical Trials from Planning to Execution

  • 1.
    Saama Technologies, Inc LeverageBig Data Analytics to Enhance Clinical Trials from Planning to Execution Nikhil Gopinath, Sr. Solutions Engineer – Life Sciences 2/21/17
  • 2.
    Saama Technologies, Inc Agenda •A framework to prepare data and drive impactful trial management • Data assets including the real world • Innovative applications and demos 2
  • 3.
    Saama Technologies, Inc Merge DATA Syndicat ed CRO External Systems Prepare INFORMATIO N DeriveKNOWLEDGE with Predictive & Prescriptive Insights Connect & transfer CTMS & EDC Standardize to a Data Model Calculate KPIs & KRIs Intuitive Guidance Driving Decisions with the DIKW Framework 3
  • 4.
    Saama Technologies, Inc Prepare INFORMATIO N DeriveKNOWLEDGE with Predictive & Prescriptive Insights Connect & transfer CTMS & EDC Standardize to a Data Model Calculate KPIs & KRIs Intuitive Guidance Driving Decisions with the DIKW Framework 4 Clinical Data Lake Intelligent Semantic Organization Intuitive Applications Continuous Knowledge Development for Decision Making
  • 5.
    Saama Technologies, Inc Genomics Internal,M&A, External, Syndicated Wearable Devices High Variety, Volume, & Velocity Data Analysis Organization Ingestion Automated Data Wrangling & Advanced Analysis Business Aware Clinical Data Analytics Services Oriented Architecture Harmonization Integration Analysis Organized Storage Provisioning Aggregation Modern Technologies Configurable Analytic Applications Business Outcomes Going Forward 5
  • 6.
    Saama Technologies, Inc Ingest& Rules Apply Standardiz e (CODM) Apply Metrics Analytic Ready Data Clinical Operations KPI/Metrics Pipeline Ingest & Rules Apply Standardiz e SDTM Convert to ADaM Analytic Ready Data Clinical Sciences Subject Analytics Pipeline CTMS Project Manage CRO EDC Labs Biomarker Clinical Development Analytics DIKW for Clinical 6
  • 7.
    Saama Technologies, Inc 7 •QIDA-I: • Define Key Capabilities that the business users will need to meet their objectives • BRIA: • Further refine use cases into region/role specific needs in context of data, visualization, & preferences • MOA: • Translate results from first two steps into traceable design template in visualization tool Global Clinops Stakeholder Interviews In-Scope Reporting Requirements Completed Use Case Template 360 View of Use Cases from all Roles & Regions Data Needs: Dimensions Measures Completed BRIA Template Translate requirements into design plan Iterative Design: wireframes & business signoff Completed MOA Template Question from Business Information Needed Decision to be driven Action to be taken Impact on Business Business Role-Based Intelligence Analysis Methods Of Analysis : Business : Systems/IT Business Analytics Engagement
  • 8.
    Saama Technologies, Inc QIDA-I 8 Use Case ID Functional Role(s) Requesting UseCase (Business Question) Information Needed to Answer Decision or Action to be Driven Business Impact Trace to ID’s U1.0 Clinical Data Manageme nt What is the query trend, origin of query, type of query & time to resolve? • Rate of queries • Query origin • Region & Sub region • Resolution Time  Site Engagemen t  Query Resolution  EDC Validation  Planned vs. Actual Timeline Impact (DBL)  Data Quality O1, U1.0 Objective ID Use Case ID Dashboard Use Case (Business Question) 01 U1.0 Inquiries What is the query trend, origin of query, type of query & time to resolve?
  • 9.
    Saama Technologies, Inc BRIA 9 UseCase ID: U1.0 Role(s) Requesting: Clinical Data Management Use Case (Business Question): What is the query trend, origin of query, type of query & time to resolve? Information / Metrics Time Frequency Information View / Display Format Data Source(s) Comments Rate of queries by selectable Time Period Weekly 1. Query Dashboard 2. Regional Dashboard EDC Data Validation Tool Output Metric Selection Present Country, Hub, Rollup Hierarchy as Prompt Include metric flagging and forwarding to stakeholders
  • 10.
    Saama Technologies, Inc MOA 10 KrishnankuttyB, Bellary S, Kumar NBR, Moodahadu LS. Data management in clinical research: An overview. Indian Journal of Pharmacology. 2012;44(2):168-172. doi:10.4103/0253-7613.93842. Portfolio Country Site
  • 11.
    Saama Technologies, Inc TargetSpecific SitesAssess the Landscape Home Question: With the numerous studies and sites to manage within a portfolio, how can we quickly and easily assess our progress? Dashboard Outcomes: Displays an overview of studies within a portfolio by providing performance scores. Automatically flags low scoring studies and sites for further evaluation. Displays the size of each study along with its aggregate performance score Study Status Provides a historical record and status update of predefined milestones on a site and study basis Study Alerts Details all studies involved in portfolio Study Indication Summarizes the predefined milestones and associated delays Milestone Status Flags specific sites to assess, with the severity of risk, and the cause for the alert Portfolio Alerts Chart Function 11
  • 12.
    Saama Technologies, Inc TargetSpecific SitesDrill Into Problematic Regions Showcases the country’s ability to effectively enroll patients for their studies Global View – Enrollment Ratio Details each country’s max screen failures Country: SFR Shows the number of sites that are on track and ones that are potentially delayed Most Delayed Countries Compares the actual vs. planned cost by each country Cost Up to Date Shows the number of milestones per site that are on track and the ones that are potentially delayed Most Delayed Sites Chart Function Country Question: With so many studies reaching across the globe, how can we manage and asses different countries to determine the most promising sites for effective research? Dashboard Outcomes: Evaluates each country by participation and effectiveness in Clinical Trials based on different aspects. Details the delay for each predefined milestone Milestone Box Plot 12
  • 13.
    Saama Technologies, Inc TargetSpecific SitesTarget Specific Sites Alerts the user of issues with this particular site and provides details, a suggested mitigation, and reliability assessment of the information Summary Bar Outlines the predicted enrollment, actual enrollment, planned enrollment, and screen failures across time Enrollment Performance Details a site’s compliance with a planned schedule across predefined milestones Conduct Site Milestone Identifies high- risk sites based on low enrollment percentages High-Risk Sites Compares the actual and planned of each site Cost Up To Date Chart Function Site Question: In any study, there are several sites to manage and track. How can I quickly oversee all studies and be alerted of specific sites that require help? Dashboard Outcomes: Provides a complete status evaluation that will alert to problems within the site and recommend a solution. 13
  • 14.
    Saama Technologies, Inc14 Data Assets Traditional Systems Additional Sources Bridge to Real World CTMS EDC IvRS ERP ePRO Claims EMR FDA ClinicalTrials.gov Population Health Forums CRO TrialsTrove Registries 1 2 3
  • 15.
    Saama Technologies, Inc $10B+ wasted annually Protocol Amendments •2+ per study • $535k+ to amend • 34% avoidable Poor Site/Investigator Selection • 20% recruit NO subjects • 72% delayed over month • $1M+ cost per day delay Clinical Development Feasibility: $10B+ annual problem Avg. cost of RCTs* $1B Sources: Tufts CSDD, Clinical Leader, Pharm Source $127 B 2016 R&D Spend $148 B 2020 R&D Spend 5-6% Market Trends 15
  • 16.
    Saama Technologies, Inc ClinicalDevelopment Feasibility with Real World Data Major trends: Competition for trial sites, investigators and patients continues to rise so studies overrun projected time and costs. 16 80% of trials fail to meet enrollment timelines Up to 50% of research trial sites enroll one or no patients $100 M: The cost of a single clinical trial Description: Assess risks of a potential clinical trial in terms of protocol design, investigator selection, site selection, and study design using Real World Data. Receive feedback/insights on how to reduce those risks. Benefits: Pursue studies with higher-likelihood of enrolling patients and achieving budgetary targets. Primary users: Study Manager, Study Principal Investigator, Medical Monitor
  • 17.
    Saama Technologies, Inc17 Clinical Development Feasibility Capabilities Enrollment Analysis for Protocol Principal Investigator Analysis Site Selection Analysis Study Design Analysis Define and modify target cohort using dynamic inclusion/exclusion criteria and view it geographically Assess the relative impact of each inclusion/exclusion criteria on size of target patient cohort Identify and assess the feasibility of the clinical trial sites, their success with previous clinical trials conducted at facility and the proximity to the patient population Assess the feasibility of the protocol based on introduction of screening procedures involved and attributes of study design Pinpoint principal investigators and the affiliated institutions (trial sites) for recruiting the target cohort 1 2 3 4
  • 18.
    Saama Technologies, Inc Clinical Data Assets Longitudinal RealWorld Data Published Literature Social Data OMICs Data Patient Level Data Pipelines Text Analytics Pipelines Foundational Applications Workflow Designer Advanced Analytics Data Resolver Business Rules Editor Cohort Builder Business Specific Applications Clinical Development Clinical Development Feasibility Safety Signals Business & Science Driven Actionable RBM CRO Oversight Study Monitoring Safety/Efficacy Optimized Protocol Design and Site/PI Selection Automated Signal Detection over Global Data Ad-Hoc Analytics (e.g. drug differentiation, biomarker CDx Outcomes The Frontier 18 Semantically Organized Information Meta Data Security Governance Glossary
  • 19.
    Saama Technologies, Inc “Ifyou look at history, innovation doesn’t come just from giving people incentives; it comes from creating environments where their ideas can connect.” -Steven Johnson Summary • Apply DIKW framework, experience, and best practice for improving operations. • Addition of data assets such as Real World Information adds perspective • Analytic applications (regardless of the presentation tool) should have purposeful design therefore driving adoption and change. 19
  • 20.