The document analyzes face-to-face behavioral networks using wearable RFID devices to study human interactions in social environments, focusing on two case studies: the Science Gallery in Dublin and the HT09 conference in Turin. It discusses the network structure, resilience, and the dynamics of information spreading through human interactions, while emphasizing the importance of understanding network properties for applications in computer science and epidemiology. The findings highlight the relationship between network topology and the spread of information, illustrating the variability of dynamics across different social settings.


![Deterministic SI model 2/2
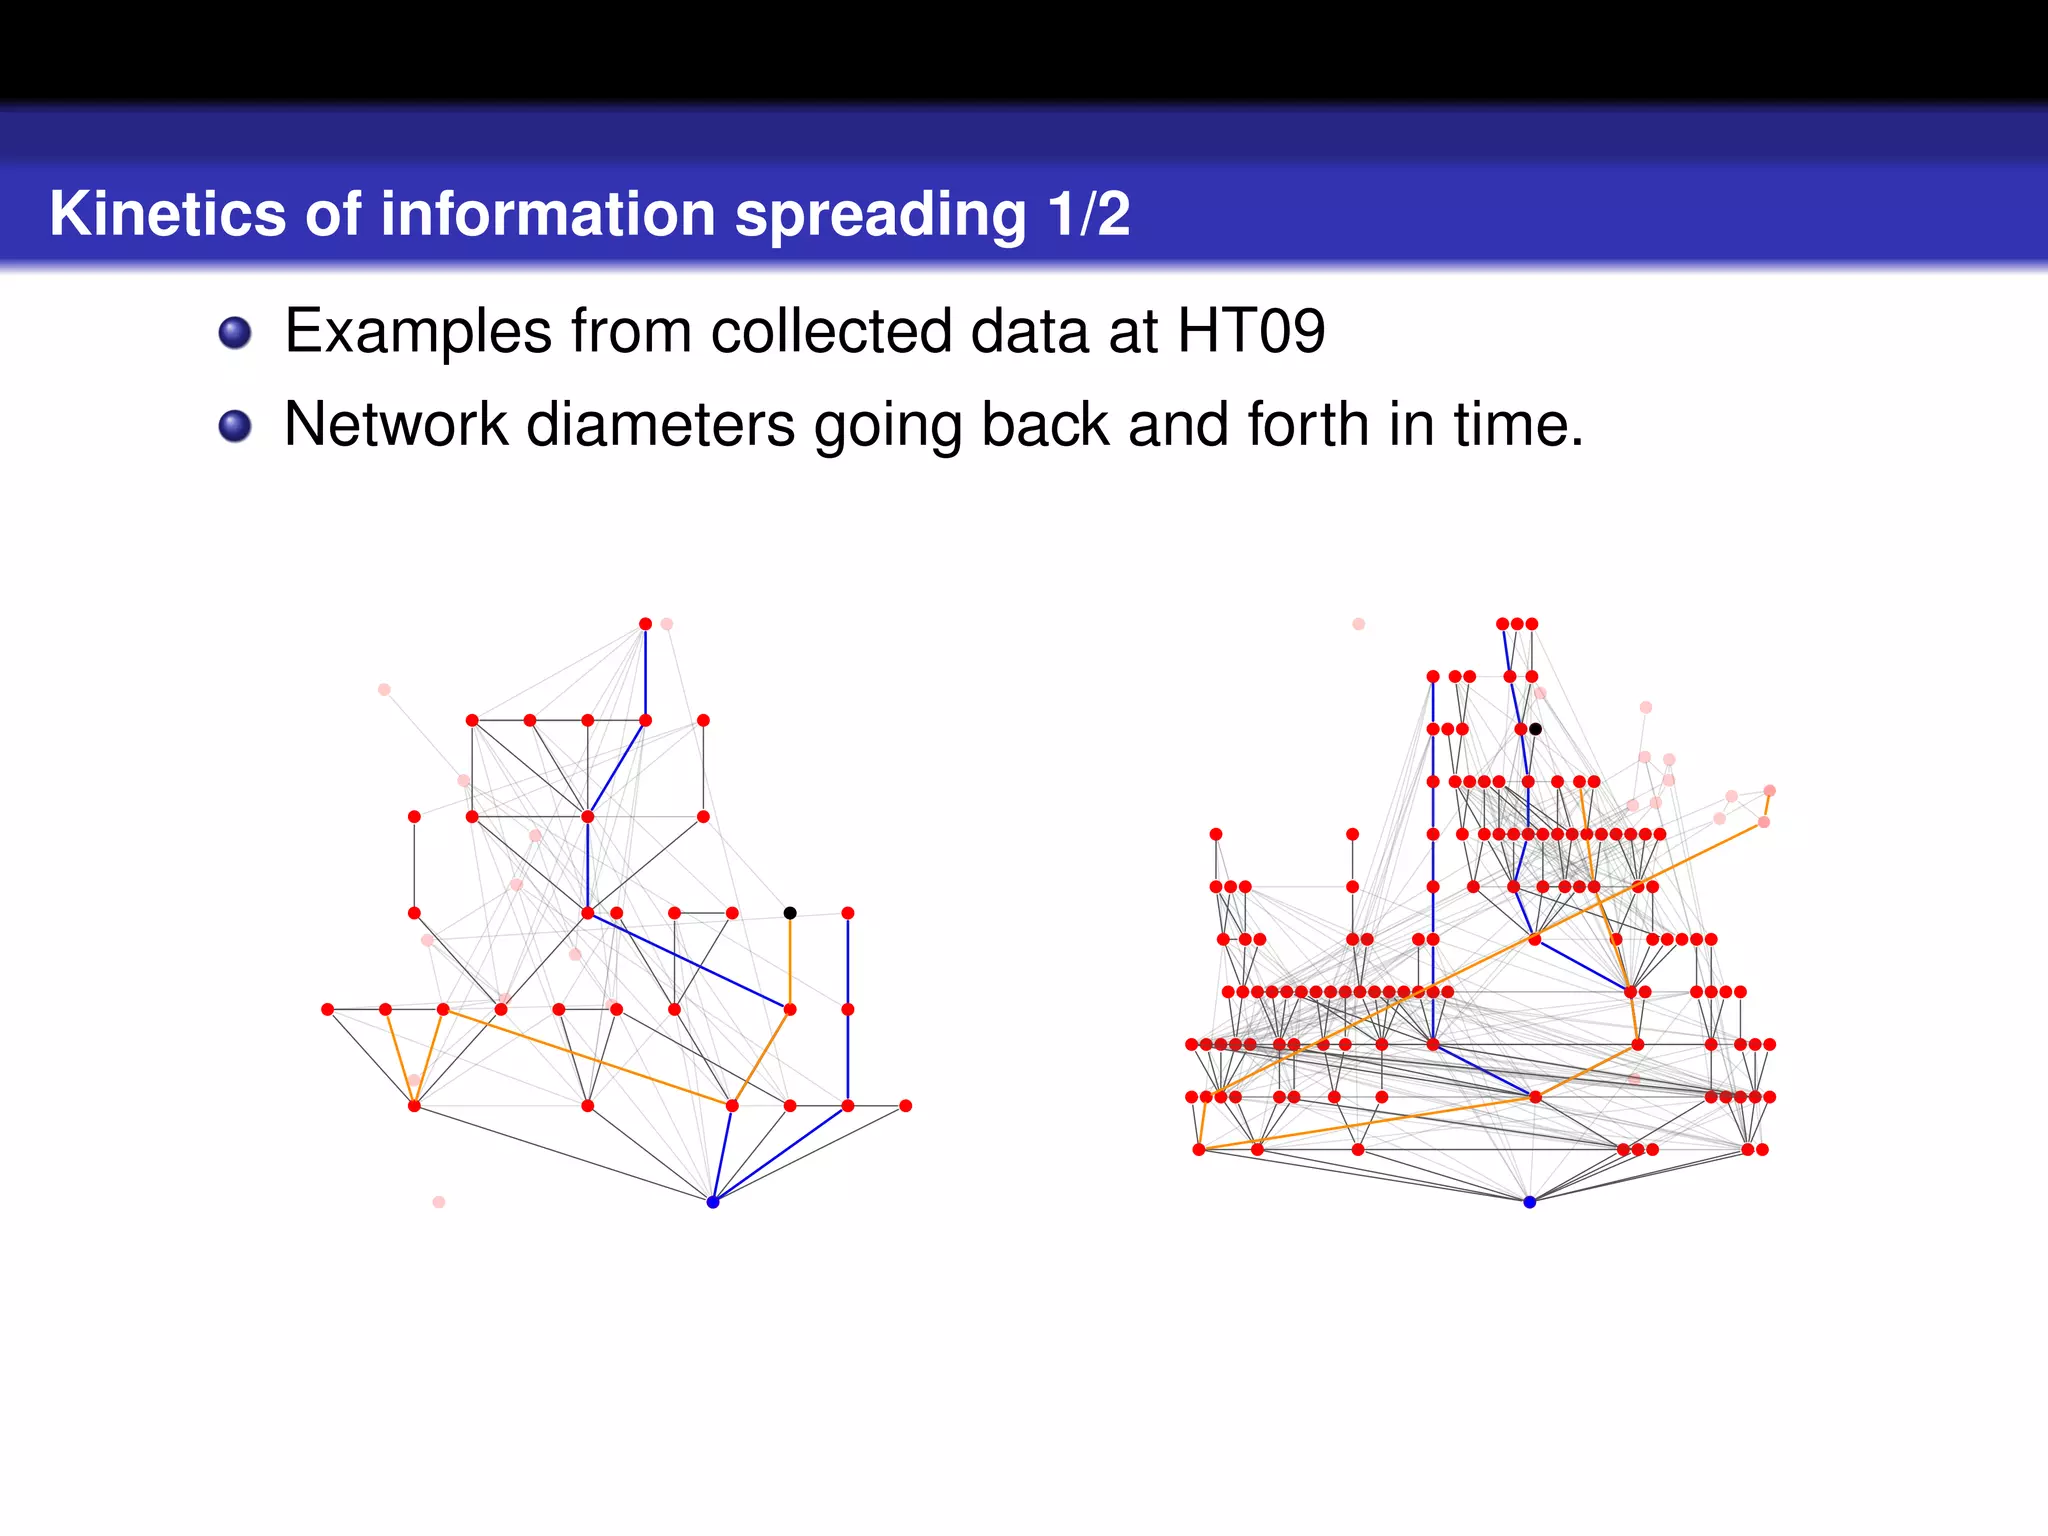
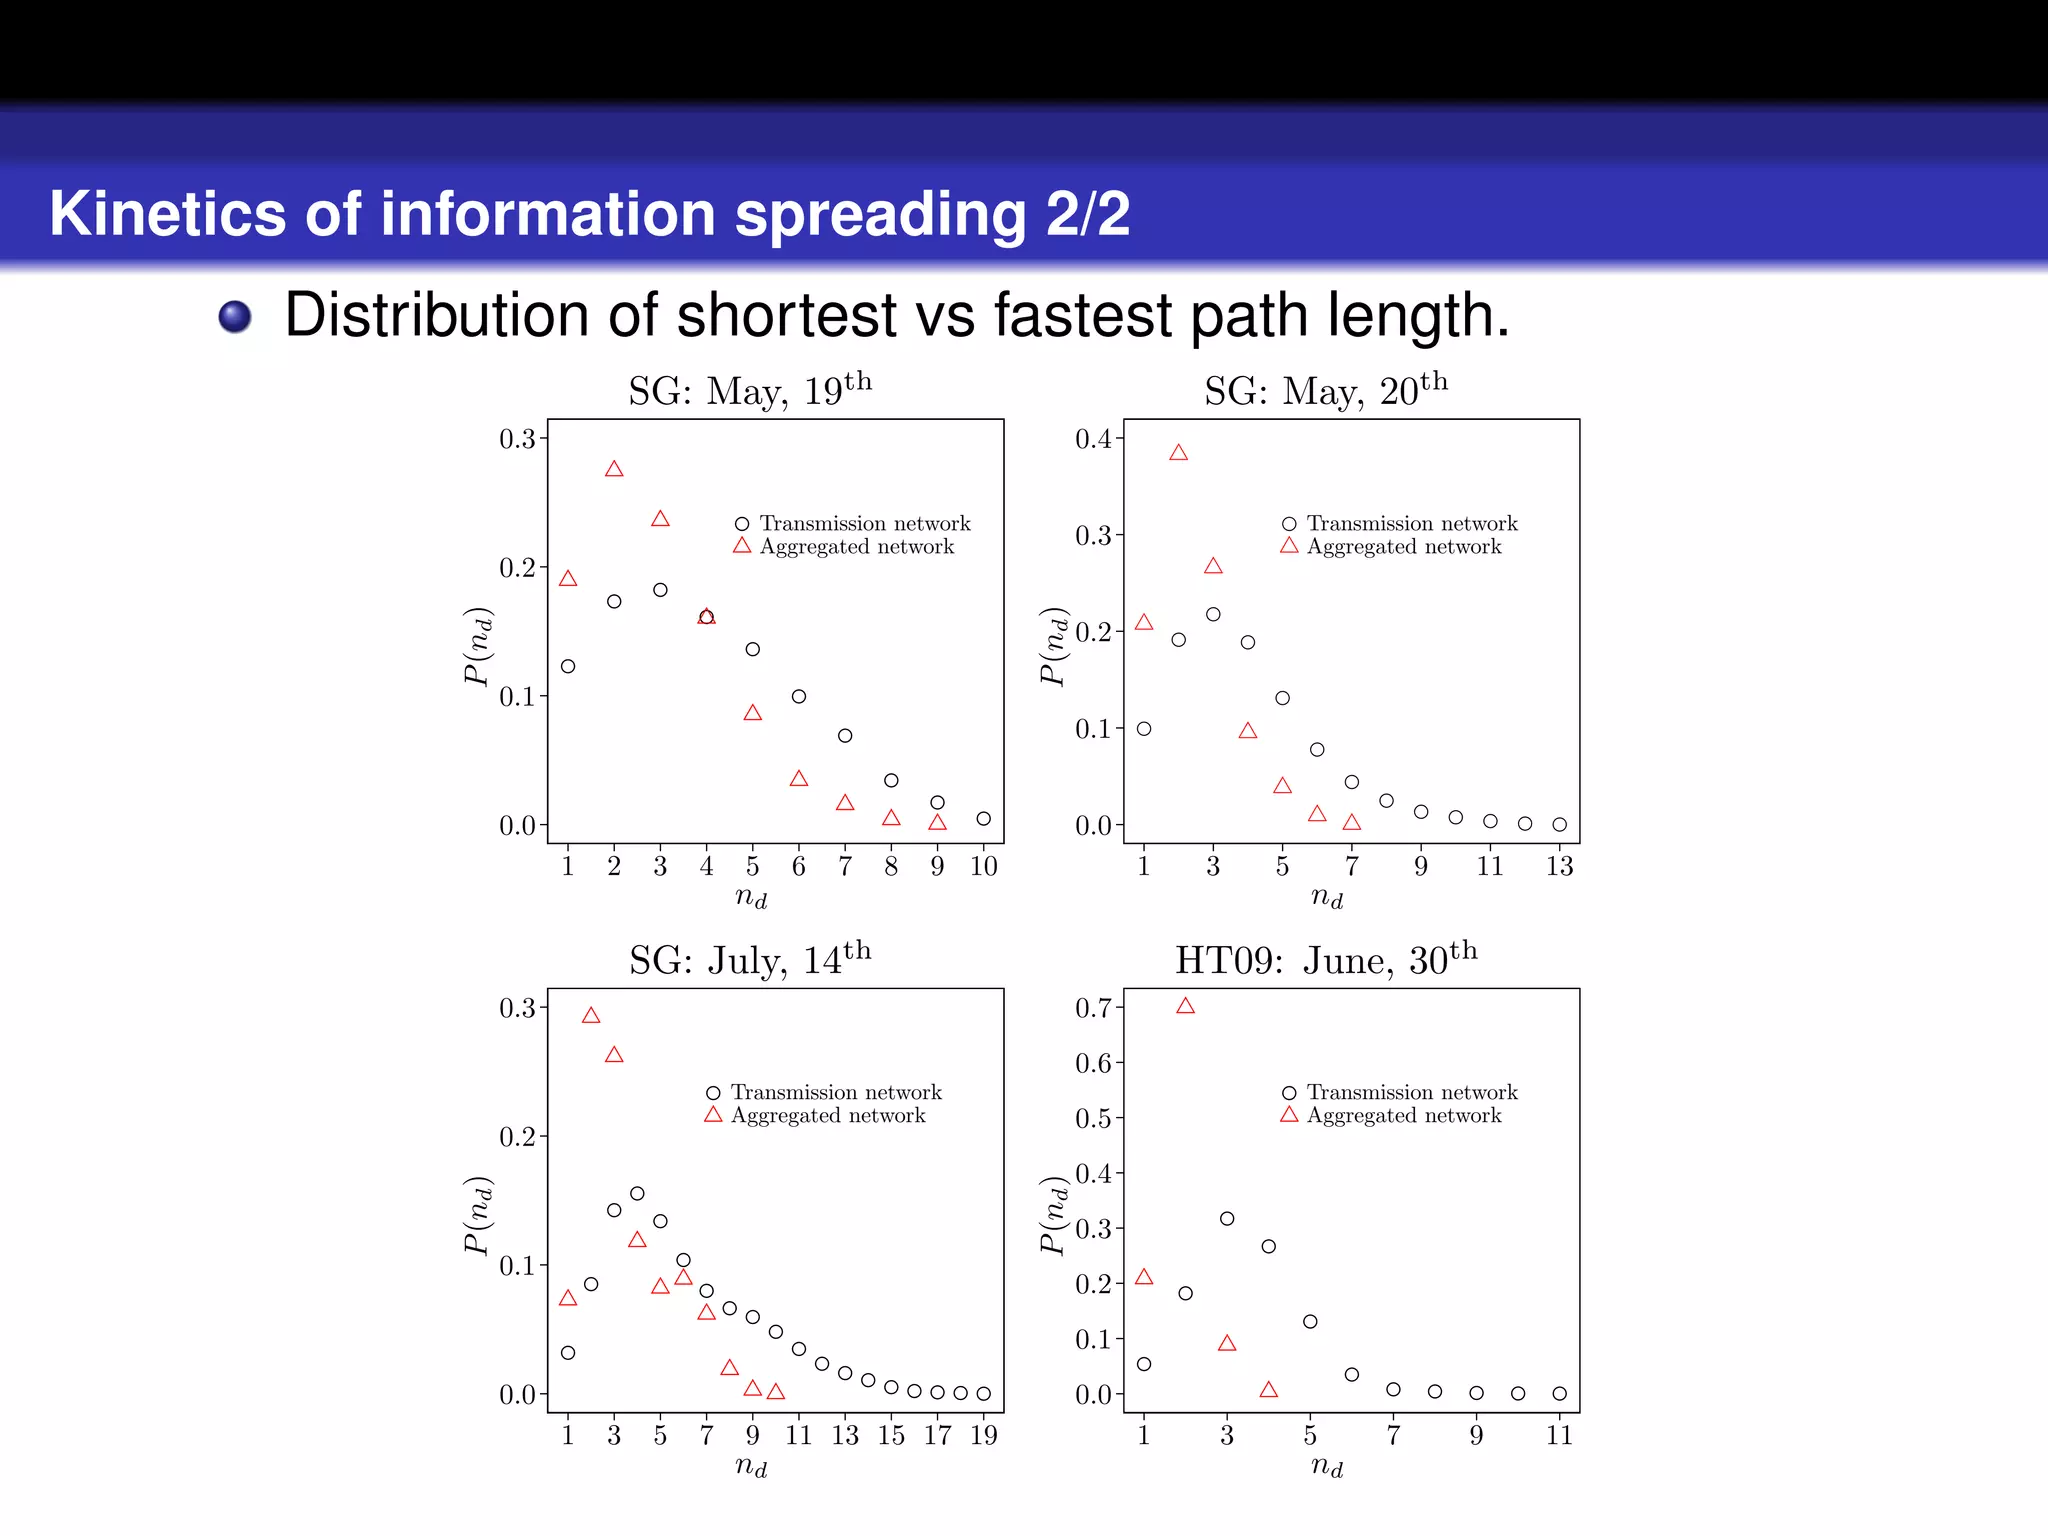
Processes of and on the network
partially aggregated network [human contacts]
transmission network [information spreading].
transmission network ⊆ partially aggregated network
nodes outside seed’s CC cannot be reached by infection
Fastest path = shortest path.](https://image.slidesharecdn.com/leshouches-12949298644207-phpapp02/75/Les-Houches-27-2048.jpg)
![Deterministic SI model 2/2
Processes of and on the network
partially aggregated network [human contacts]
transmission network [information spreading].
transmission network ⊆ partially aggregated network
nodes outside seed’s CC cannot be reached by infection
Fastest path = shortest path.](https://image.slidesharecdn.com/leshouches-12949298644207-phpapp02/75/Les-Houches-28-2048.jpg)
![Deterministic SI model 2/2
Processes of and on the network
partially aggregated network [human contacts]
transmission network [information spreading].
transmission network ⊆ partially aggregated network
nodes outside seed’s CC cannot be reached by infection
Fastest path = shortest path.](https://image.slidesharecdn.com/leshouches-12949298644207-phpapp02/75/Les-Houches-29-2048.jpg)