Download to read offline


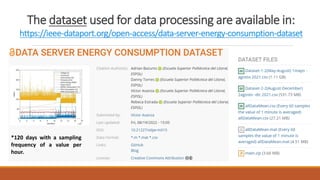
![RELATED WORK
Energy
Prediction
Methods
INPUT
VARIABLES
OUTPUT
VARIABLES
A.I
ALGOROITHM
• CPU Workload, Memory disk workload, I/O Unit Workload [9].
• Quantity Data to process [10].
• Number of file downloads on Servers [12].
• Speed of energy consumption from a server [13].
• Energy consumption [8].
• Relative and absolute average of workloads [9].
• CPU frequency [10].
• Number of abstract views on the servers [12].
• Energy consumption from data center servers [13].
• Linear prediction weighted [8]. Tests were done on 5, 10 and
20minute interval.
• Neuronal Network BP, Elman and LSTM TIME lapses in seconds [9].
• Support vector regression data was collected for 1 year [13].](https://image.slidesharecdn.com/12thinternationalconferenceonsustainableenergyinformationtechnology-learning-basedenergyconsumptionp-221210192017-47a53e37/85/Learning-based-Energy-Consumption-Prediction-6-320.jpg)


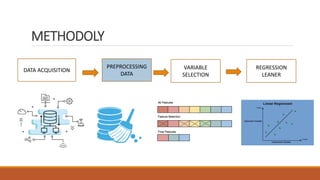
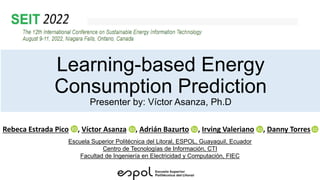
![RESULTS
During the validation process:
◦ Hourly predicted values are similar to real
energy consumption with a MAE value of
0.0885 [kWh] and a RMSE of 0.025712
[kWh] .
◦ Daily prediction values showed that the
model is an underfitted model because of its
MAE of 3.2255 [kWh] and a RMSE of
3.25029 [kWh],](https://image.slidesharecdn.com/12thinternationalconferenceonsustainableenergyinformationtechnology-learning-basedenergyconsumptionp-221210192017-47a53e37/85/Learning-based-Energy-Consumption-Prediction-21-320.jpg)
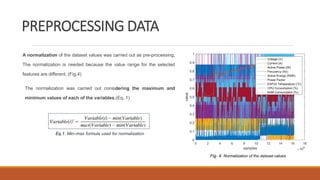
![CONCLUSION
1. Energy consumption in days, presents an RMSE of 3.25029 [kWh], which is an
indicator that the model is underfitting in this time window.
2. Energy consumption in One-Hours, presents an RMSE of 0.025712 [kWh], which is
an indicator that the model is not over-fitted in this time window.
3. Robust Linear Regression Model, was selected based on the RMSE of the energy
consumption predicted value.](https://image.slidesharecdn.com/12thinternationalconferenceonsustainableenergyinformationtechnology-learning-basedenergyconsumptionp-221210192017-47a53e37/85/Learning-based-Energy-Consumption-Prediction-22-320.jpg)


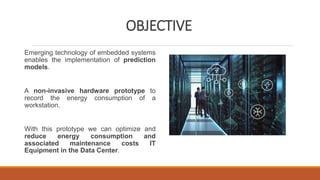
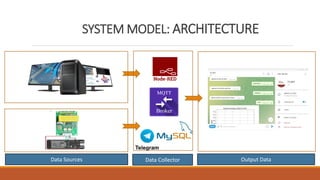
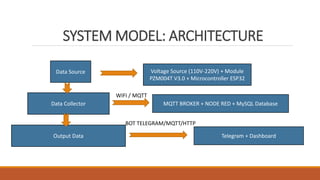
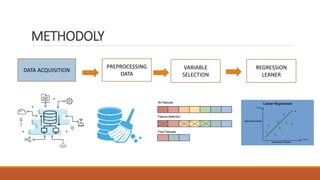
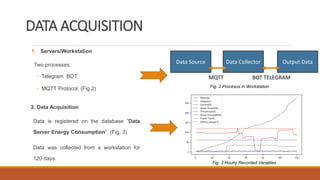
The document presents a methodology for predicting energy consumption using a non-invasive hardware prototype based on embedded systems to optimize energy use in data centers. It details a system model utilizing ESP32 hardware for data collection and various regression algorithms for prediction accuracy, highlighting results that demonstrate varying levels of fit depending on the time window analyzed. The conclusion indicates that while hourly predictions show high accuracy, daily predictions indicate an underfitting issue, suggesting further refinement may be needed.