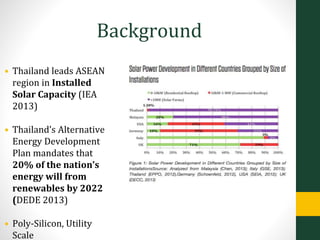
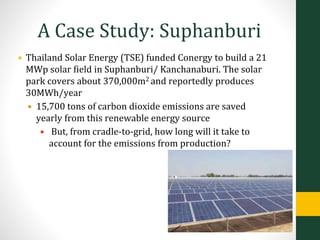
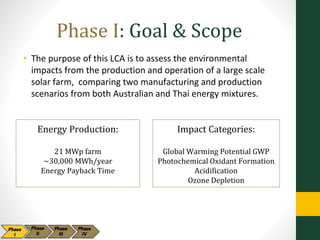
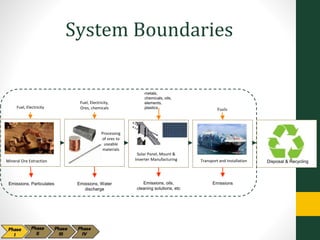
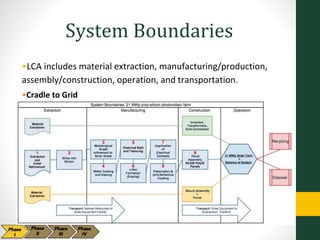
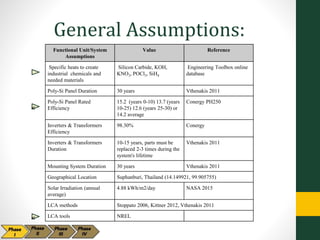
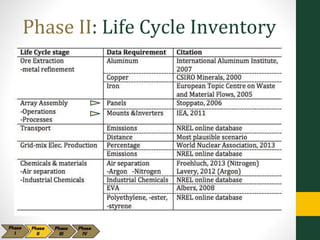
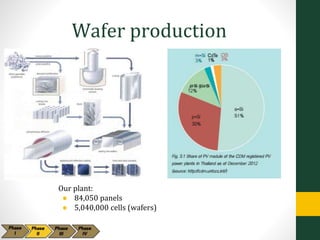
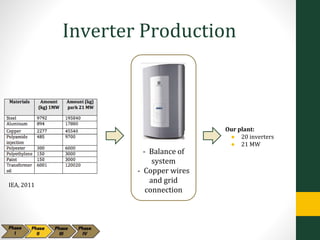
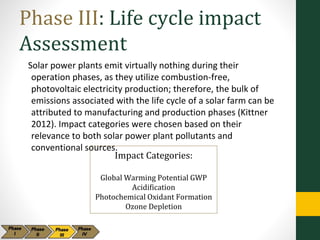
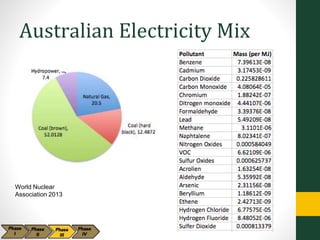
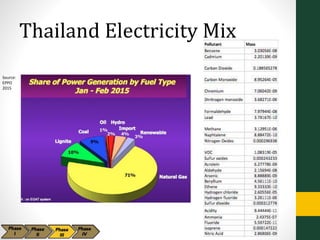
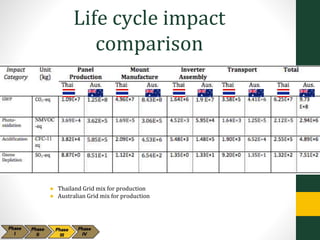
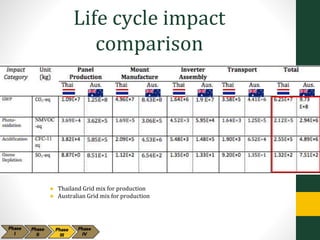
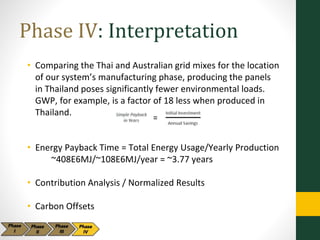
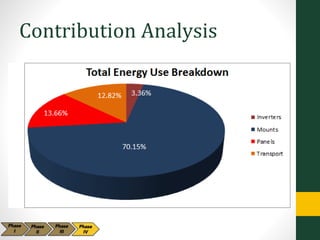
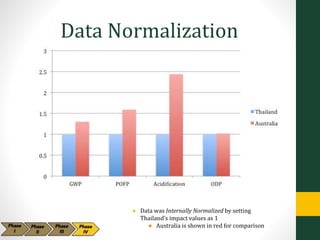
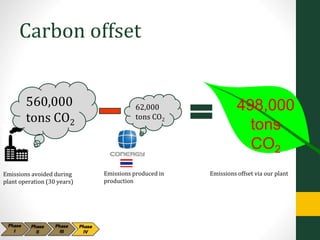
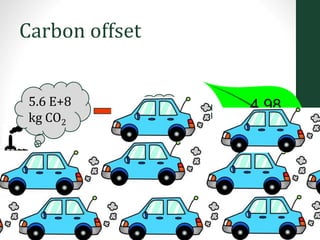
LCA: Utility-Scale PV
By:
Chris Graham
Connor Jarvis
Raymond Stanton
Background
• Thailand leads ASEAN
region in Installed
Solar Capacity (IEA
2013)
• Thailand’s Alternative
Energy Development
Plan mandates that
20% of the nation’s
energy will from
renewables by 2022
(DEDE 2013)
• Poly-Silicon, Utility
Scale
Why Solar investment?
A Case Study: Suphanburi
• Thailand Solar Energy (TSE) funded Conergy to build a 21
MWp solar field in Suphanburi/ Kanchanaburi. The solar
park covers about 370,000m2 and reportedly produces
30MWh/year
• 15,700 tons of carbon dioxide emissions are saved
yearly from this renewable energy source
• But, from cradle-to-grid, how long will it take to
account for the emissions from production?
LOCATION:
-Suphanburi, Thailand
-(14.149921, 99.905755)
Phase I: Goal & Scope
• The purpose of this LCA is to assess the environmental
impacts from the production and operation of a large scale
solar farm, comparing two manufacturing and production
scenarios from both Australian and Thai energy mixtures.
Impact Categories:
Global Warming Potential GWP
Photochemical Oxidant Formation
Acidification
Ozone Depletion
Energy Production:
21 MWp farm
~30,000 MWh/year
Energy Payback Time
Goal Definition cont.
• Audience
•Policy makers and public utility commissioners
⇊Improve environmental performance in manufacturing
of solar panels
•Limitations
•Does not account for long term advancements in solar
⇊Temporal limit of 10 years
•Not a evaluation of system but to show
how grid mix impacts environmental
sustainability
Functional Unit
Comparative LCA of a solar farm under two grid mix
productions
• Australia
• Thailand
Quantity Duration Qualities
Yearly electricity
production of a 21
MWp poly-silicon
solar photovoltaic
farm.
- 30,000 MWh
30 years Efficiency
Energy Consumption
Lifetime
Processing
of ores to
useable
materials
System Boundaries
Mineral Ore Extraction
Fuel, Electricity,
Ores, chemicals
Solar Panel, Mount &
Inverter Manufacturing Transport and Installation Disposal & Recycling
Emissions, Particulates Emissions, Water
discharge
metals,
chemicals, oils,
elements,
plasticsFuel, Electricity Fuels
EmissionsEmissions, oils,
cleaning solutions, etc
•LCA includes material extraction, manufacturing/production,
assembly/construction, operation, and transportation.
•Cradle to Grid
System Boundaries
General Assumptions:
Functional Unit/System
Assumptions
Value Reference
Specific heats to create
industrial chemicals and
needed materials
Silicon Carbide, KOH,
KNO3, POCl3, SiH4
Engineering Toolbox online
database
Poly-Si Panel Duration 30 years Vthenakis 2011
Poly-Si Panel Rated
Efficiency
15.2 (years 0-10) 13.7 (years
10-25) 12.6 (years 25-30) or
14.2 average
Conergy PH250
Inverters & Transformers
Efficiency
98.30% Conergy
Inverters & Transformers
Duration
10-15 years, parts must be
replaced 2-3 times during the
system's lifetime
Vthenakis 2011
Mounting System Duration 30 years Vthenakis 2011
Geographical Location Suphanburi, Thailand (14.149921, 99.905755)
Solar Irradiation (annual
average)
4.88 kWh/m2/day NASA 2015
LCA methods Stoppato 2006, Kittner 2012, Vthenakis 2011
LCA tools NREL
vv
Allocation Procedures
• In LCA, a multifunctional process is one that produces
multiple products using the same process.
• The solar farm in this study has one sole product:
electricity.
• Since our process is not multifunctional, allocation is
unnecessary and is avoided altogether.
Phase II: Life Cycle Inventory
Wafer production
Our plant:
● 84,050 panels
● 5,040,000 cells (wafers)
Wafer production: Unit processes
Unit processes cont...
- Array mount
manufacturing
- Fence &
cement
included
Mount Production
Our plant:
● 7004 mounts
● 138,017.496 m2
IEA, 2011
2547.84 kg
cement
Inverter Production
- Balance of
system
- Copper wires
and grid
connection
Our plant:
● 20 inverters
● 21 MW
IEA, 2011
Transport Calculations
NREL database,
(2015)
Ship
Short-Haul
Truck Long-Haul
Truck
Phase III: Life cycle impact
Assessment
Solar power plants emit virtually nothing during their
operation phases, as they utilize combustion-free,
photovoltaic electricity production; therefore, the bulk of
emissions associated with the life cycle of a solar farm can be
attributed to manufacturing and production phases (Kittner
2012). Impact categories were chosen based on their
relevance to both solar power plant pollutants and
conventional sources.
Impact Categories:
Global Warming Potential GWP
Acidification
Photochemical Oxidant Formation
Ozone Depletion
Australian Electricity Mix
World Nuclear
Association 2013
Thailand Electricity Mix
Source:
EPPO
2015
Life cycle impact
comparison
● Thailand Grid mix for production
● Australian Grid mix for production
Life cycle impact
comparison
● Thailand Grid mix for production
● Australian Grid mix for production
Phase IV: Interpretation
• Comparing the Thai and Australian grid mixes for the location
of our system’s manufacturing phase, producing the panels
in Thailand poses significantly fewer environmental loads.
GWP, for example, is a factor of 18 less when produced in
Thailand.
• Energy Payback Time = Total Energy Usage/Yearly Production
~408E6MJ/~108E6MJ/year = ~3.77 years
• Contribution Analysis / Normalized Results
• Carbon Offsets
Contribution Analysis
Data Normalization
● Data was Internally Normalized by setting
Thailand’s impact values as 1
● Australia is shown in red for comparison
Carbon offset
62,000
tons CO2
Emissions produced in
production
Emissions avoided during
plant operation (30 years)
560,000
tons CO2
498,000
tons
CO2
Emissions offset via our plant
Carbon offset
6.20 E+7
kg CO2
Emissions produced in
production
Emissions avoided during
plant operation (30 years)
5.6 E+8
kg CO2
4.98
E+8 kg
CO2
Emissions offset via our plant
Carbon offset
6.20 E+7
kg CO2
Emissions produced in
production
Emissions avoided during
plant operation (30 years)
5.6 E+8
kg CO2
4.98
E+8 kg
CO2
Emissions offset via our plant
That’s equivalent to
removing 104,842
passenger vehicles
for a year!
Phase V: Conclusions
• Utility-scale solar applications are a sustainable alternative to
conventional power generation.
• The manufacturing/production phase of the panels
represents the greatest contribution to emissions during the
life cycle of a solar farm, specifically the mounting structures.
• Relocating manufacturing and production operations
domestically, or to other less carbon-intensive grid mixtures,
would greatly reduce the overall emissions of a solar farm.
• Recycling of panels is under significant research and
development, and disposal of panels to landfills will no
longer be as realistic at the end of our system’s life. More
recycling LCA’s would support solar LCA’s
Phase
V
References:Albers, Kyle. Analyzing the Environmental Impacts of Simple Shoes: A Life Cycle Assessment of the Supply Chain and Evaluation of End-of-Life Management Options. Donald Bren School of Environmental
Science and Management. 2008
Birol F., Bromhead A., Ikeyama S., Blasi A., and Frank M. (2013) Southeast Asia Energy Outlook, World Energy Outlook Special Report. International Energy Agency (IEA).
https://www.iea.org/publications/freepublications/publication/world-energy-outlook-special-report-2013-southeast-asia-energy-outlook.html
Brouwer, K. A. (2011). Methods and Concerns for Disposal of Photovoltaic Solar Panels (Doctoral dissertation, San Jose State University). url:
http://generalengineering.sjsu.edu/docs/pdf/mse_prj_rpts/fall2011/METHODS%20AND%20CONCERNS%20FOR%20DISPOSAL%20OF%20PHOTOVOLTAICS.pdf
Conergy. (2015). Australia Conergy. General reference. url. http://www.conergy.com.au/about-conergy
Conergy. (2014). Conergy PH 225-250P. Technical Data. Photo Modules. Url: http://www.solarwyse.ca/ConergyPH_225P-250P_3-busbar_TD_ENG_0512_v1.pdf
Conergy. (2014). Reference Project | On-Grid, Free-Field | 21 MW: Suphanburi/Kanchanaburi, Thailand. Conergy Asia. Url: http://asia.conergy.com/wp-content/uploads/2014/10/SSE3_Reference-Project-
Sheets_LR.pdf
Department of Alternative Energy Development and Efficiency (DEDE). (2014). Annual Report 2013. Ministry of Energy. Url: http://www4.dede.go.th/dede/images/stories/file/ann2013eng.pdf
Department of Alternative Energy Development and Efficiency (DEDE). (2014). Table of Thailand Energy Balance 2014. Ministry of Energy. Url:
http://www4.dede.go.th/dede/index.php?option=com_content&view=article&id=1841%3A2010-09-22-07-02-07&catid=128&lang=th
Energy Policy and Planning Office (EPPO). (2015). Electricity Energy Statistics | 2015 Capacity. URl: http://www.eppo.go.th/info/5electricity_stat.htm
Froehlich, Peter. A Sustainable Approach to the Supply of Nitrogen. Parker Hannifin Corporation. 2013.
Fthenakis V., Kim H. C., Frischknecht R., Raugei M., Sinha P., Stucki M. (2011) Life
Cycle Inventories and Life Cycle Assessment of Photovoltaic Systems, International Energy
Agency(IEA) PVPS Task 12, Report T12-02:2011.
International Index of Energy Security Risk: Assessing Risk in a Global Energy Market. U.S. Chamber of Commerce Institute for 21st Century Energy. 2013
Kirtikara K.,Kitichantaropas P., Chenvidhya D. (2013). Thailand PV status report 2012-2013. Department of Alternative Energy Development and Efficiency (DEDE), Ministry of Energy. Url:
http://www4.dede.go.th/dede/images/stories/jum_circular_55/PV_Status_Report_eng_final.pdf
Kittner N., Gheewala S., Kamens R.(2012) Life Cycle Considerations for Monocrystalline Photovoltaics in Thailand. J Sustainable Energy & Environment 3 143-146
Life Cycle assessment of Aluminum: Inventory Data For the primary Aluminum Industry. International Aluminum Institute. 2007.
Margolis, R. (2006). A Review of PV Inverter Technology Cost and Performance Projections. U.S. Department of Energy’s (U.S. DOE) Office of Energy Efficiency and Renewable Energy (EERE) under National
Renewable Energy Laboratory (NREL) Contract No. KACX-4-44451-04. url: http://www.nrel.gov/docs/fy06osti/38771.pdf
National Renewable Energy Laboratory (NREL). (accessed 2015). LCA database. Url: http://www.nrel.gov/analysis/sustain_lca_pv.html
Office of Energy Efficiency and Renewable Energy. (2013). Photovoltaic Electrical Contact and Cell Coating Basics. US Department of Energy. Energy.gov. Url:
http://energy.gov/eere/energybasics/articles/photovoltaic-electrical-contact-and-cell-coating-basics
Phumpradab K., Gheewala K., and M Sagisaka (2009). Life cycle assessment of natural gas power plants in Thailand. International Journal of Life Cycle Assessment 14(4): pp. 354-363. June 2009.
P. Lavery, et. al. Life cycle assessment of a sponge nickel produced by gas atomization for use of in industrial hydrogenation catalysis applications. The Inernational Journal of Life Cycle Assessment.
Spring 2012
Stoppato A. (2008) Life cycle assessment of photovoltaic electricity generation. J Energy 33:224-232
Thailand Board of Investors. (2014). Thailand Alternative Energy Industry.The Board Investment of Thailand. Url: http://www.boi.go.th/index.php?page=brochure
Thai Solar Energy Company. (2015). Url. http://www.thaisolarenergy.com/index.php
Zipp, K. (2011). Solar Inverter step-up transformers need a new design approach. Solar Power World. Url: www.solarpowerworldonline.com/2011/07/solar-inverter-step-up-transformers-need-a-new-design-
approach/

LCA-SolarFINAL

  • 1.
    LCA: Utility-Scale PV By: ChrisGraham Connor Jarvis Raymond Stanton
  • 2.
    Background • Thailand leadsASEAN region in Installed Solar Capacity (IEA 2013) • Thailand’s Alternative Energy Development Plan mandates that 20% of the nation’s energy will from renewables by 2022 (DEDE 2013) • Poly-Silicon, Utility Scale
  • 3.
  • 4.
    A Case Study:Suphanburi • Thailand Solar Energy (TSE) funded Conergy to build a 21 MWp solar field in Suphanburi/ Kanchanaburi. The solar park covers about 370,000m2 and reportedly produces 30MWh/year • 15,700 tons of carbon dioxide emissions are saved yearly from this renewable energy source • But, from cradle-to-grid, how long will it take to account for the emissions from production?
  • 5.
  • 6.
    Phase I: Goal& Scope • The purpose of this LCA is to assess the environmental impacts from the production and operation of a large scale solar farm, comparing two manufacturing and production scenarios from both Australian and Thai energy mixtures. Impact Categories: Global Warming Potential GWP Photochemical Oxidant Formation Acidification Ozone Depletion Energy Production: 21 MWp farm ~30,000 MWh/year Energy Payback Time
  • 7.
    Goal Definition cont. •Audience •Policy makers and public utility commissioners ⇊Improve environmental performance in manufacturing of solar panels •Limitations •Does not account for long term advancements in solar ⇊Temporal limit of 10 years •Not a evaluation of system but to show how grid mix impacts environmental sustainability
  • 8.
    Functional Unit Comparative LCAof a solar farm under two grid mix productions • Australia • Thailand Quantity Duration Qualities Yearly electricity production of a 21 MWp poly-silicon solar photovoltaic farm. - 30,000 MWh 30 years Efficiency Energy Consumption Lifetime
  • 9.
    Processing of ores to useable materials SystemBoundaries Mineral Ore Extraction Fuel, Electricity, Ores, chemicals Solar Panel, Mount & Inverter Manufacturing Transport and Installation Disposal & Recycling Emissions, Particulates Emissions, Water discharge metals, chemicals, oils, elements, plasticsFuel, Electricity Fuels EmissionsEmissions, oils, cleaning solutions, etc
  • 10.
    •LCA includes materialextraction, manufacturing/production, assembly/construction, operation, and transportation. •Cradle to Grid System Boundaries
  • 11.
    General Assumptions: Functional Unit/System Assumptions ValueReference Specific heats to create industrial chemicals and needed materials Silicon Carbide, KOH, KNO3, POCl3, SiH4 Engineering Toolbox online database Poly-Si Panel Duration 30 years Vthenakis 2011 Poly-Si Panel Rated Efficiency 15.2 (years 0-10) 13.7 (years 10-25) 12.6 (years 25-30) or 14.2 average Conergy PH250 Inverters & Transformers Efficiency 98.30% Conergy Inverters & Transformers Duration 10-15 years, parts must be replaced 2-3 times during the system's lifetime Vthenakis 2011 Mounting System Duration 30 years Vthenakis 2011 Geographical Location Suphanburi, Thailand (14.149921, 99.905755) Solar Irradiation (annual average) 4.88 kWh/m2/day NASA 2015 LCA methods Stoppato 2006, Kittner 2012, Vthenakis 2011 LCA tools NREL vv
  • 12.
    Allocation Procedures • InLCA, a multifunctional process is one that produces multiple products using the same process. • The solar farm in this study has one sole product: electricity. • Since our process is not multifunctional, allocation is unnecessary and is avoided altogether.
  • 13.
    Phase II: LifeCycle Inventory
  • 14.
    Wafer production Our plant: ●84,050 panels ● 5,040,000 cells (wafers)
  • 15.
  • 16.
  • 17.
    - Array mount manufacturing -Fence & cement included Mount Production Our plant: ● 7004 mounts ● 138,017.496 m2 IEA, 2011 2547.84 kg cement
  • 18.
    Inverter Production - Balanceof system - Copper wires and grid connection Our plant: ● 20 inverters ● 21 MW IEA, 2011
  • 19.
  • 20.
    Phase III: Lifecycle impact Assessment Solar power plants emit virtually nothing during their operation phases, as they utilize combustion-free, photovoltaic electricity production; therefore, the bulk of emissions associated with the life cycle of a solar farm can be attributed to manufacturing and production phases (Kittner 2012). Impact categories were chosen based on their relevance to both solar power plant pollutants and conventional sources. Impact Categories: Global Warming Potential GWP Acidification Photochemical Oxidant Formation Ozone Depletion
  • 21.
    Australian Electricity Mix WorldNuclear Association 2013
  • 22.
  • 23.
    Life cycle impact comparison ●Thailand Grid mix for production ● Australian Grid mix for production
  • 24.
    Life cycle impact comparison ●Thailand Grid mix for production ● Australian Grid mix for production
  • 25.
    Phase IV: Interpretation •Comparing the Thai and Australian grid mixes for the location of our system’s manufacturing phase, producing the panels in Thailand poses significantly fewer environmental loads. GWP, for example, is a factor of 18 less when produced in Thailand. • Energy Payback Time = Total Energy Usage/Yearly Production ~408E6MJ/~108E6MJ/year = ~3.77 years • Contribution Analysis / Normalized Results • Carbon Offsets
  • 26.
  • 27.
    Data Normalization ● Datawas Internally Normalized by setting Thailand’s impact values as 1 ● Australia is shown in red for comparison
  • 28.
    Carbon offset 62,000 tons CO2 Emissionsproduced in production Emissions avoided during plant operation (30 years) 560,000 tons CO2 498,000 tons CO2 Emissions offset via our plant
  • 29.
    Carbon offset 6.20 E+7 kgCO2 Emissions produced in production Emissions avoided during plant operation (30 years) 5.6 E+8 kg CO2 4.98 E+8 kg CO2 Emissions offset via our plant
  • 30.
    Carbon offset 6.20 E+7 kgCO2 Emissions produced in production Emissions avoided during plant operation (30 years) 5.6 E+8 kg CO2 4.98 E+8 kg CO2 Emissions offset via our plant That’s equivalent to removing 104,842 passenger vehicles for a year!
  • 31.
    Phase V: Conclusions •Utility-scale solar applications are a sustainable alternative to conventional power generation. • The manufacturing/production phase of the panels represents the greatest contribution to emissions during the life cycle of a solar farm, specifically the mounting structures. • Relocating manufacturing and production operations domestically, or to other less carbon-intensive grid mixtures, would greatly reduce the overall emissions of a solar farm. • Recycling of panels is under significant research and development, and disposal of panels to landfills will no longer be as realistic at the end of our system’s life. More recycling LCA’s would support solar LCA’s Phase V
  • 32.
    References:Albers, Kyle. Analyzingthe Environmental Impacts of Simple Shoes: A Life Cycle Assessment of the Supply Chain and Evaluation of End-of-Life Management Options. Donald Bren School of Environmental Science and Management. 2008 Birol F., Bromhead A., Ikeyama S., Blasi A., and Frank M. (2013) Southeast Asia Energy Outlook, World Energy Outlook Special Report. International Energy Agency (IEA). https://www.iea.org/publications/freepublications/publication/world-energy-outlook-special-report-2013-southeast-asia-energy-outlook.html Brouwer, K. A. (2011). Methods and Concerns for Disposal of Photovoltaic Solar Panels (Doctoral dissertation, San Jose State University). url: http://generalengineering.sjsu.edu/docs/pdf/mse_prj_rpts/fall2011/METHODS%20AND%20CONCERNS%20FOR%20DISPOSAL%20OF%20PHOTOVOLTAICS.pdf Conergy. (2015). Australia Conergy. General reference. url. http://www.conergy.com.au/about-conergy Conergy. (2014). Conergy PH 225-250P. Technical Data. Photo Modules. Url: http://www.solarwyse.ca/ConergyPH_225P-250P_3-busbar_TD_ENG_0512_v1.pdf Conergy. (2014). Reference Project | On-Grid, Free-Field | 21 MW: Suphanburi/Kanchanaburi, Thailand. Conergy Asia. Url: http://asia.conergy.com/wp-content/uploads/2014/10/SSE3_Reference-Project- Sheets_LR.pdf Department of Alternative Energy Development and Efficiency (DEDE). (2014). Annual Report 2013. Ministry of Energy. Url: http://www4.dede.go.th/dede/images/stories/file/ann2013eng.pdf Department of Alternative Energy Development and Efficiency (DEDE). (2014). Table of Thailand Energy Balance 2014. Ministry of Energy. Url: http://www4.dede.go.th/dede/index.php?option=com_content&view=article&id=1841%3A2010-09-22-07-02-07&catid=128&lang=th Energy Policy and Planning Office (EPPO). (2015). Electricity Energy Statistics | 2015 Capacity. URl: http://www.eppo.go.th/info/5electricity_stat.htm Froehlich, Peter. A Sustainable Approach to the Supply of Nitrogen. Parker Hannifin Corporation. 2013. Fthenakis V., Kim H. C., Frischknecht R., Raugei M., Sinha P., Stucki M. (2011) Life Cycle Inventories and Life Cycle Assessment of Photovoltaic Systems, International Energy Agency(IEA) PVPS Task 12, Report T12-02:2011. International Index of Energy Security Risk: Assessing Risk in a Global Energy Market. U.S. Chamber of Commerce Institute for 21st Century Energy. 2013 Kirtikara K.,Kitichantaropas P., Chenvidhya D. (2013). Thailand PV status report 2012-2013. Department of Alternative Energy Development and Efficiency (DEDE), Ministry of Energy. Url: http://www4.dede.go.th/dede/images/stories/jum_circular_55/PV_Status_Report_eng_final.pdf Kittner N., Gheewala S., Kamens R.(2012) Life Cycle Considerations for Monocrystalline Photovoltaics in Thailand. J Sustainable Energy & Environment 3 143-146 Life Cycle assessment of Aluminum: Inventory Data For the primary Aluminum Industry. International Aluminum Institute. 2007. Margolis, R. (2006). A Review of PV Inverter Technology Cost and Performance Projections. U.S. Department of Energy’s (U.S. DOE) Office of Energy Efficiency and Renewable Energy (EERE) under National Renewable Energy Laboratory (NREL) Contract No. KACX-4-44451-04. url: http://www.nrel.gov/docs/fy06osti/38771.pdf National Renewable Energy Laboratory (NREL). (accessed 2015). LCA database. Url: http://www.nrel.gov/analysis/sustain_lca_pv.html Office of Energy Efficiency and Renewable Energy. (2013). Photovoltaic Electrical Contact and Cell Coating Basics. US Department of Energy. Energy.gov. Url: http://energy.gov/eere/energybasics/articles/photovoltaic-electrical-contact-and-cell-coating-basics Phumpradab K., Gheewala K., and M Sagisaka (2009). Life cycle assessment of natural gas power plants in Thailand. International Journal of Life Cycle Assessment 14(4): pp. 354-363. June 2009. P. Lavery, et. al. Life cycle assessment of a sponge nickel produced by gas atomization for use of in industrial hydrogenation catalysis applications. The Inernational Journal of Life Cycle Assessment. Spring 2012 Stoppato A. (2008) Life cycle assessment of photovoltaic electricity generation. J Energy 33:224-232 Thailand Board of Investors. (2014). Thailand Alternative Energy Industry.The Board Investment of Thailand. Url: http://www.boi.go.th/index.php?page=brochure Thai Solar Energy Company. (2015). Url. http://www.thaisolarenergy.com/index.php Zipp, K. (2011). Solar Inverter step-up transformers need a new design approach. Solar Power World. Url: www.solarpowerworldonline.com/2011/07/solar-inverter-step-up-transformers-need-a-new-design- approach/