Positive and negative hypothesis testing strategies were compared for cooperative groups performing a rule induction task. In the task, groups proposed hypotheses for a hidden rule based on playing cards and received feedback on whether their card selections matched or mismatched the rule. Two experiments varied whether groups were instructed to use positive tests (selecting cards expected to match) or negative tests (selecting nonmatches) on each trial. Positive tests led to more examples being revealed, allowing groups to learn the rule faster. The proportion of groups correctly solving the rule corresponded to the proportion using a positive testing strategy. Positive hypothesis testing may be more effective for inducing rules because it generates additional informative examples.
The analysis of sequential experiments with feedback to subjectsClifford Stone
This document analyzes sequential experiments where subjects make guesses with feedback. It examines three types of feedback: no feedback, complete feedback where subjects see the correct card after each guess, and partial ("yes/no") feedback where subjects only learn if their guess was right or wrong. For complete feedback experiments, it determines the expected number of correct guesses and distribution for optimal and worst-case guessing strategies for decks of varying composition. It also proposes a skill-scoring method to evaluate experiments in a way that does not depend on the subject's strategy.
This document summarizes analysis of variance (ANOVA) methods, including:
1) The basic steps and logic of ANOVA, and how it is used to test for differences between two or more groups.
2) Applying a one-way ANOVA to data from a completely randomized design with at least three groups to test if their means are significantly different.
3) Performing multiple comparisons, like the LSD t-test and SNK q-test, to examine differences between specific group means.
3) Using a two-way ANOVA for a randomized complete-block design to reduce variation between experimental units and test if treatment means differ.
This document summarizes key aspects of analysis of variance (ANOVA), including the basic logic and steps of hypothesis testing, different types of ANOVA for different experimental designs, and methods for multiple comparisons. It discusses one-way ANOVA for completely randomized designs and randomized complete-block designs, assumptions of ANOVA, and post-hoc tests like least significant difference and Student-Newman-Keuls tests for comparing group means. Examples are provided to illustrate random assignment of subjects to groups and testing for differences in group means.
This document describes an experiment that tests for the existence of purely procedural preferences in economic decision making. It introduces three allocation procedures - a dictator game, yes-no game, and ultimatum game - that yield the same expected outcomes but differ in their procedural properties. Dominant economic theories predict no preference between the procedures. The experiment found that some participants exhibited preferences over the procedures, suggesting people may care about the process independently of outcomes. It aims to understand the psychological reasons for purely procedural preferences by relating them to aspects of moral judgment.
This document provides an introduction to experimental design and sampling methods used to produce data for statistical analysis. It discusses the differences between observational studies and experimental studies, as well as key concepts in experimental design including randomization, control groups, placebos, and blocking/stratification. Specific experimental designs covered include completely randomized designs, blocked/stratified designs, and matched pairs designs. Examples are provided to illustrate how different experimental designs can be applied.
Statistical tests provide a mechanism for making quantitative decisions about processes by determining if there is enough evidence to reject conjectures. Common statistical tests include correlational tests, comparison of means tests, regression tests, and non-parametric tests. Two-sample tests compare two independent samples, while paired tests compare two related samples by looking at differences between pairs. One-tailed and two-tailed tests determine rejection regions. ANOVA tests examine differences between group means. One-way ANOVA compares two independent groups, while two-way ANOVA compares groups with two independent variables and their interactions.
Contingent Weighting in Judgment and ChoiceSamuel Sattath
- Choice and matching procedures often yield inconsistent preferences due to differences in how options are evaluated in each method. Choice relies more on qualitative heuristics like selecting the option superior on the more important dimension (lexicographic processing), while matching requires quantitative trade-offs between attributes.
- As a result, the more prominent or important attribute of an option tends to "loom larger" and have more influence in choice than in matching. In other words, choice evaluations are more driven by the primary attribute than are matching evaluations.
- This discrepancy between choice and matching raises conceptual and practical questions about how to define and assess preferences, given their context-dependent nature.
STAT 778 Project Proposal - Jonathan PoonJonathan Poon
1. The document proposes a theoretical formula scoring criterion (FSC) to simulate the effects of formula scoring on multiple-choice tests.
2. Through simulations in R, the FSC was shown to improve some examinees' observed scores so that they more closely approximated their true scores, though reliability was slightly reduced.
3. Further analysis over the next few months will evaluate the validity and usefulness of the FSC method for more accurately estimating examinees' true abilities when formula scoring is implemented.
The document describes how to conduct an independent t-test to compare the means of two unrelated groups. It explains that the t-test assesses whether the means of two samples are statistically different from each other. It provides steps for running a t-test, including determining hypotheses, collecting data, calculating statistics like means and standard deviations, using a formula to calculate the t-value, and comparing the t-value to critical values to determine statistical significance. An example compares cognitive test scores of participants who slept for 4 hours versus 8 hours. The t-test found no significant difference between the groups.
In this document, I have tried to illustrate most of the hypothesis testing like 1 sample,2 samples, etc, which I have covered to analyze the machine learning algorithms. I have focused on Independent statistical testing.
Now the question is why we use statistical testing? the answer is that we use statistical testing for significance analysis of our results, which I am going to deliver
Women exhibited more cooperative behavior than men in the first round of a prisoner's dilemma experiment, cooperating 62% of the time compared to men's 41%. However, as the experiment continued over multiple rounds, cooperation rates decreased for both sexes and the gender difference diminished. In mixed-gender sessions, women cooperated more (65%) than in same-gender female sessions (50%), while men cooperated less (27%) compared to same-gender male sessions (38%). The authors concluded that while initial gender differences exist, decisions become more similar over time as experiences converge.
PSY325 Week 2 Scenario and Data Set 4 Source Adapted fr.docxwoodruffeloisa
PSY325 Week 2 Scenario and Data Set 4
Source: Adapted from Tanner (2016, p. 320)
A car salesperson attempts to determine whether age and the type of car purchased are
related. Observed data for 100 car buyers are shown below.
Sports Economy Sedan Total
20s 6 16 10 32
30s 12 14 12 38
40s 6 10 14 30
Total 24 40 36 100
Calculate the chi-square, determine statistical significance, and answer the questions in the
assignment instructions.
Method Note
The Chi-Square Test:
Often Used and More Often
Misinterpreted
Todd Michael Franke
1
, Timothy Ho
2
, and
Christina A. Christie
3
Abstract
The examination of cross-classified category data is common in evaluation and research, with Karl
Pearson’s family of chi-square tests representing one of the most utilized statistical analyses for
answering questions about the association or difference between categorical variables. Unfortu-
nately, these tests are also among the more commonly misinterpreted statistical tests in the field.
The problem is not that researchers and evaluators misapply the results of chi-square tests, but
rather they tend to over interpret or incorrectly interpret the results, leading to statements that
may have limited or no statistical support based on the analyses preformed.
This paper attempts to clarify any confusion about the uses and interpretations of the family of
chi-square tests developed by Pearson, focusing primarily on the chi-square tests of independence
and homogeneity of variance (identity of distributions). A brief survey of the recent evaluation lit-
erature is presented to illustrate the prevalence of the chi-square test and to offer examples of how
these tests are misinterpreted. While the omnibus form of all three tests in the Karl Pearson family
of chi-square tests—independence, homogeneity, and goodness-of-fit,—use essentially the same
formula, each of these three tests is, in fact, distinct with specific hypotheses, sampling approaches,
interpretations, and options following rejection of the null hypothesis. Finally, a little known option,
the use and interpretation of post hoc comparisons based on Goodman’s procedure (Goodman,
1963) following the rejection of the chi-square test of homogeneity, is described in detail.
Keywords
chi-square test, quantitative methods, methods use, using chi-square test
1 Department of Social Welfare, Meyer and Rene Luskin School of Public Affairs, University of California, Los Angeles, CA,
USA
2
Department of Education, Graduate School of Education and Information Sciences, University of California, Los Angeles,
CA, USA
3
Department of Education, Social Research Methods Division, Graduate School of Education and Information Sciences,
University of California, Los Angeles, CA, USA
Corresponding Author:
Todd Michael Franke, Department of Social Welfare, Meyer and Rene Luskin School of Public Affairs, University of California,
Box 951656, Los Angeles, CA, 90095, USA
Email: [email pro ...
Michael Festing - The Principles of Experimental DesignMedicReS
This document discusses key principles of experimental design, including:
1. Experiments should aim to answer a clear question.
2. Randomisation and blinding are important to reduce bias. The experimental unit must also be correctly identified.
3. Power calculations are used to determine adequate sample sizes based on expected variability, effect size, and desired power. More homogeneous subjects require smaller sample sizes.
4. While randomisation increases precision, heterogeneity may allow broader generalisation of results if significant effects are found. Appropriate experimental designs like blocking can balance these considerations.
This document contain all topics of research methodology of module-3 according to the syllabus of BPUT odisha. The document is done for the PG and PHD students who are doing research.
Experimental Design 1 Running Head EXPERIMENTAL DES.docxadkinspaige22
This document discusses experimental design and threats to validity. It begins by defining an experiment as having an independent variable that causes changes in a dependent variable. True experiments require random assignment to groups, an intervention for one group, and a comparison of pre- and post-intervention measurements. The document then describes three classic experimental designs: pretest-posttest control group design, posttest-only control group design, and Solomon four-group design. It concludes by discussing threats to internal validity, such as selection bias, history effects, and ambiguous temporal precedence, which could influence the ability to make causal claims about the independent variable.
Page 266LEARNING OBJECTIVES· Explain how researchers use inf.docxkarlhennesey
Page 266
LEARNING OBJECTIVES
· Explain how researchers use inferential statistics to evaluate sample data.
· Distinguish between the null hypothesis and the research hypothesis.
· Discuss probability in statistical inference, including the meaning of statistical significance.
· Describe the t test and explain the difference between one-tailed and two-tailed tests.
· Describe the F test, including systematic variance and error variance.
· Describe what a confidence interval tells you about your data.
· Distinguish between Type I and Type II errors.
· Discuss the factors that influence the probability of a Type II error.
· Discuss the reasons a researcher may obtain nonsignificant results.
· Define power of a statistical test.
· Describe the criteria for selecting an appropriate statistical test.
Page 267IN THE PREVIOUS CHAPTER, WE EXAMINED WAYS OF DESCRIBING THE RESULTS OF A STUDY USING DESCRIPTIVE STATISTICS AND A VARIETY OF GRAPHING TECHNIQUES. In addition to descriptive statistics, researchers use inferential statistics to draw more general conclusions about their data. In short, inferential statistics allow researchers to (a) assess just how confident they are that their results reflect what is true in the larger population and (b) assess the likelihood that their findings would still occur if their study was repeated over and over. In this chapter, we examine methods for doing so.
SAMPLES AND POPULATIONS
Inferential statistics are necessary because the results of a given study are based only on data obtained from a single sample of research participants. Researchers rarely, if ever, study entire populations; their findings are based on sample data. In addition to describing the sample data, we want to make statements about populations. Would the results hold up if the experiment were conducted repeatedly, each time with a new sample?
In the hypothetical experiment described in Chapter 12 (see Table 12.1), mean aggression scores were obtained in model and no-model conditions. These means are different: Children who observe an aggressive model subsequently behave more aggressively than children who do not see the model. Inferential statistics are used to determine whether the results match what would happen if we were to conduct the experiment again and again with multiple samples. In essence, we are asking whether we can infer that the difference in the sample means shown in Table 12.1 reflects a true difference in the population means.
Recall our discussion of this issue in Chapter 7 on the topic of survey data. A sample of people in your state might tell you that 57% prefer the Democratic candidate for an office and that 43% favor the Republican candidate. The report then says that these results are accurate to within 3 percentage points, with a 95% confidence level. This means that the researchers are very (95%) confident that, if they were able to study the entire population rather than a sample, the actual percentage who preferred th ...
The document discusses the sign test, a nonparametric hypothesis test that does not require assumptions about the population distribution. The sign test can be used to test claims involving matched pairs, nominal data with two categories, or the population median. The document provides guidelines for performing the sign test in each of these cases, including stating hypotheses, determining sample sizes and test statistics, and making conclusions. Examples are also given to illustrate the sign test for matched pairs, nominal data, and testing the population median.
Hypothesis testing involves stating a null hypothesis (H0) and an alternative hypothesis (H1). H0 assumes there is no effect or relationship in the population. H1 states there is an effect. A study is conducted and statistics are used to determine if the data supports rejecting H0 in favor of H1. The p-value indicates the probability of obtaining results as extreme as the observed data or more extreme if H0 is true. If p ≤ the predetermined significance level (α = 0.05), H0 is rejected in favor of H1. Otherwise, H0 is retained but not proven true. Type I and II errors can occur when the true hypothesis is incorrectly rejected or retained.
The document provides information about goodness-of-fit tests and contingency tables. It defines a goodness-of-fit test as testing whether an observed frequency distribution fits a claimed distribution. It also provides the notation, requirements, and steps to conduct a goodness-of-fit test including: defining the null and alternative hypotheses, calculating the test statistic as a chi-square value, finding the critical value, and making a decision to reject or fail to reject the null hypothesis. Several examples demonstrate how to perform goodness-of-fit tests to determine if sample data fits a claimed distribution.
Tests of significance are statistical methods used to assess evidence for or against claims based on sample data about a population. Every test of significance involves a null hypothesis (H0) and an alternative hypothesis (Ha). H0 represents the theory being tested, while Ha represents what would be concluded if H0 is rejected. A test statistic is computed and compared to a critical value to either reject or fail to reject H0. Type I and Type II errors can occur. Steps in hypothesis testing include stating hypotheses, selecting a significance level and test, determining decision rules, computing statistics, and interpreting the decision. Hypothesis tests are used to answer questions about differences in groups or claims about populations.
This document summarizes a dissertation that investigates whether equal but inefficient outcomes remain salient choices for subjects in coordination games when they are placed under time pressure. It conducted an experiment extending previous research by introducing time pressure. The dissertation reviews literature on equality and efficiency in coordination games. It finds that subjects tend to become more risk-taking under time pressure in individual decision games. The experiment was conducted with employees to avoid issues of students participating only for monetary incentives.
A chi-squared test (χ2) is basically a data analysis on the basis of observations of a random set of variables. Usually, it is a comparison of two statistical data sets. This test was introduced by Karl Pearson in 1900 for categorical data analysis and distribution. So, it was mentioned as Pearson’s chi-squared test.
This study examined the "crowd within" effect by asking 76 participants to make two guesses at ranking sets of knowledge items. The guesses were averaged using Borda count. Results showed the average was more accurate than individual guesses, supporting the crowd within effect. Higher ability subjects performed better. While easy problems elicited better responses than hard ones, there was no interaction between difficulty and guesses. Overall, the findings provide evidence that averaging multiple opinions or guesses from the same individual improves accuracy, analogous to the wisdom of crowds.
The document discusses the chi-square test, which is a non-parametric statistical test used to compare observed data with expected data in one or more categories. It does not assume an underlying distribution and can be applied to contingency tables with multiple classes. The chi-square test statistic follows a chi-square distribution, and the test determines if there is a significant difference between observed and expected frequencies.
The document provides examples of hypothesis testing using z-tests, t-tests, F-tests (ANOVA), and describes how to conduct each test. It includes examples testing hypotheses about means of different groups for variables like exam scores, car crash tests, and sales data. The final example tests whether the monthly sales means are equal to determine which salesman is most likely to be promoted.
The document discusses key statistical concepts including variance, standard deviation, the normal distribution, frequency distributions, data matrices, properties of good graphs, populations and parameters, hypothesis testing, and point and interval estimation. It provides definitions and examples of these terms and how they relate to drawing statistical inferences from data.
The document provides an overview of key statistical concepts including variance, standard deviation, the normal distribution, frequency distributions, data matrices, properties of good graphs, populations and samples, parameters and statistics, hypothesis testing, and point and interval estimation. It defines these terms and explains concepts like the null hypothesis, alternative hypothesis, critical regions, test statistics, and making decisions based on probability thresholds.
This document presents a comparative study of the efficiency and stability of Islamic and conventional banks in GCC countries from 2005-2014. It finds that:
1) Conventional banks are more efficient at managing costs, while Islamic banks are more solid in terms of short-term solvency, though there is no difference in long-term stability.
2) Regression analysis shows the operations of Islamic banks are different from conventional banks, even after controlling for bank-specific variables.
3) Larger banks have less intermediation ratios, indicating diseconomies of scale, and highly capitalized banks are more stable but less cost-efficient.
- The document compares bank lending by Islamic and conventional banks during the COVID-19 pandemic using data from 421 banks in 17 countries.
- It finds that while lending growth decreased for both during the initial crisis phase, the decrease was only significant for conventional banks. Islamic bank lending grew about 2.5% faster than conventional banks, especially in countries with macroprudential policies pre-crisis.
- The results suggest Islamic banks sustained lending more during the early COVID-19 crisis compared to conventional banks, and this difference was greater in countries that had implemented macroprudential policies before the pandemic.
This document compares the projected residential demand for very high bandwidth broadband internet in 2025 for Germany, the UK, and the Flemish region of Belgium. It uses a generic market potential model developed by WIK Consulting that predicts future broadband demand based on the bandwidth needs of applications, user profiles in the population, and household structure. The model is applied to each region and finds differences in projected demand, pointing to the relevance of socio-demographic factors and the need for further digital education. The forecast assumes broadband connectivity will not be a bottleneck to meeting demand.
This paper examines the efficiency dynamics and convergence of Islamic and conventional banks across 23 countries from 1999 to 2014. Using parametric and non-parametric methods, the authors find that on average, Islamic and conventional banks have similar steady state efficiency levels and rates of efficiency convergence. However, classification tree analysis reveals that steady state efficiencies and convergence rates can vary between bank types in some countries. The alignment of Islamic and conventional banking systems is positively related to factors like financial depth, transparency, and economic stability. The paper provides novel insights into differences and similarities between Islamic and conventional banking models across countries.
This document summarizes a research article that examines the relationship between the development of sukuk (Islamic bond) markets and the financial stability of Islamic banks. It hypothesizes that this relationship can be one of either complementarity or competition. The study finds that sukuk market development positively impacts the financial stability of Islamic banks by expanding complementarity between them and encouraging stability. This adds to limited existing research on the interaction between growing Islamic financial sectors.
This document summarizes a study that examined the role of trust in reducing margins charged for murabaha financing at Islamic banks in Indonesia. The study surveyed Islamic bank managers about their perceptions of small business managers' benevolence and integrity. The study found that higher levels of perceived trust, as measured by benevolence and integrity, were negatively associated with the margins charged to small businesses. This relationship remained even after accounting for potential endogeneity. The study contributes to understanding the role of trust at Islamic banks and in emerging market contexts with collectivist cultures.
tinjauan historis kerangka konseptual (alwan sri kustono).pdfAgus arwani
Tinjauan sejarah penyusunan rerangka konseptual menjelaskan perkembangan konsep-konsep dasar akuntansi sejak awal 1930-an hingga pengembangan konsep-konsep oleh Paton dan Littleton pada 1940. Beberapa konsep awal diusulkan oleh Hatfield, Canning, Mason, dan Sweeney, sementara Paton dan Littleton memperkenalkan 5 konsep dasar yaitu kesatuan usaha, kontinuitas usaha, kos sebagai bahan olah, kos berdaya ik
Artikel ini membahas pengaruh pemahaman akuntansi, pemanfaatan sistem informasi akuntansi keuangan daerah, dan peran internal audit terhadap kualitas laporan keuangan pemerintah daerah kota Banda Aceh. Penelitian ini menunjukkan bahwa ketiga faktor tersebut berpengaruh positif terhadap kualitas laporan keuangan, meskipun pengaruhnya masih lemah. Pemahaman akuntansi memberikan pengaruh terbesar terhadap kualitas laporan keuangan.
Tulisan ini membahas perekayasaan kerangka konseptual akuntansi dalam pandangan Islam. Kerangka konseptual akuntansi konvensional dibangun berdasarkan prinsip individualisme sedangkan dalam Islam tujuan ekonomi harus mencapai maqashid syariah untuk kesejahteraan sosial. Perlu pendekatan sinergis antara akuntansi filosofis dan praktis agar akuntansi syariah lebih bermanfaat bagi masyarakat.
Dokumen tersebut membahas tentang fungsi manajemen dalam penyajian laporan keuangan dan bagaimana laporan keuangan berfungsi sebagai alat pertanggungjawaban manajemen kepada pihak-pihak yang berkepentingan seperti pemilik perusahaan, investor, kreditur dan pemerintah. Dokumen ini juga menjelaskan bagaimana laporan keuangan dapat disalahgunakan oleh manajemen untuk kepentingan pribadi melalui praktik merekayasa
Artikel ini menganalisis pemahaman akuntansi penyusun laporan keuangan Badan Keswadayaan Masyarakat (BKM) di Kabupaten Malang dan Kabupaten Kota Baru, Kalimantan Selatan. Hasil penelitian menunjukkan bahwa sebagian besar penyusun laporan keuangan BKM di Kabupaten Malang memahami akuntansi dengan baik, namun beberapa penyusun laporan keuangan BKM di Kabupaten Kota Baru masih kurang memahami konsep-kon
1) The study investigates whether inheriting a diagnostic hypothesis from a supervisor interferes with auditors' ability to generate additional hypotheses from the same transaction cycle.
2) The experimental results found that auditors who inherited a supervisor's suggestion generated fewer additional hypotheses from the same transaction cycle compared to auditors who did not inherit a suggestion.
3) The interference effect occurred immediately, as the first hypothesis generated by auditors who inherited a suggestion tended to come from a different transaction cycle than the supervisor's suggestion.
Auditors participated in experiments examining how they revise beliefs in response to positive and negative evidence. The experiments tested how presentation mode (sequential vs simultaneous) and direction of evidence (positive vs negative) affected belief revisions.
The results found that auditors were more responsive to negative evidence than positive evidence. They also revised beliefs more when evidence was presented sequentially rather than simultaneously. This suggested auditors were evidence-sensitive.
However, more research was needed to determine if these effects were due to features of the auditing tasks or features of the auditors themselves. The current study aimed to address this by testing auditors and non-auditors on both auditing and non-auditing tasks to see if the effects held across
Dokumen tersebut membahas konsep biaya dan sistem informasi akuntansi biaya. Secara ringkas, dokumen menjelaskan bahwa (1) biaya merupakan pengorbanan sumber daya ekonomi yang diukur dalam satuan uang, (2) terdapat perbedaan antara biaya dan beban, dan (3) sistem informasi akuntansi biaya bermanfaat untuk perencanaan, pengawasan, penetapan harga, dan pengambilan keputusan.
How Does CRISIL Evaluate Lenders in India for Credit RatingsShaheen Kumar
CRISIL evaluates lenders in India by analyzing financial performance, loan portfolio quality, risk management practices, capital adequacy, market position, and adherence to regulatory requirements. This comprehensive assessment ensures a thorough evaluation of creditworthiness and financial strength. Each criterion is meticulously examined to provide credible and reliable ratings.
"Does Foreign Direct Investment Negatively Affect Preservation of Culture in the Global South? Case Studies in Thailand and Cambodia."
Do elements of globalization, such as Foreign Direct Investment (FDI), negatively affect the ability of countries in the Global South to preserve their culture? This research aims to answer this question by employing a cross-sectional comparative case study analysis utilizing methods of difference. Thailand and Cambodia are compared as they are in the same region and have a similar culture. The metric of difference between Thailand and Cambodia is their ability to preserve their culture. This ability is operationalized by their respective attitudes towards FDI; Thailand imposes stringent regulations and limitations on FDI while Cambodia does not hesitate to accept most FDI and imposes fewer limitations. The evidence from this study suggests that FDI from globally influential countries with high gross domestic products (GDPs) (e.g. China, U.S.) challenges the ability of countries with lower GDPs (e.g. Cambodia) to protect their culture. Furthermore, the ability, or lack thereof, of the receiving countries to protect their culture is amplified by the existence and implementation of restrictive FDI policies imposed by their governments.
My study abroad in Bali, Indonesia, inspired this research topic as I noticed how globalization is changing the culture of its people. I learned their language and way of life which helped me understand the beauty and importance of cultural preservation. I believe we could all benefit from learning new perspectives as they could help us ideate solutions to contemporary issues and empathize with others.
Economic Risk Factor Update: June 2024 [SlideShare]Commonwealth
May’s reports showed signs of continued economic growth, said Sam Millette, director, fixed income, in his latest Economic Risk Factor Update.
For more market updates, subscribe to The Independent Market Observer at https://blog.commonwealth.com/independent-market-observer.
5 Tips for Creating Standard Financial ReportsEasyReports
Well-crafted financial reports serve as vital tools for decision-making and transparency within an organization. By following the undermentioned tips, you can create standardized financial reports that effectively communicate your company's financial health and performance to stakeholders.
1. Elemental Economics - Introduction to mining.pdfNeal Brewster
After this first you should: Understand the nature of mining; have an awareness of the industry’s boundaries, corporate structure and size; appreciation the complex motivations and objectives of the industries’ various participants; know how mineral reserves are defined and estimated, and how they evolve over time.
Falcon stands out as a top-tier P2P Invoice Discounting platform in India, bridging esteemed blue-chip companies and eager investors. Our goal is to transform the investment landscape in India by establishing a comprehensive destination for borrowers and investors with diverse profiles and needs, all while minimizing risk. What sets Falcon apart is the elimination of intermediaries such as commercial banks and depository institutions, allowing investors to enjoy higher yields.
Solution Manual For Financial Accounting, 8th Canadian Edition 2024, by Libby...Donc Test
Solution Manual For Financial Accounting, 8th Canadian Edition 2024, by Libby, Hodge, Verified Chapters 1 - 13, Complete Newest Version Solution Manual For Financial Accounting, 8th Canadian Edition by Libby, Hodge, Verified Chapters 1 - 13, Complete Newest Version Solution Manual For Financial Accounting 8th Canadian Edition Pdf Chapters Download Stuvia Solution Manual For Financial Accounting 8th Canadian Edition Ebook Download Stuvia Solution Manual For Financial Accounting 8th Canadian Edition Pdf Solution Manual For Financial Accounting 8th Canadian Edition Pdf Download Stuvia Financial Accounting 8th Canadian Edition Pdf Chapters Download Stuvia Financial Accounting 8th Canadian Edition Ebook Download Stuvia Financial Accounting 8th Canadian Edition Pdf Financial Accounting 8th Canadian Edition Pdf Download Stuvia
STREETONOMICS: Exploring the Uncharted Territories of Informal Markets throug...sameer shah
Delve into the world of STREETONOMICS, where a team of 7 enthusiasts embarks on a journey to understand unorganized markets. By engaging with a coffee street vendor and crafting questionnaires, this project uncovers valuable insights into consumer behavior and market dynamics in informal settings."
Lecture slide titled Fraud Risk Mitigation, Webinar Lecture Delivered at the Society for West African Internal Audit Practitioners (SWAIAP) on Wednesday, November 8, 2023.
Seminar: Gender Board Diversity through Ownership NetworksGRAPE
Seminar on gender diversity spillovers through ownership networks at FAME|GRAPE. Presenting novel research. Studies in economics and management using econometrics methods.
Seminar: Gender Board Diversity through Ownership Networks
laughlin1997.pdf
1. ORGANIZATIONAL BEHAVIOR AND HUMAN DECISION PROCESSES
Vol. 69, No. 3, March, pp. 265–275, 1997
ARTICLE NO. OB972687
Positive and Negative Hypothesis Testing by Cooperative Groups
PATRICK R. LAUGHLIN, VICKI J. MAGLEY, AND ELLEN I. SHUPE
University of Illinois at Urbana-Champaign
strategy or heuristic, “a tendency to test cases that are
In a rule induction problem positive hypothesis tests expected (or known) to have the property of interest
select evidence that the tester expects to be an example
rather than those expected (or known) to lack that prop-
of the correct rule if the hypothesis is correct, whereas
erty” (1987, p. 211). They summarize evidence showing
negative hypothesis tests select evidence that the test-
that this positive test strategy is an effective heuristic
er expects to be a nonexample if the hypothesis is cor-
in a wide range of hypothesis testing situations, includ-
rect. Previous research indicates the general effective-
ing rule learning, concept identification, judging a rule
ness of a positive test strategy for individuals, but there
has been very little research with cooperative groups. of the form “if p, then q,” learning from outcome feed-
We extend the analysis of Klayman and Ha (Psychologi- back, and judgments of contingency. Distinguishing
cal Review, 1987) of ambiguous verification or conclu- this effective positive test strategy from a deleterious
sive falsification of five possible types of hypotheses “confirmation bias” that fails to falsify in the strict (e.g.,
by positive and negative tests by emphasizing the im-
Popper, 1959) or modified (e.g. Lakatos, 1970; Meehl,
portance of further examples following hypothesis
1990) prescriptive sense proposed by philosophers of
tests. In two experiments four-person cooperative
science, they conclude: “The appropriateness of human
groups solved rule induction problems by proposing a
hypothesis-testing strategies and prescriptions about
hypothesis and selecting evidence to test the hypothe-
optimal strategies must be understood in terms of the
sis on each of four arrays on each trial. In different
conditions the groups were instructed to use different interaction between the strategy and the task at hand”
combinations of positive and negative tests on the four (p. 211).
arrays. Positive tests were more likely to lead to fur- Although hypothesis testing by cooperative groups is
ther examples than negative tests, and the proportion
an important basic issue in social and organizational
of correct hypotheses corresponded to the proportion
psychology, there has been very research on the effec-
of positive tests, in both experiments. We suggest that
tiveness of positive and negative hypothesis tests by
positive tests are more effective than negative hypoth-
cooperative groups. Indeed, to our knowledge only two
esis tests in generating further evidence, and thus in
previous experiments have explicitly assessed the effec-
inducing the correct rule, in experimental rule induc-
tion tasks with a criterion of certainty imposed by the tiveness of positive and negative hypothesis tests for
researcher. q 1997 Academic Press cooperative groups, both with a cooperative rule induc-
tion paradigm adapted from the competitive game
“Eleusis” (Abbott, 1977; Gardner, 1977; Romesburg
Hypothesis testing is an important area of psycholog- 1979).
ical theory and research. A basic issue is the effective-
In Eleusis the Dealer chooses a rule based on ordinary
ness of positive hypothesis tests and negative hypothe-
playing cards, places an example of the correct rule face
sis tests. In a positive test the person examines or
up on the table, shuffles two decks (104 cards) together,
generates evidence that is expected to have the property
and deals each Player a hand of 14 cards. Each Player
or event of interest, whereas in a negative test the
in turn plays cards which the Dealer classifies as an
person examines or generates evidence that is not ex-
example or nonexample of the correct rule, placing ex-
pected to have the property or event of interest.
amples face up to the right of the initial example in
Klayman and Ha (1987, 1989) and Klayman (1995)
the order of play and nonexamples below the last card
propose that many obtained results in research on hy-
played. The objective is to get rid of all of one’s cards,
pothesis testing may be understood by a positive test
either by playing examples or correctly showing the
Dealer that one has no examples to play when only five
Address correspondence and reprint requests to Patrick R. Lau-
cards remain in one’s hand. The Player receives two
ghlin, Department of Psychology, University of Illinois, 603 E. Daniel
Street, Champaign, IL 61820. E-mail: plaughli@s.psych.uiuc.edu. further cards for every nonexample played. A scoring
265 0749-5978/97 $25.00
Copyright q 1997 by Academic Press
All rights of reproduction in any form reserved.
2. 266 LAUGHLIN, MAGLEY, AND SHUPE
system based on the array of card plays and the re- of the correct rule, the experimenter places it below
the known example. Each group member then makes
maining cards in their hands allocates points to Dealer
and Players. a second hypothesis, the group makes a hypothesis, and
the group plays a second card. Again, example cards are
Both Gorman, Gorman, Latta, and Cunningham
(1984) and Laughlin and Futoran (1985) converted this placed to the right of the last example and nonexample
cards below the last card in the order of play. This
competitive game to cooperative group rule induction
with the basic procedure of playing cards which are procedure continues for 10 trials of hypotheses and card
selections, after which the group proposes a final hy-
placed as examples and nonexamples in a progressive
array of evidence chosen by the group. Gorman et al. pothesis. The experimenter does not indicate whether
the member or group hypotheses are correct or incorrect
(1984) found better performance for groups who were
instructed to use negative hypothesis tests, whereas until after the final hypothesis. Table 1 gives an illus-
tration for the correct rule “two diamonds alternate
Laughlin and Futoran (1985) found that control groups
who used positive and negative tests as they desired with two clubs” with the known initial example of the
eight of diamonds (8D).
performed better than both groups who were instructed
to use positive tests and groups who were instructed As in virtually all research on laboratory rule induc-
tion and rule discovery, there are three simplifying as-
to use negative tests. Several procedural variations
(which we consider in the General Discussion) probably sumptions (Klayman & Ha, 1987). First, the experi-
menter chooses a correct rule and gives error-free
account for these different results. Thus, the small
amount of previous research on positive and negative feedback whether each card selection is an example or
nonexample of the correct rule. Second, only one rule
hypothesis testing by cooperative groups is inconclu-
sive. is correct, although other rules may be plausible or
consistent with the evidence, and there is no feedback
Accordingly, the following two experiments assessed
the effectiveness of positive and negative hypothesis on the degree of incorrectness. Third, the correct rule
requires both sufficiency and necessity. A hypothesis is
testing for cooperative groups in rule induction prob-
lems. We first describe a simple rule induction para- nonplausible if it predicts a card will be in the set de-
fined by the correct rule when it is not (false positive),
digm and then describe an expanded version that allows
a more comprehensive assessment of positive and nega- or predicts a card will not be in the set defined by the
correct rule when it is (false negative).
tive hypothesis tests. We present the theoretical analy-
sis of Klayman and Ha (1987) of the inferences that
EXPERIMENT 1
may be drawn from positive and negative tests of five
types of hypotheses, and then extend their analysis by Expanding our previous illustrative rule induction
considering the importance of examples or nonexam- paradigm, the groups in the present experiment were
ples following positive and negative tests. From this
TABLE 1
analysis we predict the proportion of examples, the pro-
portion of strategic hypotheses, and the effectiveness Illustration of Card Plays and Hypotheses for One Array
of positive and negative test strategies for six conditions
Card plays
in Experiment 1 and five conditions in Experiment 2.
8D 6D 2C 8C 6D 2D
The objective of the rule induction problems is to
9H 2H 4C
induce a correct rule based on a standard deck of 52
8H
playing cards with four suits (clubs, C; diamonds, D; 4D
hearts, H; spades, S) of 13 cards (ace, 1; two, 2; three,
Hypothesis 1: Even diamonds (after known example of
3; . . . , king, 13). The rule may be based on suit (e.g.,
8D)
“diamonds”), number (e.g., “eights”), or any combina- Hypothesis 2: Red (after first card play of 6D)
tion of numerical and logical operations on suit and Hypothesis 3: Diamonds (after second card play of 9H)
number (e.g., “even diamonds below the ten,” “even dia- Hypothesis 4: Diamonds
Hypothesis 5: Diamonds six and above and clubs
monds alternate with odd spades”). The problem begins
Hypothesis 6: Diamonds and clubs
with a single card that is known to be an example of
Hypothesis 7: Even diamonds and even clubs
the rule, placed face up on a table. Hypothesis 8: Two red and two black alternate
On the first trial each group member writes a hypoth- Hypothesis 9: Diamonds six and above and all clubs
esis on a hypothesis sheet. The group then makes a Hypothesis 10: Two even diamonds alternate with two
even clubs
group hypothesis and chooses one of the 52 cards. If
Final hypothesis: Two diamonds alternate with two clubs
the selected card is an example of the correct rule, the
(after last card play of 2D)
experimenter places it on the table to the right of the
Note. Correct rule is “two diamonds alternate with two clubs.”
known example. If the selected card is not an example
3. GROUP HYPOTHESIS TESTING 267
instructed to use positive and/or negative hypothesis Array 1 Array 2
tests on four separate arrays of cards on each of the 8D 8D
ten trials. The problem began with the same known 3C 8H
example on each of the four arrays. There were six Array 3 Array 4
experimental conditions. To illustrate these six condi- 8D 8D 7D
tions, assume the correct rule “two diamonds alternate 8S
with two clubs,” and the given example of the 8D on
each of the four arrays. Assume that the first group In the Control Condition there were no instructions to
hypothesis is “even diamonds.” In the PPPP Condition use positive or negative hypothesis tests, so the groups
the groups were instructed to use a positive test (P) of could use any combination of positive and negative tests
their current hypothesis on each of the four arrays. on the four arrays.
After playing one card on each of the four arrays they Similarly, on each of the second and subsequent trials
were given feedback whether each of the four cards was the groups proposed a hypothesis and then used posi-
an example or nonexample. Hence possible card plays tive or negative hypothesis tests on the four arrays as
and resulting feedback on the first trial would be: instructed in the first five conditions, or as they wished
in the Control Condition.
Array 1 Array 2 Will all positive hypothesis tests (PPPP Condition),
8D 6D 8D 4D all negative hypothesis tests (NNNN Condition), fixed
Array 3 Array 4 proportions of positive and negative tests (PPPN,
8D 2D 8D QD PPNN, and PNNN Conditions) or unconstrained posi-
tive and negative tests (Control Condition) result in
In the PPPN Condition the groups were instructed more effective performance with this expanded rule in-
to use positive tests on Arrays 1, 2, and 3 and a negative duction paradigm? In an excellent theoretical analysis,
test (N) on Array 4. Hence possible card plays and re- Klayman and Ha (1987) discuss the five possible types
sulting feedback would be: of hypotheses and the inferences that may be made
from the results of positive tests and negative tests of
Array 1 Array 2
each type. Although they illustrate their analysis with
8D 6D 8D 4D
the Wason (1960) 2-4-6 Task, it generalizes (with one
Array 3 Array 4
exception) to other rule induction paradigms. To illus-
8D 2D 8D 7D
trate their analysis, assume the hypotheses and card
plays of Table 1 and the correct answer “two diamonds
In the PPNN Condition the groups were instructed
alternate with two clubs.”
to use positive tests on Arrays 1 and 2 and negative
Embedded hypotheses are based on the appropriate
tests on Arrays 3 and 4, such as:
relationships but are too specific, such as Hypothesis
10, “two even diamonds alternate with two even clubs.”
Array 1 Array 2
Overlapping hypotheses are plausible but based on
8D 6D 8D 4D
other relationships, such as Hypothesis 1, “even dia-
Array 3 Array 4
monds.” Surrounding hypotheses are based on the ap-
8D 8D 7D
propriate relationships but are too general, such as Hy-
8S
pothesis 8, “two red and two black alternate.” Disjoint
(nonplausible) hypotheses are inconsistent with the evi-
In the PNNN Condition the groups were instructed
dence, such as Hypothesis 6, “diamonds and clubs.”
to use a positive test on Array 1 and negative tests on
Target (correct) hypotheses are the correct answer cho-
Arrays 2, 3, and 4, such as:
sen by the experimenter, such as the Final Hypothesis,
“two diamonds alternate with two clubs.”
Array 1 Array 2
Klayman and Ha (1987) analyze the inferences of
8D 6D 8D
ambiguous verification or conclusive falsification that
8H
may be drawn from the Type of Test (Positive or Nega-
Array 3 Array 4
tive) and Results (Yes, in the Target Set T, or No, not
8D 8D 7D
in the Target Set T) for the five types of hypotheses in
8S
five 2 3 2 figures. In the current rule induction problem
the result “Yes, in the Target Set” is an example card,
In the NNNN Condition the groups were instructed
to use negative tests on all four arrays, such as: whereas the result “No, not in the Target Set” is a
4. 268 LAUGHLIN, MAGLEY, AND SHUPE
nonexample card. We combine their five figures in the hypothesis. Hence, positive tests of surrounding
hypotheses should be more effective because they may
Table 2.
Embedded hypotheses recognize the correct relation- conclusively falsify hypotheses that are too general.
Disjoint (nonplausible) hypotheses are inconsistent
ships but are too specific. As indicated in Table 2, an
example following a positive test of an embedded hy- with the evidence. Although it is somewhat paradoxical
to consider the inferences that may be drawn from posi-
pothesis ambiguously verifies the hypothesis, whereas
a nonexample is impossible. An example following a tive and negative tests of hypotheses that contradict
the available evidence, a positive test followed by a
negative test of an embedded hypothesis conclusively
falsifies the hypothesis, whereas a nonexample ambigu- nonexample, or a negative test followed by an example,
will conclusively falsify the nonplausible hypothesis. In
ously verifies the hypothesis. Hence negative tests of
embedded hypotheses should be more effective because contrast to the Wason 2-4-6 task, where an example
following a positive test of a nonplausible hypothesis
they may conclusively falsify hypotheses that are too
specific. is impossible, in the current rule induction task an
example may follow a positive test of a nonplausible
Overlapping hypotheses are plausible but based on
other relationships than those of the correct rule. An hypothesis. To illustrate, assume the correct rule “two
diamonds alternate with two clubs” and the known ini-
example following a positive test of an overlapping hy-
pothesis ambiguously verifies the hypothesis, whereas tial example 8D. A positive test of the nonplausible
hypothesis “odd diamonds” on the first trial with the
a nonexample conclusively falsifies it. An example fol-
lowing a negative test conclusively falsifies the hypoth- 7D results in an example of the correct rule. Hence,
positive and negative tests of nonplausible hypotheses
esis, whereas a nonexample ambiguously verifies it.
Hence, positive and negative tests of overlapping should be equally effective.
A positive test of the correct hypothesis will necessar-
hypotheses should be equally effective.
Surrounding hypotheses recognize the correct rela- ily be followed by an example, ambiguously verifying
the hypothesis, and a negative test will necessarily be
tionships but are too general. An example following a
positive test of a surrounding hypothesis ambiguously followed by a nonexample, also ambiguously verifying
the hypothesis. Hence, positive and negative tests
verifies the hypothesis, whereas a nonexample conclu-
sively falsifies it. An example is impossible following a should be equally effective.
Extending these inferences of conclusive falsification
negative test, and the nonexample ambiguously verifies
and ambiguous verification from positive and negative
tests of the five types of hypotheses, we now emphasize
TABLE 2
the importance of the resulting examples or nonexam-
Inferences from Positive and Negative Tests of Five Types ples. Examples provide further evidence for what the
of Hypotheses on the Wason (1960) 2-4-6 Task
correct rule is, whereas nonexamples indicate what the
(Klayman & Ha, 1987)
correct rule is not. This further evidence should make
Result the correct relationships more likely to be perceived
Hypothesis
and tested. Hence we conjecture that further examples
and test Example Nonexample
will be more likely to lead to induction of the correct
Embedded
rule than further nonexamples.
Positive Ambiguous verification Impossible
Positive tests of embedded and correct hypotheses
Negative Conclusive falsification Ambiguous verification
must necessarily result in examples, and negative tests
Overlapping
Positive Ambiguous verification Conclusive falsification of surrounding hypotheses must necessarily result in
Negative Conclusive falsification Ambiguous verification nonexamples. Beyond this, we conjecture that positive
Surrounding
tests of overlapping hypotheses are more likely to result
Positive Ambiguous verification Conclusive falsification
in further examples than negative hypothesis tests in
Negative Impossible Ambiguous verification
the current rule induction problems. The problems be-
Nonplausible
Positive Impossible for 2-4-6 task Conclusive falsification gin from minimal information, a single example of the
Negative Conclusive falsification Ambiguous verification correct rule, such as the 8D of the illustration in Table
Correct
1. The correct rules involve patterns of evidence that
Positive Ambiguous verification Impossible
are not apparent until a number of example cards have
Negative Impossible Ambiguous verification
been played. Since overlapping hypotheses share exam-
Note. In the current rule induction task an example may follow a ples with the correct hypothesis by definition, positive
positive test of a nonplausible hypothesis. To illustrate, assume the
tests should be more likely to result in further examples
correct rule “two diamonds alternate with two clubs” and the known
than negative tests, which should be less likely to share
initial example 8D. A positive test of the nonplausible hypothesis
“odd diamonds” with the 7D results in an example of the correct rule. examples with the correct hypothesis. In particular, on
5. GROUP HYPOTHESIS TESTING 269
the early trials of the rule induction problem virtually CCSS, HHDD, HHCC, HHSS, SSDD, SSCC, and
SSHH. There were two replications of the first eight
all hypotheses should be overlapping hypotheses that
are consistent with the evidence but based on other rules and one replication of the last four rules in each
of the six Conditions. Depending upon the correct rule,
relationships than those of the correct rule. Many of
these overlapping hypotheses should be based on other the initial example card was the 8D, 8C, 8H, or 8S. The
basic instructions were as follows:
relationships, such as “diamonds,” “even diamonds,” or
“diamonds eight and below” for which a positive test This is an experiment in problem solving. The objective is to
will result in a further example. figure out a correct rule based on playing cards. Aces have the
value 1, deuces 2, and so on to tens 10, jacks 11, queens 12, and
Thus, if positive tests are more likely to lead to fur-
kings 13. The rule may be based on any characteristics of the
ther examples than negative tests, and examples are
cards, including suit, number, numerical and logical operations,
more useful than nonexamples in inducing the correct
alternation, and so on. For example, if the rule were “diamonds,”
rule because they provide further evidence, the number all diamonds would fit the rule, and all hearts, clubs, and spades
of correct hypotheses should correspond to the propor- would not fit the rule. I will start you with one card that does
fit the rule. The first step will be for each of you to write your
tion of positive tests on the four arrays.
own hypothesis on your individual hypothesis sheet. Then the
These considerations lead to an interesting question.
four of you will decide on a group hypothesis, which one of you
How may the groups in the NNNN Condition who are will write on the group hypothesis sheet (the group recorder was
constrained to use all negative tests obtain examples? randomly designated by a roll of a die). Then you will play any
Assume that a group believes the correct rule is “two one of the 52 cards you choose on each of the four arrays. After
you choose a card for all four arrays, I will tell you whether or
diamonds alternate with two clubs” after the sequence
not each card also fits the rule. If the card you play also fits the
of examples 8D 2D 2C 8C on one of the four arrays.
rule, I will place it to the right of the first card. If the card does
They wish to obtain a further example of this rule,
not fit the rule, I will place it below the first card. Then you will
which would be a diamond if their hypothesis is correct, each make your second individual hypothesis, make your second
but are constrained by instructions to conduct a nega- group hypothesis, and play a second card on each array. If this
second card fits the rule, I will place it to the right of the last
tive test by playing a nondiamond. They may propose
card that fits the rule and if it does not fit the rule, I will place
the hypothesis “two diamonds alternate with two clubs
it below the last card played. This procedure will continue for
alternate with two hearts” and conduct a negative test 10 trials of individual hypotheses, group hypothesis, and group
of it by playing a diamond, which will be an example card play. After the 10 trials you will make your final individual
if their actual preferred hypothesis “two diamonds al- hypotheses and your final group hypothesis. I will not say
whether or not your first ten hypotheses are correct, but I will
ternate with two clubs” is correct. By analogy to social
tell you whether or not your final hypothesis is correct at the
choice theory (e.g., Sen, 1970), in which an individual
end of the experiment.
or group may vote against their true preference order
to achieve their objective, we call such hypotheses stra- The experimenter then demonstrated this procedure
for four example rules: “diamonds,” “even diamonds,”
tegic hypotheses.
In summary, these considerations lead to three pre- “even diamonds or clubs above the six,” and “odd spades
alternate with even hearts.” Depending upon the condi-
dictions:
tion (PPPP, etc.) the experimenter next explained the
PREDICTION 1. There will be a higher total proportion of examples
procedure of positive or negative tests of the current
following positive hypothesis tests than negative hypothesis
group hypothesis on each of the four arrays.Within the
tests.
PREDICTION 2. There will be more strategic hypotheses for NNNN constraints of positive or negative tests, the card plays
than each of PPPP, PPPN, PPNN, and PNNN, which will not could be the same or different on each trial. The experi-
differ significantly from each other.
menter monitored each card selection to assure that it
PREDICTION 3. The order of total correct hypotheses will be
was a positive test or negative test of the current group
PPPP . PPPN . PPNN . PNNN . NNNN.
hypothesis as appropriate for the condition. There was
no mention of positive and negative tests in the Con-
Method
trol Condition.
Discussion was completely free within the groups.
The subjects were 480 students in introductory psy-
chology courses at the University of Illinois at Urbana- No group decision rule (e.g., unanimity, majority) for
hypotheses or card plays was imposed or implied by
Champaign who participated in partial fulfillment of
course requirements. They were randomly assigned to the instructions. Several decks of cards (sorted by suits
and arranged in ascending order from the ace to the
20 four-person groups in each of the six between-sub-
jects conditions. king) were available, so the same card could be played
as many times as desired on different arrays and trials.
The correct rules were the 12 possible alternations
of doubles of diamonds (D), clubs (C), hearts (H), and The experimenter recorded the trial number of each
hypothesis judged to be strategic. After the problem was
spades (S): DDCC, DDHH, DDSS, CCDD, CCHH,
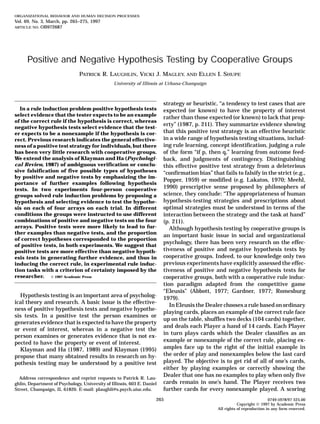
6. 270 LAUGHLIN, MAGLEY, AND SHUPE
completed, the experimenter explained the meaning of hypotheses, and the experimenter and group judgments
agreed on 97% of the hypotheses.
strategic hypotheses and asked the group to indicate
which hypotheses were strategic on their group hypoth- Figure 1 gives the proportions of strategic hypotheses
for blocks of two trials for the five instruction conditions
esis sheet. The experimenter then told the subjects the
correct rule, gave them an oral summary of the purposes (strategic hypotheses do not make sense for the Control
Condition). As is evident in Fig. 1, there were consider-
of the research, answered any questions, and thanked
them for their participation. ably more strategic hypotheses in the NNNN Condition
than the other four conditions. The overall proportions
of strategic hypotheses were .16 for PPPP, .10 for PPPN,
Results and Discussion
.05 for PPNN, .21 for PNNN, and .59 for NNNN. There
Proportion of examples. Table 3 gives the mean pro- was a significant main effect of Condition, F(4, 95 5
portion of examples for each of the four arrays for the six 21.59), p , .001, MSe 5 4.24. Newman–Keuls compari-
experimental conditions. A 6(Conditions) 3 4(Arrays) sons indicated more strategic hypotheses for NNNN
analysis of variance with repeated measures on the than each of the other four conditions (all p , .001),
second factor indicated a significant main effect of Con- which did not differ from each other except for more
ditions, F(5, 114) 5 29.60, p , .001, MSe 5 6.63, strategic hypotheses for PNNN than PPNN, p , .05.
a significant main effect of Arrays, F(3, 342) 5 58.70, This supports Prediction 2.
p , .001, MSe 5 2.06, and a significant Conditions 3 If the NNNN groups proposed strategic hypotheses
Arrays interaction, F(3, 342) 5 22.94, p , .001. in order to obtain further examples we would expect the
All four simple main effects of Conditions for Arrays conditional probability of an example given a strategic
were significant, F(5, 114) 5 10.97, p , .001 for Array hypothesis to be greater than the conditional probabil-
1; F(5, 114) 5 34.45, p , .001 for Array 2; F(5, 114) 5 ity of an example given a nonstrategic hypothesis.
61.39, p , .001 for Array 3: and F(5, 114) 5 59.04, p , These respective conditional probabilities were .57 and
.001 for Array 4. Newman–Keuls comparisons were .24, x2
(1) 5 85.34, p , .001. The use of strategic hypothe-
then conducted within the simple main effects of Condi- ses by these NNNN groups is evidence that they real-
tions for Arrays. Inspection of the patterns of significant ized the value of further examples in inducing the cor-
differences within each Array in Table 3 indicates the rect rule.
predicted greater probabilities of examples for arrays
Five types of hypotheses. Figure 2 gives the propor-
with instructions to use positive tests than for arrays
tions of embedded, overlapping, surrounding, nonplau-
with instructions to use negative tests.
sible, and correct hypotheses for the 11 trials over the
Although positive tests of embedded and correct
six conditions. As evident in Fig. 2, overlapping hypoth-
hypotheses must necessarily result in examples, posi-
eses predominated on the early trials, supporting our
tive tests of overlapping hypotheses may result in exam-
assumption, and there were relatively few embedded
ples or nonexamples. There was a higher proportion of
and surrounding hypotheses. Figure 3 gives the propor-
examples for positive tests of overlapping hypotheses
tions of embedded, overlapping, surrounding, nonplau-
(.48) than negative tests (.30), x2
(1) 5 74.32, p , .001.
sible, and correct hypotheses for each of the six condi-
In summary, these results support Prediction 1 that
tions over the 11 trials.
positive hypothesis tests will be more likely to be fol-
lowed by an example than negative hypothesis tests.
Strategic hypotheses. The group members had no
difficulty understanding the meaning of strategic
TABLE 3
Mean Proportion of Examples: Experiment 1
Condition
Cont PPPP PPPN PPNN PNNN NNNN
Array 1 .65bc .71ab .74a .62c .57c .45
Array 2 .65b .75a .75a .64b .28 .45
Array 3 .68a .74a .75a .17 .29 .46
Array 4 .67a .70a .19bc .13c .26b .43
FIG. 1. Proportions of strategic hypotheses for blocks of two trials:
Note. Within each row means without a common subscript differ
significantly by Newman–Keuls comparisons. Experiment 1.
7. GROUP HYPOTHESIS TESTING 271
predicted order, but the groups who were instructed to
use positive tests on at least two arrays (PPPP, PPPN,
and PPNN) did not differ significantly from each
other.
EXPERIMENT 2
Although the order of correct hypotheses for the
five instruction conditions in Experiment 1 was as
predicted with the reversal of PPPP and PPPN, in-
structions to use positive tests on at least two arrays
resulted in comparable proportions of correct hypothe-
FIG. 2. Proportions of embedded, overlapping, surrounding, non-
plausible, and correct hypotheses for 11 trials: Experiment 1. ses. Similarly, the Control groups who used positive
and negative tests as they preferred performed at the
level of groups instructed to use positive tests on at
Total correct hypotheses. As indicated in Fig. 3, the
least two arrays. One possible reason for this is that
proportion of correct hypotheses was .45 for PPPP, .52
the problems were relatively easy with the large
for PPPN, .41 for PPNN, .35 for PNNN, .16 for NNNN,
amount of information available from four arrays of
and .52 for Control. This corresponded to the predicted
card selections. Although the number of examples,
order of PPPP . PPPN . PPNN . PNNN . NNNN,
and hence the amount of evidence, increased with
with the reversal of PPPP and PPPN.
positive tests, there was sufficient information with
The main effect of Condition for the proportions of
the examples from positive tests on two arrays. Accord-
total correct hypotheses was significant, F(5, 114) 5
ingly, Experiment 2 used more difficult rules, so that
8.72, MSe 5 .042, p , .001. Newman–Keuls compari-
increasing numbers of positive tests, and hence in-
sons indicated a higher proportion of correct hypotheses
creasing numbers of examples, should result in bet-
for each of Control, PPPP, PPPN, PPNN, and PNNN
ter performance.
than NNNN (all p , .001 except PNNN p , .01), indicat-
The correct rules were alternations of triples of two
ing better performance if the groups were instructed or
different suits, such as “three diamonds alternate with
allowed to use positive hypothesis tests on at least one
three clubs.” We expected these rules to be considerably
array. There was a higher proportion of correct hypothe-
more difficult than the alternations of doubles of suits
ses for both Control and PPPN than PNNN (both
(e.g., “two diamonds alternate with two clubs”) of Exper-
p , .01). There was no significant difference between
iment 1, and therefore we expected positive hypothesis
Control, PPPP, PPPN, and PPNN, indicating compara-
tests to be more effective than negative hypothesis
ble performance for groups who were instructed to use
tests.
positive hypothesis tests on at least two arrays and the
As in Experiment 1, there were four arrays and 10
Control Condition. These results generally support the
trials of group member hypotheses, group hypothesis,
and card selections. There were five conditions of in-
structions to use positive tests (P) or negative tests (N)
on the first five trials and the second five trials: (1)
positive tests on the first five and positive tests on the
second five (PP), (2) positive tests on the first five and
negative tests on the second five (PN), (3) negative tests
on the first five and positive tests on the second five
(NP), (4) negative tests on the first five and negative
tests on the second five (NN), and (5) no instructions
to use positive or negative tests (Control). These in-
structions assured that the PP groups would have twice
as many positive tests as the PN and NP groups, and
the NN groups would have no positive tests, thus pro-
viding a relatively greater difference in positive tests
than the PPPP, PPPN, PPNN, PNNN, and NNNN Con-
ditions of Experiment 1.
From the considerations in the Introduction we made
FIG. 3. Proportions of embedded, overlapping, surrounding, non-
plausible, and correct hypotheses for six conditions: Experiment 1. three predictions:
8. 272 LAUGHLIN, MAGLEY, AND SHUPE
PREDICTION 1. There will be a higher proportion of examples F(4, 55) 5 9.20, p , .001. Both of the simple main
following positive hypothesis tests than negative hypothesis effects of Conditions for the First Block of Trials
tests.
and Conditions for the Second Block of Trials were
PREDICTION 2. The order of strategic hypotheses on the first five
significant, F(4, 55) 5 3.12, p , .05; F(4, 55) 5 12.30,
trials will be: (NP and NN) . (PP and PN). The order of strategic
hypotheses on the second five trials will be: (PN and NN) . (PP p , .001, respectively. Newman–Keuls tests within
and NP). the simple main effect of Conditions for the First
PREDICTION 3. The order of total correct hypotheses will be: Block of Trials indicated more examples for each of
PP . (PN 5 NP) . NN.
PP, PN, and Control than each of NN and NP, all
p , .05. The PP, PN, and Control Conditions did not
Method
differ significantly from each other. As predicted, there
The subjects were 240 students in introductory psy- were more examples on the first five trials for the
chology courses at the University of Illinois at Urbana- PP and PN Conditions who were instructed to use
Champaign who participated in partial fulfillment of positive tests than the NP and NN Conditions who
course requirements. There were 12 replications in each were instructed to use negative tests.
of the five experimental conditions. Newman–Keuls comparisons within the simple
The correct rules were the 12 possible alternations main effect of Conditions for the Second Block of
of triples of two different suits, such as “three diamonds Trials indicated fewer examples for PN than each of
alternate with three clubs,” and “three diamonds alter- the other four conditions, all p , .001. There were
nate with three hearts.” Each of the 12 rules was used more examples for PP than NP, p , .05. As predicted,
for one replication of the five conditions. The general there were more examples on the second five trials
instructions and procedures were the same as in Experi- for the PP and NP Conditions that were instructed
ment 1, with appropriate modifications for the different to use positive tests than the PN Condition. Contrary
instructions to use positive or negative hypothesis tests to prediction, there were not more examples on the
on the first five trials and second five trials in the PP, second five trials for the PP and NP Conditions that
PN, NP, and NN Conditions. were instructed to use positive tests than the NN
Condition, which we interpret as the effectiveness of
Results and Discussion using strategic hypotheses to obtain examples in the
NN Condition.
Proportion of examples. Figure 4 gives the mean
proportion of examples for the first five and second
Strategic hypotheses. Figure 5 gives the proportion
five trials for the five conditions. A 5(condition) 3
of strategic hypotheses for the first five and second five
2(blocks of five trials) ANOVA indicated a significant
trials for the four instruction conditions. A 4(condition)
main effect of Conditions, F(4, 55) 5 4.92, p , .002,
3 2(blocks of five trials) ANOVA indicated a significant
MSe 5 12.41. There was a significant effect of trial
main effect of Conditions, F(3, 44) 5 12.17 p , .001,
blocks, F(1, 55) 5 16.40, p , .001, MSe 5 9.82, and
MSe 5 1.8816, a significant effect of Blocks, F(1, 44) 5
a significant Condition 3 Trial Blocks interaction,
FIG. 4. Proportions of examples for first five trials and second FIG. 5. Proportions of strategic hypotheses for first five trials
and second five trials: Experiment 2.
five trials: Experiment 2.
9. GROUP HYPOTHESIS TESTING 273
43.52, p , .001, MSe 5 1.2756, and a significant Condi- negative test of the five types of hypotheses, as exam-
tion 3 Blocks interaction, F(3, 44) 5 7.54, p , .01. A ples provide further evidence to induce the correct rule
planned contrast for the First Block of Trials indicated whereas nonexamples indicate what it is not. We conjec-
more strategic hypotheses for (NP and NN) than (PP tured that positive tests would be more likely to result
and PN), F(1, 44) 5 10.76, p , .001, supporting the in examples than negative tests, and this was supported
first part of Prediction 2. A planned contrast for the in both experiments. Assuming this importance of ex-
Second Block of Trials indicated more strategic hypoth- amples and the greater probability of examples follow-
eses for (PN and NN) than (PP and NP), F(1, 44) 5 ing positive tests, we predicted that groups who were
17.51, p , .001, supporting the second part of Predic- constrained to use all negative tests would use strategic
tion 2. hypotheses. This prediction was supported in both ex-
periments, indicating that these groups realized the
Total correct hypotheses. Figure 6 gives the propor-
importance of examples.
tions of embedded, overlapping, surrounding, nonplau-
Our analysis led to the prediction that the order of
sible, and correct hypotheses for the five conditions. As
total correct hypotheses for the instructions to use posi-
indicated in Fig. 6, the proportions of correct hypotheses
tive hypothesis tests (P) or negative hypothesis tests
were .21 for PP, .11 for PN, .20 for NP, and .08 for
(N) on the four arrays would be PPPP . PPPN . PPNN
NN, supporting the predicted order. The main effect of
. PNNN . NNNN in Experiment 1. The proportion of
Conditions was significant, F(4, 55) 5 3.95, p , .01.
correct hypotheses followed this order, but groups who
As predicted, Newman–Keuls comparisons indicated a
were instructed to use at least two positive tests and the
higher proportion of correct hypotheses for PP than
uninstructed Control Condition performed comparably.
each of PN and NN, and a higher proportion for NP
Since this may have been due to relatively easy rules
than NN, all p , .05, and a nonsignificant difference
and the large amount of information from four arrays,
between PN and NP. Contrary to prediction, there was
we used more difficult rules in Experiment 2. The pre-
not a significant difference between PP and NP. The
dicted order of correct hypotheses of PP . (PN 5 NP) .
Controls had a significantly higher proportion of correct
NN was supported, although there was not a significant
hypotheses than each of PN, p , .05, and NN, p , .01,
difference between PP and NP.
and did not differ from PP and NP.
We interpret both experiments as extending previous
evidence for the effectiveness of a positive test strategy
GENERAL DISCUSSION
or heuristic on the Wason 2-4-6 task, judgments of if-
then relationships and covariance, and concept attain-
Klayman and Ha (1987) analyzed the inferences of
ment (for reviews, see Klayman, 1995; Klayman & Ha,
conclusive falsification and ambiguous verification of
1987, 1989). Unlike the Wason (1960) 2-4-6 task, an
hypotheses that may be drawn from positive and nega-
obvious hypothesis such as “increasing by two” was not
tive tests of embedded, overlapping, surrounding, dis-
embedded within the more general correct hypothesis
joint (nonplausible), and correct hypotheses. Extending
“increasing numbers,” in the given evidence, so that a
their analysis, we emphasized the importance of the
negative test strategy was not necessarily effective a
probability of a further example following a positive or
priori. Moreover, in contrast to the 2-4-6 task, there
were very few embedded hypotheses in either experi-
ment. In contrast to the Wason task where each triple
generated by the problem solver is an independent test,
in the current paradigm each card play is added to a
progressive array of evidence, providing a closer analog
to the development of evidence in domains of hypothesis
testing outside of laboratory experiments.
This progressive development of evidence over suc-
cessive trials of hypothesis testing extends typical re-
search on judgments of if-then relationships and judg-
ments of covariance, where the fixed amount of evidence
is prearranged and presented by the experimenter. In
contrast to research on concept attainment with the
paradigm of Bruner, Goodnow, and Austin (1956), there
was an indeterminate rather than determinate number
FIG. 6. Proportions of embedded, overlapping, surrounding, non-
plausible, and correct hypotheses for five conditions: Experiment 2. of initially possible correct hypotheses, so that a single
10. 274 LAUGHLIN, MAGLEY, AND SHUPE
correct hypothesis could not be established with cer- that the criterion of scientific as opposed to nonscientific
theory is falsifiability, and that scientific experiments
tainty by a series of hypothesis tests that eliminate all
but one possibility. Again, this is a more realistic analog should therefore be designed to attempt to falsify rather
than to support prevailing theory. His analysis was
of hypothesis testing in domains outside of laboratory
rule induction and rule discovery. based on mature sciences such as theoretical physics.
Such sciences have passed through a natural history
In this rule induction paradigm there are two types
of correct rules, contingent and noncontingent. With phase in which scientists reach general agreement on
the phenomena of interest, appropriate terminology,
contingent rules a given card may be an example or a
nonexample depending upon the order of play, and with permissible operations and procedures, and the bound-
ary of the domain. Given this agreement, a large
noncontingent rules a given card is either an example
or a nonexample regardless of the order of play. To amount of accepted evidence exists to be explained by
well-developed competing theories. Experiments may
illustrate, with the contingent rule “two diamonds al-
ternate with two clubs” a diamond following one dia- usefully be designed to falsify these approximately cor-
rect competing theories. In contrast, the rule induction
mond is an example, but a diamond following two dia-
monds is a nonexample. With the noncontingent rule task begins with the minimal evidence of the single
known example of the correct rule, and further evidence
“diamonds and clubs” a diamond is an example regard-
less of the order of play. Both experiments used the is therefore of relatively more importance than in the
evidence-rich mature sciences which have reached the
contingent rules of patterns of alternation of suits be-
cause they are a more realistic analog than noncontin- theory testing stage.
Second, consider the criterion of certainty in labora-
gent rules of inductive domains where generalizations,
rules, and principles become progressively apparent as tory hypothesis testing tasks and well-developed sci-
ences. A correct rule exists in laboratory hypothesis
evidence progressively develops.
The results also extend the two previous studies of testing tasks because it has been chosen by the experi-
menter who gives unambiguous error-free feedback in-
instructions to use positive and negative tests for coop-
erative groups. Consistent with the current results, dicating whether positive and negative hypothesis tests
are followed by further examples or nonexamples. In
Laughlin and Futoran (1985) found that uninstructed
Controls had more correct hypotheses than groups in- contrast, no Omniscient Experimenter chooses correct
hypotheses and provides unambiguous error-free feed-
structed to use all negative tests. In contrast to the
current results, Gorman et al. (1984) found better per- back in scientific research, auditing, or the other situa-
tions in which people test hypotheses in the search for
formance for groups who were instructed to use nega-
tive hypothesis tests. Differences in the experimental generalizations, rules, and principles. Thus, the pre-
scriptive falsification proposed by philosophers of sci-
procedures probably account for these different results.
As in Eleusis, the groups in the Gorman et al. experi- ence applies to a less certain criterion than the certain
criterion imposed by the experimenter in laboratory
ment started with a limited number of cards and were
given two cards for each nonexample they played, hypothesis testing tasks.
whereas the groups in the current and Laughlin and
Futoran experiments had an unlimited number of decks REFERENCES
of cards to play one card per array on each of 10 trials
and were not given further cards for playing nonexam- Abbott, R. (1977). The new Eleusis. New York: Author.
ples. Hence the groups in the Gorman et al. experiment Bruner, J. S., Goodnow, J. J., & Austin, G. A. (1956). A study of
thinking. New York: Wiley.
may have had an additional incentive to seek nonexam-
ples in order to get more cards to play and obtain further Gardner, M. (1977). Mathematical games. Scientific American,
237(4), 18–25.
information. The four experiments are consistent in
Gorman, M. E., Gorman, M. E., Latta, M., & Cunningham, G. (1984).
demonstrating the importance of obtaining further evi-
How disconfirmatory, confirmatory, and combined strategies affect
dence to induce the correct rule.
group problem solving. British Journal of Psychology, 75, 65–79.
How do these results for the descriptive effectiveness
Klayman, J. (1995). Varieties of confirmation bias. In J. R. Busemeyer,
of positive tests and the previously demonstrated effec-
R. Hastie, & D. L. Medin (Eds.), Decision making from the perspec-
tiveness of a positive test strategy in other laboratory tive of cognitive psychology (pp. 385–418). New York: Academic
hypothesis testing tasks (Klayman, 1995; Klayman & Press.
Ha, 1987, 1989) relate to the prescriptive falsification Klayman, J., & Ha, Y-M. (1987). Confirmation, disconfirmation, and
of philosophers of science? First, consider the amount information in hypothesis testing. Psychological Review, 94, 211–
228.
of evidence in well-developed sciences and laboratory
hypothesis testing tasks. Popper (1959, 1972) proposed Klayman, J., & Ha, Y-M. (1989). Hypothesis testing in rule discovery:
11. GROUP HYPOTHESIS TESTING 275
Strategy, structure, and content. Journal of Experimental Psychol- Popper, K. R. (1959). The logic of scientific discovery. New York: Ba-
sic Books.
ogy: Learning, Memory, and Cognition, 15, 596–604.
Lakatos, I. (1970). Falsification and methodology of scientific research Popper, K. R. (1972). Objective knowledge. Oxford, England:
programmes. In I. Lakatos & A. Musgrave (Eds.), Criticism and Clarendon.
the growth of scientific knowledge (pp. 91–196). Amsterdam:
Romesburg, H. C. (1979). Simulating scientific inquiry with the card
North Holland.
game Eleusis. Science Education, 63, 599–608.
Laughlin, P. R., & Futoran, G. C. (1985). Collective induction: Social
Sen, A. K. (1970). Collective choice and individual values. New York:
combination and sequential transition. Journal of Personality and
Holden-Day.
Social Psychology, 48, 608–613.
Meehl, P. E. (1990). Appraising and amending theories: The strategy Wason, P. C. (1960). On the failure to eliminate hypotheses in a
conceptual task. Quarterly Journal of Experimental Psychology,
of Lakatosian defense and two principles that warrant it. Psycho-
logical Inquiry, 1, 108–141. 12, 129–140.
Received: July 22, 1996