
Recommended
More Related Content
Viewers also liked
Viewers also liked (20)
Similar to Nuclear Fusion Star Life Cycles HR Diagram
Similar to Nuclear Fusion Star Life Cycles HR Diagram (20)
More from West Hollow MS Ms. Gill
More from West Hollow MS Ms. Gill (20)
Nuclear Fusion Star Life Cycles HR Diagram
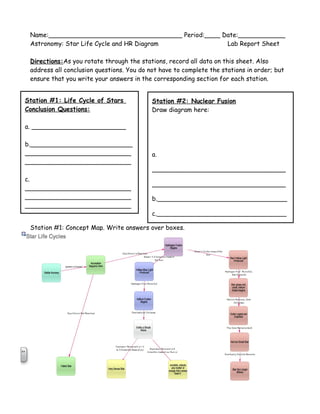
- 1. Station #2: Nuclear Fusion Draw diagram here: a. __________________________________ __________________________________ b._________________________________ c._________________________________ Name:__________________________________ Period:____ Date:____________ Astronomy: Star Life Cycle and HR Diagram Lab Report Sheet Directions:As you rotate through the stations, record all data on this sheet. Also address all conclusion questions. You do not have to complete the stations in order; but ensure that you write your answers in the corresponding section for each station. Station #1: Concept Map. Write answers over boxes. Station #1: Life Cycle of Stars Conclusion Questions: a. ________________________ b.__________________________ ___________________________ ___________________________ c. ___________________________ ___________________________ ___________________________
- 2. Station #4: Classifying Stars by Temperature and Color Conclusion Questions: Our Name:__________________________________ Period:____ Date:____________ Astronomy: Origin and Scope of Our Universe Lab Report Sheet 1. _____ 2. _____ 3. _____ 4. _____ 5. _____ Station #3: Classifying Stars by Luminosity and Size Conclusion Questions: 5. _____ 6. _____ 7. _____ 8. _____ 1. _____ 2. _____ 3. _____ 4. _____
- 3. Pressure Gravity Temperature Stage 1 Stage 2 Stage 3 Stage 4 Stage 5 Station #6: Equilibrium, The Life Goal of a Star Data Table: Draw arrows to indicate whether the variable increased or decreased at each stage. Make a dot if it remained Constant. Challenge Question:______________________________________________________ _______________________________________________________________________ _________________ Station #5: Interactive H-R Diagram Star Temperature Brightness Betelgeuse Vega Our Sun Centauri B Sirius B Challenge Questions: a. _______________________________ _________________________________ _________________________________ b. _______________________________ Conclusion Questions: a) ____ b) ____ c) ____ d) ____ e) ____ f) ____ g) ____
- 4. Station # 7: Light Up H-R Diagram: Conclusion Questions Station #8: The Future of Our Sun: Data: Trace the path of the sun’s life cycle below. Label time at each stop. Challenge Question: Property Bottom Left of H-R Diagram Bottom Right of H-R Diagram Top Left of H-R Diagram Top Right of H-R Diagram Size Brightness Temperature Station #3: Doppler Effect Computer Program Conclusion Questions: a._________________________________ 1. _____ 2. _____ 3. _____ 4. _____ 5. _____ 6. _____ 7. _____ 8. _____ 9. _____ 10. _____ Conclusion Questions: 1. _____ 2. _____ 3. _____ 4. _____ 5. _____