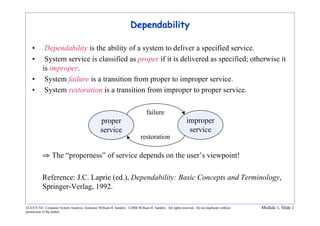
l4a.pdf
- 1. ECE/CS 541: Computer System Analysis, Instructor William H. Sanders. ©2006 William H. Sanders. All rights reserved. Do not duplicate without
permission of the author.
Module 1, Slide 1
Dependability
• Dependability is the ability of a system to deliver a specified service.
• System service is classified as proper if it is delivered as specified; otherwise it
is improper.
• System failure is a transition from proper to improper service.
• System restoration is a transition from improper to proper service.
⇒ The “properness” of service depends on the user’s viewpoint!
Reference: J.C. Laprie (ed.), Dependability: Basic Concepts and Terminology,
Springer-Verlag, 1992.
improper
service
failure
restoration
proper
service
- 2. ECE/CS 541: Computer System Analysis, Instructor William H. Sanders. ©2006 William H. Sanders. All rights reserved. Do not duplicate without
permission of the author.
Module 1, Slide 2
Examples of Specifications of Proper Service
• k out of N components are functioning.
• every working processor can communicate with every other working processor.
• every message is delivered within t milliseconds from the time it is sent.
• all messages are delivered in the same order to all working processors.
• the system does not reach an unsafe state.
• 90% of all remote procedure calls return within x seconds with a correct result.
• 99.999% of all telephone calls are correctly routed.
⇒ Notion of “proper service” provides a specification by which to evaluate a
system’s dependability.
- 3. ECE/CS 541: Computer System Analysis, Instructor William H. Sanders. ©2006 William H. Sanders. All rights reserved. Do not duplicate without
permission of the author.
Module 1, Slide 3
Dependability Concepts
• Measures - properties expected from
a dependable system
– Availability
– Reliability
– Safety
– Confidentiality
– Integrity
– Maintainability
– Coverage
• Means - methods to achieve
dependability
– Fault Avoidance
– Fault Tolerance
– Fault Removal
– Dependability Assessment
• Impairments - causes of
undependable operation
– Faults
– Errors
– Failures
- 4. ECE/CS 541: Computer System Analysis, Instructor William H. Sanders. ©2006 William H. Sanders. All rights reserved. Do not duplicate without
permission of the author.
Module 1, Slide 4
Faults, Errors, and Failures can Cause Improper Service
• Failure - transition from proper to improper service
• Error - that part of system state that is liable to lead to subsequent failure
• Fault - the hypothesized cause of error(s)
Module 1
Module 3
Module 2
Fault Error Failure
Fault Error Failure
Fault Error Failure
Fault Error Failure
- 5. ECE/CS 541: Computer System Analysis, Instructor William H. Sanders. ©2006 William H. Sanders. All rights reserved. Do not duplicate without
permission of the author.
Module 1, Slide 5
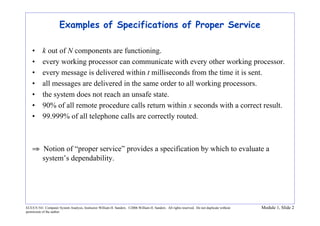
Dependability Measures: Availability
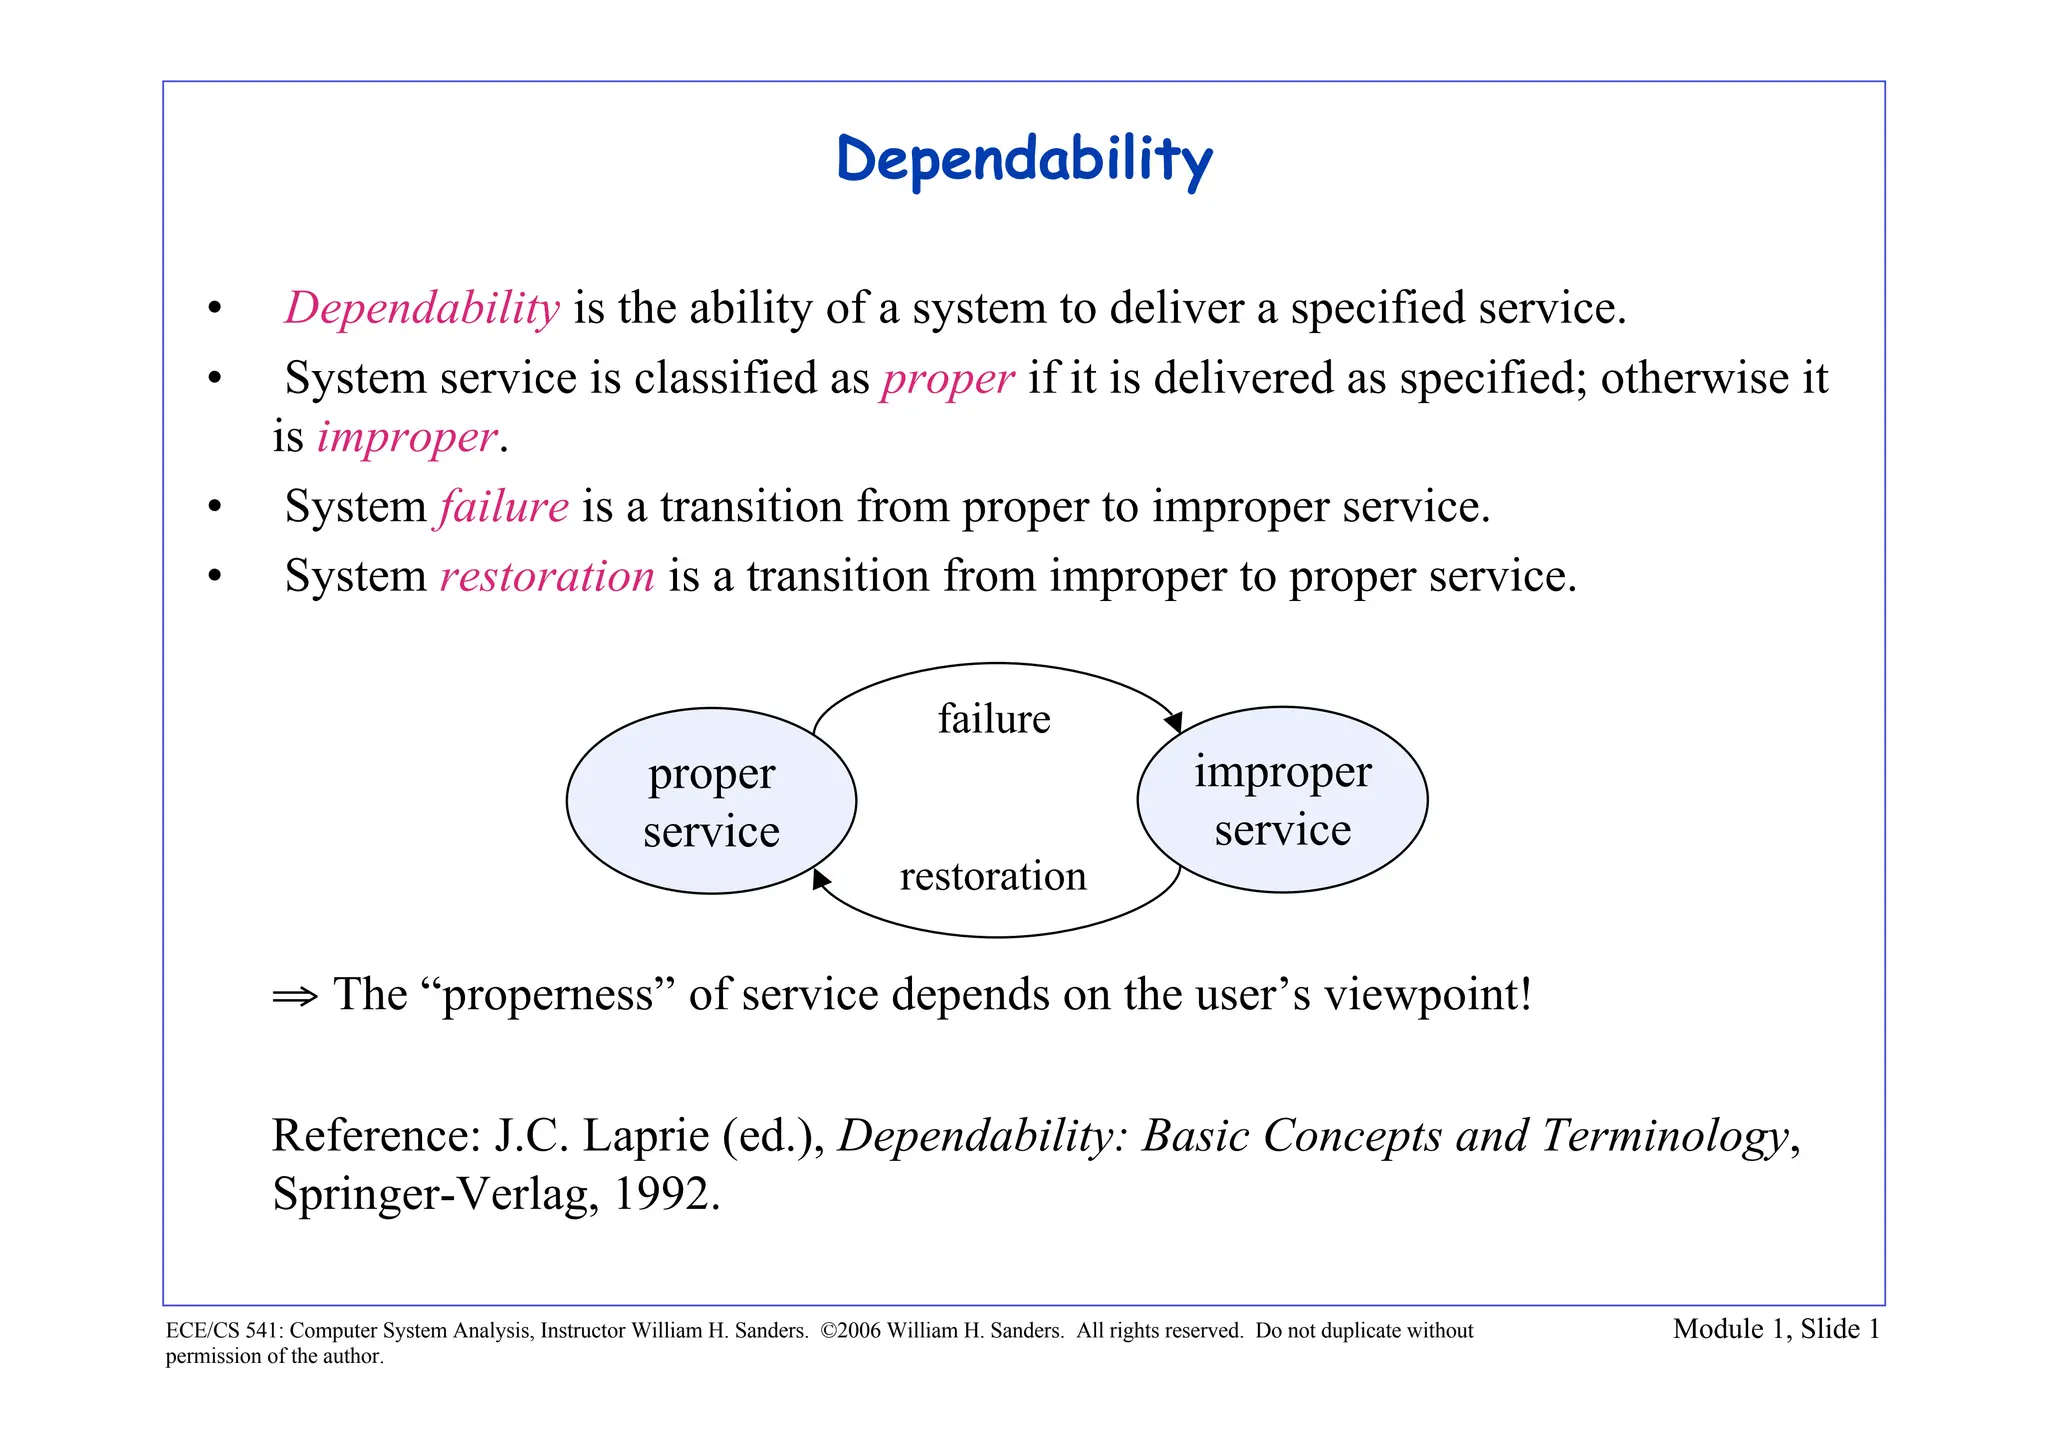
Availability - quantifies the alternation between deliveries of proper and improper
service.
– A(t) is 1 if service is proper at time t, 0 otherwise.
– E[A(t)] (Expected value of A(t)) is the probability that service is proper at
time t.
– A(0,t) is the fraction of time the system delivers proper service during [0,t].
– E[A(0,t)] is the expected fraction of time service is proper during [0,t].
– P[A(0,t) > t*] (0 ≤ t* ≤ 1) is the probability that service is proper more than
100t*% of the time during [0,t].
– A(0,t)t→∞ is the fraction of time that service is proper in steady state.
– E[A(0,t)t→∞], P[A(0,t)t→∞ > t*] as above.
- 6. ECE/CS 541: Computer System Analysis, Instructor William H. Sanders. ©2006 William H. Sanders. All rights reserved. Do not duplicate without
permission of the author.
Module 1, Slide 6
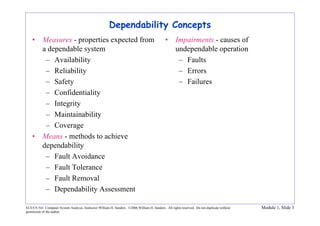
Other Dependability Measures
• Reliability - a measure of the continuous delivery of service
– R(t) is the probability that a system delivers proper service throughout [0,t].
• Safety - a measure of the time to catastrophic failure
– S(t) is the probability that no catastrophic failures occur during [0,t].
– Analogous to reliability, but concerned with catastrophic failures.
• Time to Failure - measure of the time to failure from last restoration. (Expected
value of this measure is referred to as MTTF - Mean time to failure.)
• Maintainability - measure of the time to restoration from last experienced
failure. (Expected value of this measure is referred to as MTTR - Mean time to
repair.)
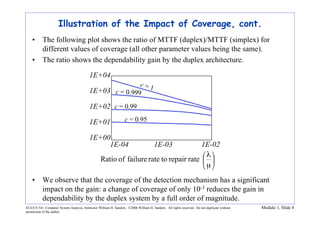
• Coverage - the probability that, given a fault, the system can tolerate the fault
and continue to deliver proper service.
- 7. ECE/CS 541: Computer System Analysis, Instructor William H. Sanders. ©2006 William H. Sanders. All rights reserved. Do not duplicate without
permission of the author.
Module 1, Slide 7
Illustration of the Impact of Coverage on Dependability
• Consider two well-known architectures: simplex and duplex.
• The Markov model for both architectures is:
• The analytical expression of the MTTF can be calculated for each architecture
using these Markov models.
λ
λ
Duplex System
1
2
2 c λ
µ
2 (1-c) λ
λ
λ
Simplex System
1
λ
- 8. ECE/CS 541: Computer System Analysis, Instructor William H. Sanders. ©2006 William H. Sanders. All rights reserved. Do not duplicate without
permission of the author.
Module 1, Slide 8
Illustration of the Impact of Coverage, cont.
• The following plot shows the ratio of MTTF (duplex)/MTTF (simplex) for
different values of coverage (all other parameter values being the same).
• The ratio shows the dependability gain by the duplex architecture.
• We observe that the coverage of the detection mechanism has a significant
impact on the gain: a change of coverage of only 10-3 reduces the gain in
dependability by the duplex system by a full order of magnitude.
!
"
#
$
%
&
µ
'
rate
repair
to
rate
failure
of
Ratio
1E+04
1E+03
1E+02
1E+01
1E+00
1E-04 1E-03 1E-02
c = 1
c = 0.95
c = 0.999
c = 0.99
- 9. ECE/CS 541: Computer System Analysis, Instructor William H. Sanders. ©2006 William H. Sanders. All rights reserved. Do not duplicate without
permission of the author.
Module 1, Slide 9
Failure Sources and Frequencies
Non-Fault-Tolerant Systems
– Japan, 1383 organizations
(Watanabe 1986, Siewiorek &
Swarz 1992)
– USA, 450 companies (FIND/SVP
1993)
Mean time to failure: 6 to 12 weeks
Average outage duration after failure:
1 to 4 hours
Fault-Tolerant Systems
– Tandem Computers (Gray 1990)
– Bell Northern Research (Cramp et al.
1992)
Mean time to failure:
21 years (Tandem)
Hardware
Software
Communications
Environment
Operations-
Procedures
50%
25%
15%
10%
65%
10% 8%
7%
Failure Sources: