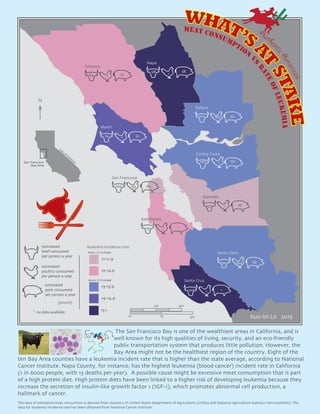
Good Stuff Happens in 1:1 Meetings: Why you need them and how to do them well
kuolin lo final
1. Sonoma
Marin
Napa
Solano
Contra Costa
Alameda
Santa Clara
Santa Cruz
San Mateo
San Francisco
124 132 84
84 51
74 52
98 58
102 190 52
120 122
120 *
39
64 294 59
120 *
119 * *
*
*
*
*
*
WHAT’SA
T
STAKE
meat consumption
v
s
rateofleukemia
Auth
enticAmerican
San Francisco
Bay Area
CALIFO
RN
IA
The San Francisco Bay is one of the wealthiest areas in California, and is
well known for its high qualities of living, security, and an eco-friendly
public transportation system that produces little pollution. However, the
Bay Area might not be the healthiest region of the country. Eight of the
ten Bay Area counties have a leukemia incident rate that is higher than the state average, according to National
Cancer Institute. Napa County, for instance, has the highest leukemia (blood cancer) incident rate in California
(1 in 6000 people, with 13 deaths per year). A possible cause might be excessive meat consumption that is part
of a high protein diet. High protein diets have been linked to a higher risk of developing leukemia because they
increase the secretion of insulin-like growth factor 1 (IGF-1), which promotes abnormal cell production, a
hallmark of cancer.
The data of estimated meat consumtion is derived from statistics of United States Department of Agriculture (USDA) and National Agriculture Statistics Service(NASS). The
data for leukemia incidence rate has been obtained from National Cancer Institute.
Kuo-lin Lo 2015
estimated
poultry consumed
per person a year
estimated
beef consumed
per person a year
estimated
pork consumed
per person a year
above US average
below US average
15+
12-12.9
13-13.9
14-14.9
11-11.9
0 15 30
20 40
N
* no data available
(pound)
leukemia incidence rate