Download to read offline

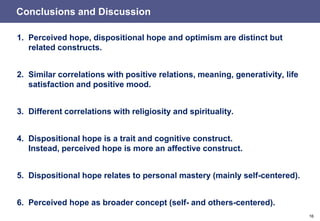


1. The document presents research on distinguishing measures of hope including perceived hope, dispositional hope, and optimism. It analyzes their relationships and identifies determinants and predictors. 2. Confirmatory factor analysis was conducted and showed the constructs are distinct but related. Perceived hope correlated most strongly with life satisfaction and positive mood while dispositional hope related more to personal mastery. 3. Stepwise regression found perceived hope to be the strongest predictor of private life and societal hopes, followed by optimism and dispositional hope. This provides evidence for the importance and impact of hope.