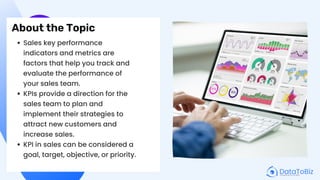
KPIs for Sales
Analytics
Dashboard
About the Topic
Sales key performance
indicators and metrics are
factors that help you track and
evaluate the performance of
your sales team.
KPIs provide a direction for the
sales team to plan and
implement their strategies to
attract new customers and
increase sales.
KPI in sales can be considered a
goal, target, objective, or priority.
1. Lead Generation
Percentage
You need to know how many
leads the sales team is
generating.
A lack of leads implies a
lukewarm or cold performance.
It can also mean that the target
audiences are entirely wrong
and have nothing to do with the
product or service you offer.
2. Qualified Leads
The next important KPI is the
number of qualified leads. Not
every lead generated by the
team will deliver value to your
business.
However, if a majority of the
leads don’t qualify, it indicates
an issue with the sales
strategy.
3. Email Open Rate
This KPI is particularly
important if you use an email
marketing strategy to reach
out to the target audience.
You would want more
receivers to open the emails
and click on the links (action
buttons) and engage with
your business.
4. Lead Response Time
Lead response time provides
insights about whether the
sales rep is following leads
and sending timely updates,
if the established process is
delivering results, and which
areas are causing friction
and increasing the time
taken to qualify leads.
5. Brand Mentions
Brand mentions are another important
KPI that helps in determining your
presence on the internet.
Of course, it is essential to see if the
mentions are positive or negative.
A higher percentage of positive brand
mentions indicates that more people
are discussing your products and
services.
This data helps in fine-tuning targeted
marketing strategies for each channel.
6. Conversion Rate for
Visitors to Leads
The visitor-to-lead conversion
rate is measured for the
business website. It helps track
the CRO (conversion rate
optimization) of the website.
This data can be used for SEO
and to create effective
marketing emails.
Conclusion
The KPIs for the sales
analytics dashboard can be
varied, depending on your
business requirements.
Choosing the right KPIs and
investing in advanced tools
are both important to stay
up to date about your
strategies and results.
Thank You For Reading!
Check out more: www.datatobiz.com

KPIs for Sales Analytics Dashboard - By DataToBiz

  • 1.
  • 2.
    About the Topic Saleskey performance indicators and metrics are factors that help you track and evaluate the performance of your sales team. KPIs provide a direction for the sales team to plan and implement their strategies to attract new customers and increase sales. KPI in sales can be considered a goal, target, objective, or priority.
  • 3.
    1. Lead Generation Percentage Youneed to know how many leads the sales team is generating. A lack of leads implies a lukewarm or cold performance. It can also mean that the target audiences are entirely wrong and have nothing to do with the product or service you offer.
  • 4.
    2. Qualified Leads Thenext important KPI is the number of qualified leads. Not every lead generated by the team will deliver value to your business. However, if a majority of the leads don’t qualify, it indicates an issue with the sales strategy.
  • 5.
    3. Email OpenRate This KPI is particularly important if you use an email marketing strategy to reach out to the target audience. You would want more receivers to open the emails and click on the links (action buttons) and engage with your business.
  • 6.
    4. Lead ResponseTime Lead response time provides insights about whether the sales rep is following leads and sending timely updates, if the established process is delivering results, and which areas are causing friction and increasing the time taken to qualify leads.
  • 7.
    5. Brand Mentions Brandmentions are another important KPI that helps in determining your presence on the internet. Of course, it is essential to see if the mentions are positive or negative. A higher percentage of positive brand mentions indicates that more people are discussing your products and services. This data helps in fine-tuning targeted marketing strategies for each channel.
  • 8.
    6. Conversion Ratefor Visitors to Leads The visitor-to-lead conversion rate is measured for the business website. It helps track the CRO (conversion rate optimization) of the website. This data can be used for SEO and to create effective marketing emails.
  • 9.
    Conclusion The KPIs forthe sales analytics dashboard can be varied, depending on your business requirements. Choosing the right KPIs and investing in advanced tools are both important to stay up to date about your strategies and results.
  • 10.
    Thank You ForReading! Check out more: www.datatobiz.com