Keynote technicals intraday levels for 080812
•
0 likes•77 views

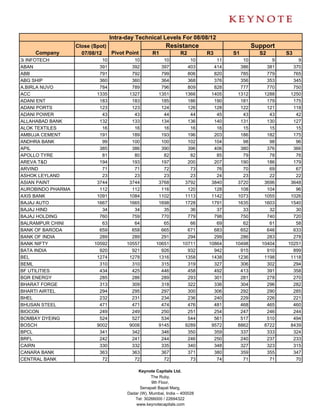
The document provides intra-day technical levels for various companies trading on the stock market on August 8, 2012. It lists the company name, closing price from the previous day, pivot point, and resistance and support levels R1 through R3 and S1 through S3 to watch for intra-day trading. The levels are meant to indicate price points where the stock price may encounter resistance or support during trading on that day.

Recommended
More Related Content
What's hot
What's hot (17)
Viewers also liked
Viewers also liked (17)
Similar to Keynote technicals intraday levels for 080812
Similar to Keynote technicals intraday levels for 080812 (19)
More from Keynote Capitals Ltd.
More from Keynote Capitals Ltd. (20)
Recently uploaded
Recently uploaded (20)
Keynote technicals intraday levels for 080812
- 1. Intra-day Technical Levels For 08/08/12 Close (Spot) Resistance Support Company 07/08/12 Pivot Point R1 R2 R3 S1 S2 S3 3i INFOTECH 10 10 10 10 11 10 9 9 ABAN 391 392 397 403 414 386 381 370 ABB 791 792 799 806 820 785 779 765 ABG SHIP 360 360 364 368 376 356 353 345 A.BIRLA NUVO 784 789 796 809 828 777 770 750 ACC 1335 1327 1351 1366 1405 1312 1288 1250 ADANI ENT 183 183 185 186 190 181 179 175 ADANI PORTS 123 123 124 126 128 122 121 118 ADANI POWER 43 43 44 44 45 43 43 42 ALLAHABAD BANK 132 133 134 136 140 131 130 127 ALOK TEXTILES 16 16 16 16 16 15 15 15 AMBUJA CEMENT 191 189 193 196 203 186 182 175 ANDHRA BANK 99 100 100 102 104 98 98 96 APIL 385 386 390 396 406 380 376 366 APOLLO TYRE 81 80 82 82 85 79 78 76 AREVA T&D 194 193 197 200 207 190 186 179 ARVIND 71 71 72 73 76 70 69 67 ASHOK LEYLAND 23 23 23 23 24 23 22 22 ASIAN PAINT 3744 3744 3768 3792 3840 3720 3696 3648 AUROBINDO PHARMA 112 112 116 120 128 108 104 96 AXIS BANK 1091 1084 1102 1113 1142 1073 1055 1026 BAJAJ AUTO 1667 1665 1698 1728 1791 1635 1603 1540 BAJAJ HIND 34 34 35 36 37 33 32 30 BAJAJ HOLDING 760 759 770 779 798 750 740 720 BALRAMPUR CHINI 63 64 65 66 69 62 61 58 BANK OF BARODA 659 658 665 671 683 652 646 633 BANK OF INDIA 289 289 291 294 299 286 283 278 BANK NIFTY 10592 10557 10651 10711 10864 10498 10404 10251 BATA INDIA 920 921 926 932 942 915 910 899 BEL 1274 1278 1316 1358 1438 1236 1198 1118 BEML 310 310 315 319 327 306 302 294 BF UTILITIES 434 425 446 458 492 413 391 358 BGR ENERGY 285 286 289 293 301 281 278 270 BHARAT FORGE 313 309 318 322 336 304 296 282 BHARTI AIRTEL 294 295 297 300 306 292 290 285 BHEL 232 231 234 236 240 229 226 221 BHUSAN STEEL 471 471 474 476 481 468 465 460 BIOCON 249 249 250 251 254 247 246 244 BOMBAY DYEING 524 527 534 544 561 517 510 494 BOSCH 9002 9006 9145 9289 9572 8862 8722 8439 BPCL 341 342 346 350 359 337 333 324 BRFL 242 241 244 246 250 240 237 233 CAIRN 330 332 335 340 348 327 323 315 CANARA BANK 363 363 367 371 380 359 355 347 CENTRAL BANK 72 72 72 73 74 71 71 70 Keynote Capitals Ltd. The Ruby, 9th Floor, Senapati Bapat Marg, Dadar (W), Mumbai, India – 400028 Tel: 30266000 / 22694322 www.keynotecapitals.com
- 2. Intra-day Technical Levels For 08/08/12 Close (Spot) Resistance Support Company 07/08/12 Pivot Point R1 R2 R3 S1 S2 S3 CENTURY TEXTILES 308 307 313 317 327 303 298 288 CESC 299 300 305 312 323 294 289 278 CHAMBL FERT. 72 72 72 73 74 71 71 70 CIPLA 352 352 354 356 359 350 348 344 CNX INFRA 2403 2401 2413 2423 2445 2391 2379 2357 CNX IT 5800 5784 5834 5869 5954 5750 5699 5615 CNX PSE 2928 2922 2937 2946 2971 2913 2897 2872 COAL INDIA 345 344 347 349 355 341 338 332 COLGATE 1187 1191 1199 1211 1231 1179 1171 1151 CORE EDUTEC. 289 289 292 295 300 286 283 278 CROMPTON GREAVES 118 118 119 121 123 117 116 113 CUMMINS INDIA 470 468 474 478 487 464 459 449 DABUR 120 120 121 122 125 119 118 116 DCB 42 42 42 43 44 41 41 40 DCHL 14 14 14 15 17 13 13 11 DELTA CORP. 61 61 62 63 64 60 60 58 DENA BANK 92 92 94 95 98 91 89 86 DHANLAKSHMI BANK 51 52 52 53 55 51 50 49 DISH TV 73 72 74 76 79 71 69 66 DIVIS LAB 1103 1111 1123 1143 1176 1091 1079 1047 DJIA 13118 13135 13170 13222 13310 13082 13047 12960 DLF 217 216 221 225 234 212 207 198 DR. REDDYS 1659 1655 1679 1699 1743 1635 1611 1567 EDUCOMP 163 162 165 168 174 159 155 149 EKC 30 30 31 32 33 29 29 27 ESCORTS 63 62 64 66 69 61 59 55 ESSAR OIL 57 57 57 58 59 56 55 54 EXIDE INDS. 130 130 131 132 134 129 128 126 FEDERAL BANK 417 416 422 426 435 412 407 397 FINANCIAL TECH. 792 795 806 819 843 782 772 748 FORTIS 100 100 101 102 105 99 98 96 GAIL 379 375 385 391 406 369 359 344 GE SHIPPING 262 263 266 269 275 260 257 251 GLAXO 2100 2096 2119 2138 2179 2077 2055 2013 GMDC 193 193 194 195 198 192 190 188 GMR INFRA 23 23 24 24 24 23 23 22 GODREJIND 251 252 254 257 263 249 246 241 GRASIM 2929 2918 2949 2968 3017 2899 2868 2819 GSPL 73 74 75 77 79 72 71 69 GUJ. FLOUROCHEM 361 362 366 370 378 358 355 347 GVK POWER 14 14 14 14 14 13 13 13 HAVELLS 548 548 553 557 566 544 540 531 HCC 18 18 18 19 19 18 17 17 HCL TECH. 531 531 538 545 560 524 517 502 HDFC 720 716 725 731 747 710 700 685 Keynote Capitals Ltd. The Ruby, 9th Floor, Senapati Bapat Marg, Dadar (W), Mumbai, India – 400028 Tel: 30266000 / 22694322 www.keynotecapitals.com
- 3. Intra-day Technical Levels For 08/08/12 Close (Spot) Resistance Support Company 07/08/12 Pivot Point R1 R2 R3 S1 S2 S3 HDFC BANK 600 600 603 605 610 597 595 589 HDIL 84 83 85 86 89 82 81 78 HERO MOTOCORP 1952 1950 1959 1966 1983 1943 1934 1918 HEXAWARE 115 115 116 117 120 113 112 109 HINDALCO 119 119 120 121 122 118 117 116 HIND.OIL. EXP 125 125 126 128 131 123 122 119 HIND PETRO 319 321 325 331 341 315 311 301 HIND UNILEVER 470 470 473 476 482 467 464 457 HIND ZINC 119 119 120 120 121 119 118 117 HOTEL LEELA 31 31 31 31 32 30 30 30 INDIABULLS REALEST. 56 56 56 57 59 55 55 53 ICICI BANK 974 969 983 991 1013 960 946 924 IDBI 87 88 89 90 92 86 85 83 IDEA 80 80 81 82 83 79 78 77 IDFC 136 135 138 140 146 133 129 124 IFCI 37 37 37 38 39 37 36 36 IGL 244 242 246 249 257 239 234 226 INDIAN HOTELS 61 60 61 62 63 60 59 58 INDIA CEMENTS 86 86 87 88 90 85 83 81 INDIA INFOLINE 54 53 55 56 58 53 51 49 INDIAN BANK 179 178 180 182 185 177 175 171 INDUSIND BANK 327 326 330 332 338 324 320 314 INFOSYS TECH. 2253 2248 2274 2296 2343 2227 2201 2154 IOB 73 74 74 75 77 73 72 71 IOC 255 254 259 263 273 250 245 235 IRB 117 118 125 134 149 110 103 88 ITC 261 260 263 265 270 258 255 251 IVRCL INFRA 47 47 48 48 50 47 46 45 JET AIRWAYS 388 385 395 402 418 378 369 352 JINDAL SAW 120 120 122 123 126 119 117 114 JINDAL STEEL 407 406 411 415 424 402 397 388 JISLJALEQS 83 83 84 85 86 82 81 79 JP ASSOCIATES 78 77 79 81 84 76 74 70 JP POWER 33 33 33 33 34 32 32 31 JSW ENERGY 53 53 54 55 57 52 51 49 JSW ISPAT 10 10 10 11 11 10 10 10 JSW STEEL 718 717 725 733 749 709 701 685 JUBILANT FOOD 1169 1163 1180 1191 1220 1152 1134 1105 KOTAK BANK 562 563 567 572 581 557 553 544 KTK. BANK 98 97 100 101 106 96 93 89 LIC HSG. FIN. 258 258 260 263 267 256 254 249 LITL 13 13 13 14 14 13 13 13 L&T 1418 1413 1425 1433 1453 1406 1394 1374 LUPIN 588 591 595 602 614 584 579 568 M&M 697 696 701 706 715 692 687 677 Keynote Capitals Ltd. The Ruby, 9th Floor, Senapati Bapat Marg, Dadar (W), Mumbai, India – 400028 Tel: 30266000 / 22694322 www.keynotecapitals.com
- 4. Intra-day Technical Levels For 08/08/12 Close (Spot) Resistance Support Company 07/08/12 Pivot Point R1 R2 R3 S1 S2 S3 MARUTI 1147 1142 1154 1161 1180 1135 1123 1104 MAX 186 183 189 193 203 180 174 164 MCDOWELL-N 843 851 861 880 909 832 822 793 MCLEOD RUSSEL 322 318 327 333 347 313 303 289 MLL 20 20 20 21 21 20 19 18 MPHASIS 404 405 409 415 425 399 395 385 MRF 10503 10553 10647 10791 11029 10409 10316 10078 MRPL 58 57 58 59 60 57 56 55 MTNL 33 33 34 34 36 32 31 30 NALCO 54 54 54 55 55 53 53 52 NCC 40 40 41 42 44 39 38 36 NEYVELI LIGNITE 83 83 84 84 85 83 82 82 NIFTY MCAP50 2110 2110 2118 2127 2145 2101 2092 2074 NHPC 18 18 18 19 19 18 18 17 NIFTY 5337 5323 5364 5391 5460 5296 5254 5186 NMDC 184 184 185 187 189 182 181 178 NTPC 167 167 169 170 174 165 163 159 OFSS 2862 2900 2982 3103 3305 2780 2698 2495 OIL 480 482 485 490 498 477 474 465 ONGC 283 282 285 287 291 281 278 274 ON MOBILE 42 42 43 43 45 41 40 39 OPTO CIRCUITS 156 156 157 158 161 154 153 150 ORCHID CHEM 114 114 116 117 120 113 111 109 ORIENTAL BANK 233 231 241 249 266 224 214 197 PANTALOON RETAIL 163 163 166 169 174 160 158 152 PATEL ENGG. 85 85 86 87 89 84 83 81 PATNI 516 516 519 522 527 513 511 506 PETRONET 149 149 151 152 154 148 147 144 PFC 186 185 187 189 193 183 181 177 PIRAMAL HEALTH 538 534 543 549 563 528 519 504 PNB 752 749 760 768 788 741 729 710 POLARIS 114 115 116 118 120 113 112 109 POWER GRID 119 119 120 122 125 117 116 113 PRAJ IND 53 53 54 55 56 52 52 50 PTC 61 61 62 63 64 60 59 57 PUNJ LLOYD 54 54 54 55 57 53 52 51 RANBAXY 509 512 515 522 532 505 501 491 RAYMOND 362 362 366 370 378 358 354 345 REL. COM. 58 58 59 60 62 57 56 54 REC 209 209 211 213 217 206 204 200 REL. CAPITAL 362 360 367 372 385 354 347 334 RELIANCE 784 786 794 804 822 776 768 749 REL. INFRA 521 520 527 534 548 513 506 492 RENUKA SUGAR 34 34 34 35 37 33 32 31 ROLTA 70 71 71 72 73 70 69 68 Keynote Capitals Ltd. The Ruby, 9th Floor, Senapati Bapat Marg, Dadar (W), Mumbai, India – 400028 Tel: 30266000 / 22694322 www.keynotecapitals.com
- 5. Intra-day Technical Levels For 08/08/12 Close (Spot) Resistance Support Company 07/08/12 Pivot Point R1 R2 R3 S1 S2 S3 REL. POWER 93 93 94 96 98 92 90 87 RUCHI SOYA 86 86 87 88 90 85 84 82 S&P 500 1394 1395 1399 1404 1412 1390 1386 1378 SAIL 87 86 88 89 93 85 83 80 SBI 2061 2048 2085 2109 2169 2024 1987 1927 SCI 56 56 56 57 58 55 55 54 SESA GOA 183 183 184 186 189 182 181 178 SIEMENS 675 674 681 686 698 669 662 650 SINTEX 62 62 63 65 67 61 60 57 SKUMAR SYNF 25 26 26 27 27 25 25 24 SOBHA 363 362 371 379 395 354 346 329 SOUTH INDIAN BANK 24 24 24 24 25 23 23 23 SRE INFRA 22 22 22 22 23 21 21 20 SRIRAM TRANS. FIN. 569 569 575 582 594 563 556 543 STERLITE 104 104 105 106 108 104 103 101 STR TECH. 33 33 33 34 35 32 32 31 SUN PHARMA 670 673 680 691 709 663 656 638 SUN TV 290 290 294 299 308 285 281 272 SUZLON 18 18 18 18 19 18 18 17 SYNDICATE BANK 98 98 99 100 102 97 96 94 TATA CHEM 309 310 313 317 325 305 302 294 TATA COFFEE 980 983 993 1007 1030 969 959 935 TATA COMM 244 245 247 250 255 242 240 234 TATA GLOBAL 130 130 131 132 135 128 127 124 TATA MOTORS 239 236 242 245 253 233 228 220 TATA MOTORS DVR 132 131 134 136 141 129 125 120 TATA POWER 99 98 100 100 102 98 96 94 TATA STEEL 406 406 409 412 418 403 401 395 TCS 1264 1255 1275 1287 1318 1244 1223 1192 TECH M 755 759 768 780 801 746 738 716 TITAN 228 228 229 231 235 226 224 220 TTK PRESTIGE 3846 3826 3950 4053 4280 3723 3600 3373 TTML 13 13 13 13 13 13 12 12 TULIP 105 103 107 109 114 101 98 93 TVS MOTOR 39 39 39 40 41 39 38 37 UCO BANK 70 70 71 72 75 69 68 66 ULTRA CEMCO 1639 1639 1646 1653 1668 1632 1624 1610 UNION BANK 170 170 173 176 182 167 164 159 UNITED PHOS. 122 122 123 125 128 120 118 115 UNITECH 22 21 22 23 24 21 20 19 VIDEOCON INDS. 170 170 171 172 174 169 168 166 VIJAYA BANK 54 54 54 55 55 53 53 52 VIP INDS. 76 76 77 79 81 75 74 72 VOLTAS 109 109 111 113 116 108 106 103 WELCORP 100 100 101 102 104 98 97 95 Keynote Capitals Ltd. The Ruby, 9th Floor, Senapati Bapat Marg, Dadar (W), Mumbai, India – 400028 Tel: 30266000 / 22694322 www.keynotecapitals.com
- 6. Intra-day Technical Levels For 08/08/12 Close (Spot) Resistance Support Company 07/08/12 Pivot Point R1 R2 R3 S1 S2 S3 WIPRO 348 348 351 354 360 345 342 336 YES BANK 370 369 373 377 384 366 362 354 ZEEL 168 166 170 173 180 164 160 153 Sanjay Bhatia (AVP – Technical Research), Email Id sanjay@keynotecapitals.net Pivot Point: Intra- Day Trading Tool. Pivot Point (PP): This is a trigger point for Intra Day Buy / Sell based on the price range of the previous day. R1: Resistance 1: 1st Resistance level over Pivot Point, R2: Resistance 2: Next Resistance level after R1. R3: Resistance 3: Next Resistance level after R2. S1: Support 1: 1st Support level after Pivot Point, S2: Support 2: Next Support level after S1. S3: Support 3: Next Support level after S2. Note: As per this tool, the trader should take BUY position just above the Pivot Point and keep the Pivot Point level as stop loss and the first target would be R1 level (Resistance 1). If R1 is crossed then R2 (Resistance 2) becomes the next target with the stop loss placed at R1 level. If R2 is crossed then R3 (Resistance 3) becomes the next target with the stop loss placed at R2 level. Similarly if price goes below the Pivot Point the trader should take a SELL position and keep the Pivot Point level as the stop loss and the first target would be S1 level (Support 1). If S1 level is breached then S2 level (Support 2) becomes the next target with the stop loss placed at S1 level. If S2 level is breached then S3 level (Support 3) becomes the next target with the stop loss placed at S2 level. This is an intra-day tool. The key to the use of this tool is the use of Stop Loss Disclaimer: This document is not for public distribution and has been furnished to you solely for your information and must not be reproduced or redistributed to any other person. Persons into whose possession this document may come are required to observe these restrictions. This material is for the personal information of the authorized recipient, and we are not soliciting any action based upon it. This report is not to be construed as an offer to sell or the solicitation of an offer to buy any security in any jurisdiction where such an offer or solicitation would be illegal. It is for the general information of clients of Keynote Capitals Ltd. It does not constitute a personal recommendation or take into account the particular investment objectives, financial situations, or needs of individual clients. We have reviewed the report, and in so far as it includes current or historical information, it is believed to be reliable though its accuracy or completeness cannot be guaranteed. Neither Keynote Capitals Ltd., nor any person connected with it, accepts any liability arising from the use of this document. The recipients of this material should rely on their own investigations and take their own professional advice. Price and value of the investments referred to in this material may go up or down. Past performance is not a guide for future performance. Certain transactions -including those involving futures, options and other derivatives as well as non-investment grade securities - involve substantial risk and are not suitable for all investors. Reports based on technical analysis centers on studying charts of a stock’s price movement and trading volume, as opposed to focusing on a company’s fundamentals and as such, may not match with a report on a company’s fundamentals. Opinions expressed are our current opinions as of the date appearing on this material only. While we endeavor to update on a reasonable basis the information discussed in this material, there may be regulatory, compliance, or other reasons that prevent us from doing so. Prospective investors and others are cautioned that any forward- looking statements are not predictions and may be subject to change without notice. Our proprietary trading and investment businesses may make investment decisions that are inconsistent with the recommendations expressed herein. We and our affiliates, officers, directors, and employees world wide may: (a) from time to time, have long or short positions in, and buy or sell the securities thereof, of company (ies) mentioned herein or (b) be engaged in any other transaction involving such securities and earn brokerage or other compensation or act as a market maker in the financial instruments of the company (ies) discussed herein or act as advisor or lender / borrower to such company (ies) or have other potential conflict of interest with respect to any recommendation and related information and opinions. The analyst for this report certifies that all of the views expressed in this report accurately reflect his or her personal views about the subject company or companies and its or their securities, and no part of his or her compensation was, is or will be, directly or indirectly related to specific recommendations or views expressed in this report. No part of this material may be duplicated in any form and/or redistributed without Keynote Capitals Ltd’s., prior written consent. Keynote Capitals Ltd. The Ruby, 9th Floor, Senapati Bapat Marg, Dadar (W), Mumbai, India – 400028 Tel: 30266000 / 22694322 www.keynotecapitals.com