Mida tõi Eestile 2012. aasta? Traditsiooniliselt annab statistika aastaraamat ülevaate keskkonna, rahvastiku, sotsiaal- ja majanduselu olukorrast 2012. aastal võrdluses kolme-nelja varasema aastaga. Kokkuvõtliku pildi majanduses ja ühiskonnas toimunud muutustest pakub majandus- ja sotsiaalülevaade, samuti Eestit iseloomustavad teemakaardid. Iga käsitletava valdkonna kohta on aastaraamatus ülevaatlik artikkel, mida täiendavad tabelid ja joonised. Eesti kohta maailmas aitavad iseloomustada võrdlused teiste riikidega. Raamatu lõpus on statistiliste mõistete ja määratluste tähestikuline loend ning sisujuht.
The document analyzes wage and salary trends in Estonia, Latvia, and Lithuania from 2008 to 2017. It finds that average monthly gross wages have increased steadily over this period but remain highest in Estonia and lowest in Lithuania. Minimum wages have also risen across the three countries but minimum wages as a percentage of average wages vary significantly.
Face à une économie mondiale caractérisée par l'ouverture des marchés, la libéralisation des échanges et l'avènement des technologies de l'information; les entreprises sont contraintes de remettre en cause leurs pratiques de contrôle de gestion, ainsi que leur modèle d'organisation afin d'améliorer leur performance et d'être compétitives, condition nécessaire à leur pérennité.
The document discusses the creative critical reflection of a 2-minute sci-fi/thriller movie opening created by the author. The opening follows conventions of the genres through its laboratory setting, props, costumes and fast-paced cuts. It aims to convey mystery and tension through background music and sound effects. The opening also engages with social issues around emerging diseases and the need for timely cures. It was meant to be different from the typical romance or horror genres other students chose.
1.Gives basic idea about what is arduino? and their funtionalites.
2. Applications of arduino
3. Adruino programming
4. what is Nodemcu ?
5. pindiagram of Nodemcu
The document provides an outline for a review of industrial security management. It begins with a pre-test multiple choice quiz on concepts in industrial security. It then covers topics like relevant laws, the origins of security, related government and private agencies. It defines important security terms and outlines requirements for private security services. The document serves as a study guide for an examination on industrial security management.
Kolga Seltsimaja lugu 1873-.... Kolga aleviku serval männimetsas on üks tore maja, mis kunagi oli Eesti ühe suurima omavalitsuse - Kolga valla - keskus.
Salaries in baltic_states_dec_2018_publishingKadri Seeder
This document summarizes wage trends in Estonia, Latvia, and Lithuania from 2008 to 2018, with forecasts through 2022. It finds that average monthly gross wages have steadily increased in all three countries over this period. Estonia has seen the highest average wages, reaching over 1,500 euros by 2018, while Latvia and Lithuania earn less at around 1,000 euros. Real wages, which account for inflation, have also grown consistently in recent years. Minimum wages in the Baltic states are a much lower percentage of average wages than in other European nations.
This document contains information about wages and salaries in the Baltic states of Estonia, Latvia, and Lithuania from 2008 to 2022. It shows that average monthly gross wages have generally increased over time in all three countries, with Estonia typically having the highest wages and Lithuania the lowest. Minimum wages as a percentage of average gross wages have also risen. Wage growth has slowed in recent years but remains positive in most periods.
Salaries in the Baltic States March 2018Kadri Seeder
This document analyzes wages and salaries in the Baltic States from 2008 to 2018. It finds that:
- Average monthly gross wages have generally increased each year in Estonia, Latvia, and Lithuania, with forecasts of continued growth through 2021. Estonia typically has the highest wages while Latvia has the lowest.
- Average monthly net wages have also risen annually but are lower than gross wages. The gap between gross and net pay has widened in recent years.
- Minimum wages in each country, expressed as a percentage of average gross wages, have risen over time but remain under 20% in all three Baltic nations.
- Wage growth has been higher in quarters compared to the same period the previous
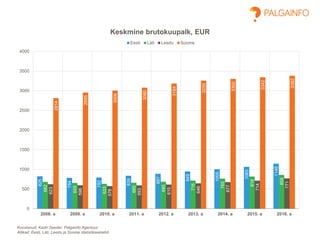
Keskmine brutokuupalk Eestis, Lätis, Leedus ja Soomes
1. Koostanud: Kadri Seeder, Palgainfo Agentuur
Allikad: Eesti, Läti, Leedu ja Soome statistikaametid
825
784
792
839
887
949
1005
1065
1146
682
655
633
660
685
716
765
818
859
623
596
576
593
615
646
677
714
771
2814
2955
3006
3080
3184
3259
3302
3342
3382
0
500
1000
1500
2000
2500
3000
3500
4000
2008. a 2009. a 2010. a 2011. a 2012. a 2013. a 2014. a 2015. a 2016. a
Keskmine brutokuupalk, EUR
Eesti Läti Leedu Soome
2. Koostanud: Kadri Seeder, Palgainfo Agentuur
Allikad: Eesti, Läti, Leedu ja Soome statistikaametid
-41
9
47
48
62
56
60
81
-27
-22
27
25
31
49
53
41
-28
-20
17
23
31
31
37
57
141
51
74
104
75
43
40
40
-100
-50
0
50
100
150
200
2009. a 2010. a 2011. a 2012. a 2013. a 2014. a 2015. a 2016. a
Keskmise brutokuupalga muutus võrreldes eelmise aastaga, EUR
Eesti Läti Leedu Soome
3. Koostanud: Kadri Seeder, Palgainfo Agentuur
Allikad: Eesti, Läti, Leedu ja Soome statistikaametid
-5.0%
1.1%
5.9% 5.7%
7.0%
5.9% 6.0%
7.6%
-4.0%
-3.4%
4.3%
3.8%
4.5%
6.8% 6.9%
5.0%
-4.4%
-3.3%
2.9%
3.8%
5.1%
4.8%
5.4%
7.9%
5.0%
1.7%
2.5%
3.4%
2.4%
1.3% 1.2% 1.2%
-6.0%
-4.0%
-2.0%
0.0%
2.0%
4.0%
6.0%
8.0%
10.0%
2009. a 2010. a 2011. a 2012. a 2013. a 2014. a 2015. a 2016. a
Keskmise brutokuupalga muutus võrreldes eelmise aastaga, %
Eesti Läti Leedu Soome