Kenya Power intends to increase electricity inclusion from 30% to over 70% by 2017 in an ambitious plan. The company plans to invest an additional USD 1.3 billion to support this distribution expansion, 70% of which will be debt. This rapid expansion risks accumulating excessive debt that could choke the company. A more sustainable target would be to achieve 70% inclusion by 2019 without compromising Kenya Power's financial health. Kenya Power is currently undervalued and presents a buying opportunity, with a fair value estimate of 24.9 per share compared to the current trading price of 16.45.
- The key takeaways from a meeting with the Coal Secretary are that the focus is shifting from increasing coal supply to boosting power sector demand. Coal India's volume growth is expected to remain robust but coal demand from power plants has been sluggish.
- Non-power sector allocation of coal is expected to increase which would benefit Coal India. A price hike for coal supplied to the power sector may also be considered.
- The broker maintains a 'Buy' rating on Coal India with a target price of INR448 per share, expecting coal volumes to grow at a 10% CAGR and earnings to double over the next five years.
The document compares BHEL and Reliance Industries on various metrics like revenue, assets, employees, products/services, and performance over time. BHEL is an engineering and manufacturing company focused on power generation while Reliance Industries has businesses in petroleum refining, petrochemicals, and oil/gas exploration. Both companies have grown significantly over time and contribute greatly to the Indian economy.
This document summarizes a meeting of the IEA WIND TASK 26 PROJECT on examining the value of wind energy to Ireland. It outlines three wind energy scenarios studied: no new wind, meeting domestic targets, and enabling UK to meet targets through Irish wind exports. The study found that wind energy results in limited impact on consumer bills, improves Ireland's energy balance of payments, and provides net economic benefits through jobs and economic growth outweighing infrastructure costs. Exporting wind energy could further grow these benefits if costs are lower than UK alternatives like offshore wind.
This document summarizes the potential impacts of Ireland's transition to the Integrated Single Electricity Market (I-SEM) on ESB power stations. Key impacts include uncertainty around the new Capacity Revenue Mechanism and how it will value existing versus new generation capacity. There is also risk from changes to how renewable energy will be dispatched and incentives. However, a more liquid forward market and increased renewables also provide opportunities for ESB to develop new technologies and contracts. Overall the I-SEM transition presents both risks and opportunities for ESB as the largest generator.
The presentation discusses EnerNOC, an energy management company. It covers EnerNOC's demand response business model, the growing energy industry, recent contracts and financials. EnerNOC provides utilities with demand management services to reduce peak energy usage and offers commercial clients energy monitoring and reporting. The presentation recommends EnerNOC as a potential investment due to its fast growth, scalable business model, and regulatory tailwinds.
This document summarizes Water en Energiebedrijf (W.E.B.) Aruba N.V.'s presentation to Parliamentary committees regarding a proposed electricity tariff increase. It outlines that W.E.B. has accomplished a 40% reduction in heavy fuel oil consumption through investments but faces rising fuel costs and a drop in electricity sales. Without a tariff increase, W.E.B. projects ongoing losses, inability to fund future operations and investments, and non-compliance with financial covenants. The proposed tariff increase would allow W.E.B. to further reduce fuel consumption and increase renewables while improving its financial position and compliance with financial ratios.
The document provides an overview of Capital Power's investor meetings in June 2016. It discusses updates to Alberta's Climate Leadership Plan including the facilitation of coal phase-out by 2030 and potential compensation. It also notes the financial impacts of the carbon competitiveness regulation and acceleration of renewables to replace retiring coal generation. The document summarizes growth opportunities including Genesee 4&5, Halkirk 2, and Bloom Wind project in the US. It provides an overview of Capital Power's capital allocation including maintaining its dividend, funding growth opportunities, and debt repayment.
ONGC, which owns 30% of an oil block in Rajasthan operated by Cairn India, has withheld $500 million in payments to Cairn, alleging that Cairn's expenditures exceeded approved budgets. As a state-owned firm, ONGC objects to several expenditure items in recent months, with the amount unpaid accumulating to around $500 million.
Dr. Arnold McIntyre, Deputy Division Chief, Caribbean Division I, Western Hemisphere Department, International Monetary Fund discusses Caribbean energy challenge during the Caribbean Development Bank's seminar on 'Micro, Small and Medium Enterprise (MSME) Development in the Caribbean: Towards a New Frontier' at the 46th Annual Meeting in Montego Bay, Jamaica on May 18, 2016.
The SHAMS initiative in Dubai aims to deploy widespread solar PV generation by encouraging households and buildings to install solar panels. This presents both opportunities and challenges, including upgrading Dubai's power grid and assessing the economic feasibility of PV systems at different property scales. Financial modeling shows the key parameters affecting PV viability are electricity tariff prices and the size of the PV system. While Dubai's real estate market is currently declining, studies in the US found properties with solar panels sold for higher prices and more quickly, suggesting SHAMS could help accelerate Dubai's real estate recovery.
For the second quarter of fiscal year 2011, Amara Raja Batteries reported an 8.7% increase in net sales to Rs. 392.5 crore, below expectations. EBITDA margins declined significantly by 909 basis points due to higher lead prices and lower realization from the telecom battery segment. Net profit declined 33.8% year-over-year to Rs. 31.6 crore. The company maintained its positive outlook for battery demand growth but expects current lower prices in telecom batteries to restrict earnings growth in the near term.
The document summarizes a project to build the Sutton Bridge Power Project, a 790 MW natural gas-fired power plant in the UK. A consortium including Enron and GE planned to invest over £300 million in the project. Enron would take on construction and market risks, while GE guaranteed turbine performance. The project involved tolling agreements with Eastern Electricity for 15 years and was expected to generate over £250 million in net present value over 15 years based on financial projections. The project demonstrated innovation in operating without long-term power purchase agreements.
This document discusses the progress and policy drivers of clean energy investment and identifies challenges and solutions for power systems with high renewable energy penetration. Renewable energy costs have fallen dramatically in recent years while global investment has reached record highs, driven by renewable portfolio standards and mandates in California, Europe, China and other jurisdictions. Concerns about the variability of wind and solar power are addressed by solutions such as energy storage, demand response and gas backup generation. The document argues for "investment-grade policy" characterized by performance incentives, long time horizons, siting and contract certainty to reduce costs and scale up deployment of clean energy.
This document provides an investment analysis and $18 target price for SunCoke Energy Partners LP (SXCP). Key points include:
- SXCP is a metallurgical coke producer and coal logistics company with long-term contracts providing stable revenue.
- The analysis sees an opportunity due to SXCP trading at a 35% discount to the analyst's implied $18 value.
- While coal prices affect investor sentiment, SXCP's business model passes on coal costs and faces minimal commodity risk through its contracted revenues.
PwC Advisory Case Competition, 2nd place team
• Competed against 50 teams
• Identified strategic solutions for Baker Hughes to respond to the volatility of oil prices to improve profitability over the next 5 years
Newsletter by E-Cube Energy with focus on India and Energy Efficiency. In this edition we cover an interesting mix of topics from policy issues around PAT Scheme to use of Data Analytics to foster energy efficiency.
The document describes a trip to the fairy-tale kingdom of Tramptária. Various activities are mentioned including workshops, dance, games, art, seeing the center of Europe, a memorial stone, spending time with Donkey Paul, herding sheep, learning about architecture and miniatures, visiting a mine that extracted copper and gold, having a barbecue party and singing songs, playing games, having disco parties, playing theater, and feeling tired at the end with tears.
Active Directory is critical Windows infrastructure that allows users to access network resources and services. It is important to monitor Active Directory to prevent issues that could block all users from logging in or accessing email. OpManager comprehensively monitors Active Directory by checking the availability and performance of domain controllers, services, system resources, and event logs. It will instantly alert administrators if any critical components fail so issues can be addressed before users are impacted.
El documento destaca la importancia de la participación de la familia en la educación de los hijos. Señala que tanto la familia como la escuela deben trabajar juntos y compartir la responsabilidad de educar de forma integral a los niños, creando espacios de comunicación. También enfatiza que los niños deben ser el foco principal de ambas instituciones.
The document provides a summary of 10 mobile apps that are useful for events. It describes apps that allow setting meeting times across time zones, tracking speaker flights, registering attendees, managing guest lists and check-ins, sharing meeting materials and agendas, participating in online meetings, enabling collaboration and co-creation, running live polls and displaying tweet walls, conducting surveys and quizzes, and other event management tasks. The apps discussed include Meetup Time, FlightTrack Pro, Please Sign In, Check In Easy, Zwoor Event HD, TeamViewer for Meetings, iBrainstorm, Projectorfy, QuickTapSurvey, and others.
El documento lista los actores y presentadores para una representación teatral de las Coplas, Dichos y Romances de Don Quijote de la Mancha. Incluye los nombres de los actores que interpretarán los papeles de Sancho Panza y Don Quijote, así como los presentadores de los Generales Primero "E" y "C" y una breve presentación poética.
This document lists the names of over 30 castles and palaces located across Europe, primarily in France, but also in countries like Spain, Belgium, England, Germany, Austria, Portugal, the Czech Republic, Scotland, Sweden, Russia, Denmark, and Italy. Many of the names are listed more than once. The list includes well-known locations like Chambord and Chenonceau in France as well as Windsor Castle in England.
Luke Hannam - Authenticity Vs Success (Darker Music Talks May '13)Tommy Darker
The document discusses the relationship between authenticity and commercial success in different music genres. It presents the results of a survey that rated various genres on a scale of authenticity. Rock, hip hop, and indie were rated the most authentic, while pop was rated the least. The document then examines the careers of different artists, showing how perceptions of authenticity can impact success over time. It argues that an artist experiences both intrinsic artistic processes and extrinsic commercial processes, and that balancing these two influences can be challenging when pursuing a career in popular music.
Capital Resources Group, Inc. is a commercial real estate services firm that offers realty services, insurance brokerage, development, mortgage banking, management services, and lodging services. It provides brokerage, insurance, development, financing, property management, and hotel investment services. The company aims to maximize the value of clients' assets through strategic and comprehensive solutions. It has extensive experience and analytical capabilities to complete all aspects of commercial real estate transactions.
From planning to networking - Apps make every aspect of the event experience much easier. However, with so many options in the market, organizers who have never implemented an app before inevitably face a problem of too much choice. This presentation show how different functionalities of event app can drive engagement in events.
Requisiti di ammissione e modalità di svolgimento del Concorso 65 Coadiutori Banca d'Italia
Esercitati sui centinaia di migliaia di quiz con i servizi di www.concorsando.it
The document lists the speakers, hosts, sponsors, and supporters of the 2010 Women Grow Business Boot Camp event on June 19, 2010. It provides contact information including names, company websites, phone numbers, and email addresses for over 25 individuals involved in the event. The event was sponsored by Network Solutions and Steptoe & Johnson LLP.
Adii Pienaar: Lessons learnt running a global startup from the edge of the worldWebExpo
“Inspire other startups to aim higher and build global companies.”
More at http://webexpo.net/prague2013/talk/lessons-learnt-running-global-startup-from-edge-of-world/
Kengen is a Kenyan power company that aims to generate 3,000MW of power by 2018 (Horizon II of its "Good to Great" plan). As of 2015, installed capacity was 1,537MW, making the Horizon II target unlikely. Kengen plans to raise capital through a rights issue and debt conversion to equity to fund projects that could add 1,000MW by 2018. However, the company has high capital expenditures, accounting policies that boost profits, and is expected to have slowing growth. The analyst recommends selling the stock, as its ambitious expansion plans threaten cash flows and it is unlikely to deliver long-term value.
CESC Q4FY15: Net sales up 13.64% y/y to INR14,160m, Firstcall recommend 'Buy'IndiaNotes.com
CESC Limited reported financial results for the quarter ending March 31, 2015. Net sales increased 13.64% year-over-year to Rs. 14,160 million. Net profit grew 0.41% to Rs. 2,440 million. EBITDA increased 2.12% to Rs. 4,810 million. The company expects net sales and profit to grow at a CAGR of 7-8% through 2017 on plans to strengthen its distribution network. It recommends a dividend of Rs. 9 per share.
Post Budget Economics Outlook - Peck Boon Soon, Head of Economics, RHB Resear...Eric Lee
Now that Malaysia's Budget 2015 has been announced, how do you foresee it affecting your investment strategy?
Our team of award-winning RHB Research economists and analysts share exclusive market insights at RHB Investment Bank's post-budget investment seminar @RHB Centre, Kuala Lumpur 18 October 2014:
Dena Bank reported a 28.9% year-over-year increase in net profit for the second quarter of fiscal year 2011, ahead of estimates, driven by better-than-expected operating performance and healthy growth in low-cost deposits. Net interest income grew 93.5% year-over-year due to a substantial improvement in net interest margins from increased CASA deposits and core fee income rose 34.9% year-over-year. While gross NPAs rose slightly, slippages declined and provision coverage improved. The bank plans to receive capital infusions that will boost its capital adequacy ratio.
The document recommends buying shares of Busan City Gas (BCG) based on the following points:
1. BCG has a monopoly on natural gas distribution in Busan, Korea, generating predictable cash flows. However, its stock price fell due to a one-time earnings decline and now offers upside.
2. BCG's intrinsic value exceeds its stock price, which fails to account for undervalued real estate assets.
3. The majority owner of BCG may fully acquire the company, unlocking its true value for shareholders.
Buy Rural Electrification, MoU signed with TSGENCO for funding for proposed p...IndiaNotes.com
Rural Electrification Corporation Ltd (REC) reported a 20% increase in net sales to Rs. 53334 million for Q4 FY15 compared to the same period last year. Net profit decreased by 8% to Rs. 10965 million. EBITDA grew by 11% to Rs. 47535 million. REC signed a memorandum with Telangana state government to provide Rs. 240000 million in funding for power projects. For FY15-17E, the company expects net sales and profit to grow at a CAGR of 17% and 13% respectively.
- The document analyzes the power sectors in Kenya and Uganda, projecting strong growth in electricity demand driven by economic growth targets.
- Peak electricity demand in Kenya is projected to grow at an 11.3% CAGR to 3,163MW by 2020, while Uganda's is projected to grow 8.75% to 948MW.
- Significant potential exists for power sector companies as infrastructure developments, private sector participation, and a shift to renewable energy are expected to reduce costs and improve reliability of electricity supply.
Metro's third quarter financial report for FY 2014-2015 shows that revenues are tracking above budget projections while expenditures are closely aligned with budgeted levels. Program revenues, including charges for services and grants, are 71.9% of budget for the quarter. General revenues such as property taxes and construction excise taxes are meeting or exceeding targets. Expenditures for operations and capital projects make up 62.3% and 46.4% respectively of the amounts budgeted for the third quarter. Based on current trends, Metro projects ending the fiscal year with revenues exceeding budget by 30.4% and expenditures at 85.1% of the total budget.
1) United Bank for Africa (UBA) reported a 17.32% rise in gross earnings and a 44.39% increase in net income for the first nine months of 2015 compared to the same period in 2014.
2) UBA's margins improved year-over-year, with net interest income margin rising from 54.86% to 58.32% and pre-tax profit margin increasing from 20.19% to 23.20%.
3) The analyst provides a positive recommendation on UBA, setting a fair value of N6.09 per share compared to the current price of N3.60, representing an undervaluation of 67.17% based on 2015 forecasts.
Transurban Group is an ASX-listed company that develops, operates, and maintains toll roads in Australia and the United States. It generates revenue primarily from a portfolio of toll road assets in Sydney, Melbourne, Brisbane, and Northern Virginia. Key highlights include strong dividend growth, consistent yields, and double-digit EBITDA growth. The company sees further growth opportunities from expanding its asset portfolio and implementing technological improvements to increase efficiencies.
Sustainable Infrastructure Assistance Program (46380-023)
TA 9511–INO: Indonesia Energy Sector Assessment and Priorities 2020–2024
Energy Policy Feedback (Power)
Focus Group Discussion
Jakarta, 18 October 2019
This document summarizes NTPC's financial results for the second quarter of FY2011. Key highlights include:
- Net sales grew 20.5% year-over-year to Rs. 13,350 crore, driven by higher power generation and realizations.
- Operating profit declined 8.5% to Rs. 3,371 crore due to higher fuel costs and other expenses.
- Reported net profit fell 2% to Rs. 2,107 crore due to higher provisions, but benefited from extraordinary income related to prior periods.
- The analyst maintains an "Accumulate" rating with a target price of Rs. 230, seeing continued growth from capacity additions but some pressure on margins.
Grupo Energía de Bogotá (GEB) reported its third quarter 2014 results and key developments. Some highlights include:
- GEB acquired a 31.92% stake in Transportadora de Gas Internacional (TGI) for USD 7.5 billion as part of its 2013-2017 investment plan.
- Several of GEB's expansion projects achieved milestones, such as environmental permits and progress on construction.
- Financially, GEB saw a 17.7% increase in operating revenues and a 14% increase in operating profit. Net income grew 19.4% compared to the prior year.
- Credit ratings agencies upgraded GEB's ratings during the quarter,
The document discusses Mytilineos' FY23 results which beat estimates due to stronger than expected performance from its Energy division. EBITDA and net earnings increased significantly year-over-year. While capex also increased, net debt remained manageable. This strengthened the analyst's conviction in Mytilineos' ability to continue growing profitability due to its vertically and horizontally integrated business model. As a result, the analyst raised near-term earnings estimates.
Telecom Egypt - Re-initiation of Coverage - March 2016Mohamed Marei
This document provides an initiation of coverage report on Telecom Egypt by Prime Investment Research. It assigns Telecom Egypt a "Buy" rating and calculates a fair value per share of EGP 11.56, implying 54% upside potential from the current market price. The report outlines three valuation scenarios for Telecom Egypt: a base case assuming continuation of current operations, and two alternative scenarios if Telecom Egypt is successful in obtaining a mobile license. All scenarios indicate that Telecom Egypt is undervalued and a "Buy".
Corporate Presentantion CPFL Energia June 2015CPFL RI
This document provides an overview of CPFL Energia's history and operations from 1997 to 2015. It discusses CPFL Energia's expansion through acquisitions and greenfield projects in distribution, generation, and renewable energy. It also summarizes the company's financial performance over time and highlights its ambitions going forward to maintain leadership in operating efficiency across its business segments.
This document provides performance and financial data for an algorithm company over several quarters and years, including sales, operating profit, net income, debt ratios, and stock prices. It also includes the algorithm's analysis of the company's stock price rise probability score compared to sector averages over time. The algorithm recommends a prospective purchase amount based on the current stock price and evaluation.
This document provides a performance analysis of an algorithm over a 3 month period from 2016-2019. It includes key financial metrics such as sales, operating profit, net income, operating rate, net rate, return on equity, debt ratio, and quick ratio on an annual and quarterly basis. It also evaluates the company's stock price against indication price ranges from low to high. Two sectors, A and B, are analyzed based on stock price rise probability scores and increase rates over time. The document concludes with a compliance notice regarding the use of the analysis.
Corporate Presentation - CPFL Energia - May 2015CPFL RI
This document provides an overview of CPFL Energia's history and operations from 1997 to 2015. It discusses CPFL Energia's expansion through acquisitions and greenfield projects in distribution, renewable generation, and competitive power supply. Key milestones include the company's IPO in 2004, diversification into renewable energy in 2011 through the acquisition of CPFL Renováveis, and continued growth in distributed generation and telecommunications services. Financial highlights show increasing revenues across business segments despite challenges in distribution profits. The presentation establishes CPFL Energia's ambition to strengthen its leadership position through efficiency gains and managing regulatory risks across power generation, distribution, and commercialization.
Similar to KENYA_POWER_VALUATION_REPORT_REVISED (20)
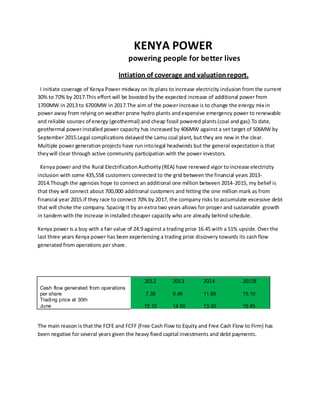
1. KENYA POWER
powering people for better lives
Intiation of coverage and valuationreport.
I initiate coverage of Kenya Power midway on its plans to increase electricity inclusion from the current
30% to 70% by 2017.This effort will be boosted by the expected increase of additional power from
1700MW in 2013 to 6700MW in 2017.The aim of the powerincrease is to change the energy mix in
power away from relying on weather prone hydro plants andexpensive emergency power to renewable
and reliable sources of energy (geothermal) and cheap fossil powered plants(coal and gas).To date,
geothermal powerinstalled power capacity has increased by 406MW against a set target of 506MW by
September 2015.Legal complications delayed the Lamu coal plant, but they are now in the clear.
Multiple power generation projects have runintolegal headwinds but the general expectation is that
theywill clear through active community participation with the power investors.
Kenya power and the Rural ElectrificationAuthority(REA) have renewed vigor toincrease electricity
inclusion with some 435,558 customers connected to the grid between the financial years 2013-
2014.Though the agencies hope to connect an additional one million between 2014-2015, my belief is
that they will connect about 700,000 additional customers and hitting the one million mark as from
financial year 2015.If they race to connect 70% by 2017, the company risks to accumulate excessive debt
that will choke the company. Spacing it by anextra two years allows for proper and sustainable growth
in tandem with the increase in installed cheaper capacity who are already behind schedule.
Kenya power is a buy with a fair value of 24.9 against a trading price 16.45 with a 51% upside. Over the
last three years Kenya power has been experiencing a trading price discovery towards its cashflow
generated from operations per share.
2012 2013 2014 2015E
Cash flow generated from operations
per share 7.38 9.46 11.89 15.10
Trading price at 30th
June 15.10 14.50 13.30 16.45
The main reason is that the FCFE and FCFF (Free Cash Flow to Equity and Free Cash Flow to Firm) has
been negative for several years given the heavy fixed capital investments and debt payments.
2. Below is a snapshot of a few historical metrics.
Note:
My definition (and the right definition for that matter) of EV is.
Enterprise value=Market value of equity at 30th
June+ market value of preferred stock at 30th
June+ book
value of debt as at 30th
June-Cash and cash equivalents as at 30th
June.
Kenya Power intends toincrease electricityinclusion from the current 30% to over 70% by 2017, a very
ambitious move.I opine that the most sustainable growth rate would be to achieve this target by 2019
Year Ending (June) 09A 10A 11A 12A 13A 14A
Ksh billion
Revenue 65.2 73.2 73.2 95.7 88.9 105.4
EBITDA 7.8 8.8 10.9 12.4 14.6 21.8
Operating Profit 5.7 5.9 7.1 7.8 8.9 15.0
Pre-Tax Profit 4.8 5.6 6.3 8.5 6.6 10.2
EPS (Ksh) 40.76 46.97 2.43 2.37 1.77 3.31
DPS (Ksh) 8.00 8.00 0.45 0.50 0.00 0.50
Revenue Growth % 59.82% 12.20% -0.02% 30.77% -7.06% 18.54%
EBITDA Growth % 48.5% 11.8% 24.8% 13.2% 17.8% 49.5%
Earnings Growth % 82.74% 15.23% 13.54% 6.40% 4.96% 58.01%
Operating Margin % 8.7% 8.1% 9.7% 8.2% 10.1% 14.2%
Net profit margin 4.9% 5.1% 5.8% 4.7% 5.3% 7.1%
Dividend Payout % 19.6 17.0 18.5 21.1 0.0 15.1
Return on Equity % 12.7% 13.4% 12.3% 11.2% 7.6% 12.7%
Return on Assets % 4.91% 4.75% 4.09% 3.49% 2.94% 3.68%
Gearing Ratio % 28.58% 29.88% 27.20% 38.53% 53.00% 53.95%
Capex Coverage 95.67% 92.44% 66.12% 49.69% 37.31% 72.56%
EBIT Coverage 6.44 9.37 18.43 6.82 6.46 6.41
P/CF 0.75 0.98 2.55 2.24 1.78 1.34
Price/Sales 0.18 0.22 0.51 0.31 0.32 0.25
EV/ EBITDA 4.88 5.02 4.77 4.56 5.59 4.11
P&L items as percentage of total assets
Revenue 91% 86% 60% 70% 48% 48%
EBITDA 11% 10% 9% 9% 8% 10%
Depreciation 3.0% 3.3% 3.2% 3.3% 3.0% 3.0%
Finance Costs 1.25% 0.37% 0.68% -0.51% 1.29% 2.18%
Pre-Tax Profit 6.68% 6.62% 5.16% 6.25% 3.57% 4.63%
Net Income 4.51% 4.37% 3.48% 3.30% 2.56% 3.38%
Source: Paul Maina
3. without compromising the financial health of the company. The company intends to invest an extra USD
1.3Bn to support the distribution of the extra capacity to the grid of which 70% will constitute debt.
70% electricity inclusionwould see the company have 6,812,989 customers.
2014 2019F
Kenya's Population 45,010,056 49,963,279
Number of house
holds 8,767,954 9,732,841
Number of domestic customers 2,481,450 6,812,989
Electricityinclusion 28.30% 70%
People per
household 5.13 5.13
KeyAssumptions.
a) Kenya’s population growth rate continues at the current 2.11%.
b) Population per household remains constant.
A key metric to forecast both FCFF and FCFE is the fixed capital investments (FCinv).To forecast capital
expenditures, I noticed a strong correlation between the amount of money invested in time T and the
growth of customer numbers in time T+1.Typically this is how Kenya Power works.After numerous
applications for connectivityin a given area, Kenya power extends the distribution to that area. The
numbers have to be sufficient to justify the extension. That is why there are cases of people who paid
for connectivity and remain pending for months. The plan to connect all schools hasled to heavy
investments and significant increase in customer numbers. Building and extending the network takes a
long time such that its effects are felt one year period later.
4. The FCinv at financial year T versus increase in customer numbers at T+1 is as follows.
Year 2010 2011 2012 2013 2014 2015E 2016E 2017E 2018E 2019E
FCinv/Customer
inc t+1 60 78 91 98 99 94 86 76 65 56
Fcinv (Mn) 26,511 26,949 30,742 33,550 35,453 36,713 37,706
In 2014, they spent Ksh 26,650Mn.My forecast stands at 26,949Mn, a margin of error of less than
1.2%.The expenditure per additional increase in customeris decreasing due toeconomies of scale,
transformer maximization and leverage of newer electricity distribution strategies. Convexity analysis of
FCinv and targetincrease in customer numbers is used to create the FCinv model.
2015E 2016E 2017E 2018E 2019E
CFO 23,431,150 28,389,021 34,395,945 38,685,948 42,941,402
Borrowings 12,928,233 15,312,199 18,135,768 21,480,004 25,440,916
Debt Repayments (8,303,795) (9,835,015) (11,648,592) (13,796,592) (16,340,684)
Fixed Capital Inv (30,741,823) (33,550,183) (35,452,856) (36,712,784) (37,706,122)
interest expense 2,462,640 2,916,751 3,454,600 4,091,628 4,846,124
- - - - -
FCFE (2,686,236) 316,022 5,430,264 9,656,575 14,335,513
- - - - -
(4,551,222) (4,995,622) (3,119,436) 1,361,308 4,837,303 8,627,567
Valuation as at 30 Sept 2015 (5,090,394) (2,948,429) 1,193,503 3,933,899 6,508,201
Discount Factor 1.0190 0.9452 0.8767 0.8132 0.7543
Terminal Value - - - - 96,565,298
FCFF 100,162,078
5. COST OF EQUITY NSE 20 Market Return WACC 7.81%
Equity Level 30.00% 30 June 2002 1,077.96
Risk free rate
(FXD1/2012/20YR) 12.92% 30 June 2015 4,906.07
Historical equity risk premium 2.86% Annual Return 12.36%
Beta 0.79
Bond
YTM2004 9.50%
CAPM E(R) 15.17%
CURRENT CAPITAL MIX
cost of equity 4.55% EQUITY 54,205,569 0.5050
COST OF DEBT DEBT 53,141,442 0.4950
Debt level 70.00%
Cost of Debt 6.64% TOTAL 107,347,011
After tax cost of Debt 3.25%
FCFF Value 100,162,078.18
Less Debt 53,141,442.00
Equity Value 47,020,636.18
Equity Value per share 24.10
Current Price 15.8
Upside 52.50%
FCFF forecast assumptions:
a) CFO will increase by 21% per annum over the next five years.
b) Debt will grow by USD 0.91Bn to support evacuation and distribution of additional electricity.
c) Electricityinclusionin the country will increase from 28% to 70% by 2019.
d) Annual debt repayments average 10% p.a
e) 1% terminal growth rate.
6. Alternatively,
Should investors continue to price the stock at CFO generated from operations per share then the five
year forecast would be
2012 2013 2014 2015E 2016E 2017E 2018E 2019E
CFO_gen 14,405 8,454 23,208 29,474 37,432 47,539 60,375 76,676
Operation costs 19,680 20,984 22,683 26,629 30,369 34,548 39,193 44,325
Bank overdraft est 4,628 6,580 4,229
Bank overdraft interest exp 1,110 1,669
Borrowings 27,762 51,079 70,110 83,037 116,485 137,965 157,106 163,406
interest expense 1,144 1,383 2,338 2,856 3,495 4,276 5,232 6,401
Cash flow generated per
share 7.38 9.46 11.89 15.10 19.18 24.36 30.94 39.29
Trading price at 30th June 15.1 14.5 13.3 18.35
2019 30th
June expected trading price range: Kshs 42.86-ksh 46
Conclusion
The next few years will be veryinteresting for Kenya Power. It has a lot of value lockedin it. From an
entrepreneurial stand point, KenyaPower meets the threshold of a good and potentially great company;
Home grown management, big hairy audacious goals, the power of alignment, a clear vision,
increasingly strong customerfocus among others.
RECOMMENDATION: BUY
Paul Maina: Head of research, Relic Capital.