1. 1
WELFARE PREFERENCE TESTING IN PIGS (SUS SCROFA) USING THE Y-
MAZE: PIG’S CHOICE BEHAVIOR FOR FOOD OR SOCAIL CONTACT UNDER
DIFFERENT FEED AND SOCIAL CONDITIONS
THESIS
Presented in Partial Fulfillment of the Requirements for
the Degree Master of Science in the Graduate School of
The Ohio State University
By
Kenneth J. Smith, B.S., B.A.
*****
The Ohio State University
2007
Thesis Committee:
Dr. Steven Moeller, Adviser
Dr. Paul Hemsworth
Dr. James Kinder
Dr. Naomi A Bothera
Please note that some parts of this thesis have been omitted from this version to simplify
readability. The published version of this thesis can be found at the library at The Ohio
State University. Its permalink is found at http://osu.worldcat.org/oclc/232956379.
2. 2
CHAPTER 1
INTRODUCTION
The concept of animal welfare is not a new one. The earliest exhortations on
welfare of animals, in the West, are found in Judeo-Christian scripture from God
pronouncing creation good (Gen 1:31) and God knowing of the fate of the sparrow (Matt.
10:27) to the injunctions such as not boiling a kid in its dam’s milk (Deut. 14:21). In the
West, until the nineteenth century the best-known philosophical research and writing
about animals and how to treat them come from Aristotle and St. Thomas Aquinas. St.
Thomas Aquinas is often used to illustrate the view, held by a majority of people in
present-day societies and by almost everyone in the past that humans have dominion over
the animals and can use them for human wants and needs (food, medicine, clothing,
companionship, etc.). St. Thomas also believed that one should not be cruel to animals,
because “it is evident that if a man practices a pitiful affection for animals, he is all the
more disposed to take pity on his fellow-men [emphasis added]: wherefore it is written
(Proverbs 12:10): ‘The just regardeth the lives of his beasts: but the bowels of the wicked
are cruel’ (Aquinas, Summa Theologica II, I, Q102 Art. VI.). Thus, Aquinas believes that
we must treat animals humanely for the sake of our own humanity, not because animals
4. 4
However, modern notions of animal welfare come from Jeremy Bentham in the
late eighteenth century, Peter Singer (1975) (utilitariansm), Tom Regan (1982) (animals
as moral beings), Roger Scruton (animal relationships with humans and piety), and
Bernard Rollins (ethos, an animal doing animal things) in the twentieth and twenty-first
centuries. While these philosophical tenets and the increasingly popular interest in
animal welfare in many countries (Appleby and Huges, 1997) have driven animal welfare
interests in modern times, they tend to be driven by philosophical tenets such as
suffering, animal wants, desires, and feelings and sympathy for animals, and are not as
dependant on scientific definitions of suffering, pain, or the relation of human perceptions
to animal needs and desires. The science of animal welfare is eclipsed in the public mind
by emotional appeals made by well-funded and radical groups. People for the Ethical
Treatment of Animals (PETA) use statements such as, “All animals have the ability to
suffer in the same way and to the same degree that humans do. They feel pain, pleasure,
fear, frustration, loneliness, and motherly love” (PETA, 2007). This type of activism
affects perception and acceptance of scientific study in welfare research, even while one
of the main purposes of the research is to allay public fears about treatment and care of
animals. A lack of clear agreement on the definition and methods of assessing animal
welfare has caused a greater interest in scientific study in this area of research.
5. 5
CHAPTER 2
SOW HOUSING: AN EXAMPLE OF THE COMPLICATED STUDY OF WELFARE
Housing or the sow is presently of great concern in the field of modern animal
welfare science. Of particular interest is the comparison between stall-housing and group
housing in the maintenance of sows. The use of stalls in production systems began
approximately 26 years ago (Alberta Department of Agriculture, Food and Rural
Development, 2005). Prior to stall housing, most sows were housed in groups.
According to John Barnett (personal communication February 23, 2006) the movement to
stalls was for two reasons: (1) to prevent the wasting of feed, with some suggesting as
much as 20% feed loss in groups, and (2) to reduce aggression in the sows toward other
sows and caretakers. Over the last two and a half decades, in many parts of the world,
the use of stalls has become widespread. However, the use of stalls is controversial, in
both the agricultural industry and the general population. Many in the general population
balk at the idea of housing a sow in a crate where it is not possible for it to turn around.
The sow’s inability to turn around is thought to be cruel, and this idea has been absorbed
into the larger debate of animal welfare as championed by Peter Singer and Tom Regan
(See Animal Liberation by Singer and The Case for Animal Rights by Regan). Roger
6. 6
Scruton’s (2000) conception of piety, by which a person knows from within himself that
housing sows in stalls is intrinsically wrong, is yet another idea that has been used to
describe why the general population believes that housing sows in stalls is cruel. The
concept of cruelty has led to some government bans on the use of stalls; including in
Great Britain, the European Union by 2013 (Alberta Department of Agriculture, Food
and Rural Development, 2005) and in US states such as Florida, Arizona and
Washington. Even Smithfield Foods Inc., the largest pork producer in the world, has
decided to phase out the use of gestation stalls under pressure from animal rights
activists such as the People for the Ethical Treatment of Animals (Wall Street Journal,
2007). There are many issues involved in defining the welfare of sows housed in stalls
and the major issues surrounding stall-housing are described in subsequent sections.
FRUSTRATION
Frustration in animals is a major topic of debate in the field of sow housing
research. According to Broom and Johnson (2000):
If the levels of most of the causal factors which promote a behavior are high
enough for the occurrence of the behavior to be very likely but, because of the
absence of a key stimulus or the presence of some physical or social barrier, the
behavior cannot occur, the animal is said to be frustrated...If under these
circumstances, a response cannot be completed, the animal may direct its
energies into another activity, not uncommonly into aggression against nearby
animals.
All or some kinds of stalls may produce a physical or social barrier. Broom and
Johnson (2000) further state that frustration may also lead to the development of
7. 7
stereotypes and many of the sow stall-housing problems (stereotypes, aggression, etc.).
GENETICS AND AGGRESSION
Aggression in sow housing is a major cause of poor animal welfare. Neonatal
environment of a developing animal may have an affect on aggressive behavior later in
life. Olsson et al. (1999) showed aggression, especially in sows inflicting damage to
establish a clear social hierarchy, could be related the post-natal development of the
sow. Olsson et al. (1999) also reported that aggression may be affected by the richness
of the environment in which sows are housed. Furthermore, Hessing (1993) has
suggested that behavioral characteristics in pigs can be determined in the first few
weeks of life. If this is true, it may be possible to develop a simple behavioral test to
determine if a pig is aggressive and perhaps assign the pig to a specific group according
to the level of aggressiveness. McGlone (1991) has suggested selection of breeding
females based on aggression level, and suggests choosing those who are less aggressive
may reduce aggressiveness in sows. However, it has not been substantiated that either
an individual pig’s predisposition to violence or identification of which pigs tend to be
more violent, can be conclusively be determined, as Puppe (1998) showed that
aggressive interactions between familiar pigs and non-familiar pigs were not related to
their genetic composition when pigs were compared in pairs. This finding lies contrary
to the assumption that pigs would be less violent to another pig of close genetic
relationship.
Some chemical and odor treatments did not affect fighting in sows (Luescher et
al. 1990). The lack of an experimental chemical stimulus may mean that fighting is
primarily a tactile and visual activity, and therefore, strategies to combat fighting may
8. 8
have to involve tactile and vision-assessment parameters. Social rank can also be a
cause of aggression in pigs. According to Drews (1993), “Dominance is the attribute of
the pattern of repeated, agonistic interaction between two individuals, characterized by
a constant outcome in favor of the same dyad member and a default yielding of its’
opponent rather than escalation.” Antagonistic interactions between pigs have shown to
be affected by social rank (Otten et al., 1997). It has also been shown, in dyad testing,
that it is usually very easy to identify the winner in an aggressive interaction of the
dyad. By assessing all the dyad possibilities, one can determine to a very high degree
of certainty which animals are dominant and which are submissive (Otten et al., 1997).
Boars also have a marked dominance over sows, so much so that Karlen (2005)
suggests that placing a vasectomised boar in with sows housed in groups may reduce
the level of aggression in the sows because the boar is a clearly dominant figure.
Research has also shown that the vast majority of interactions among sows occur early
after the initial mixing of the unknown animals (Kay et al. 1999). Furthermore, weight
differences may not be an indicator of dominance, as Jensen and Yngvsson (1998)
reported that different weights of pig did not affected neither the amount of fighting nor
the duration of fighting. Jensen and Yngvsson also reported that pre-exposure of
unfamiliar sows as pairs prior to mixing in large groups resulted in a modification of the
severity and the amount of fighting. These findings support the theory that pre-
exposure has a positive impact on reducing aggression.
AGGRESSION RELATED TO HOUSING
A prominent aspect of sow housing that affects welfare is housing design. Pigs
housed in two different stalls, those with vertical or horizontal bars, vary greatly in
9. 9
number of aggressive interactions and retaliations (Barnett et al. 1989). The sows with
horizontal bars had many more aggressive interactions than those with vertical bars.
This result was believed to be caused by those pigs’ inability to “slash” in the normal
way, in the stall with vertical bars, which is the way pigs fight. Pigs housed in stalls
with horizontal bars throughout the stall also showed evidence of chronic stress, while
pigs housed in stalls with vertical bars showed less stress, similar to that of group-
housed pigs (Barnett et al. 1991). Barnett et al. (1989) also showed group-housed sows
show had a greater incidence of decisive aggressive interactions. Stall-housed sows
also had greater level of chronic aggression toward their neighbors; however, stall
modification (in this case adding mesh to an identical pen type so that it is more
difficult for a pig to exhibit aggressive interactions to its neighbor), reduced these types
of interactions, changing radically the animal welfare considerations. Barnett’s (1992)
research suggests that when mixing new groups of unacquainted sows, aggression may
be reduced by use of partial stalls within the group housing system.
In group housing, the floor space and size of the group can be of concern when
assessing welfare. Floor space is related to aggression. Weng et al. (1998) showed that
the frequency of social interactions and aggressive behavior increases with decreased
space allowance. The same study showed that aggression with bites doubled at 2
m2
/sow space when compared to 2.4 m2
/sow. Also, aggression may be affected by size
and shape of pens. Barnett (1992) suggests that pigs kept in rectangular pens with about
1.4 m2
of space may be less stressed than those in square pens, even pens with more
space per pig. Broom et al. (1995) has reported that sows in larger pens have fewer
but more intense aggressive interactions that are more decisive in outcome, while sows
10. 10
in smaller pens exhibited more (in number) antagonistic interactions with fewer
decisive outcomes. Continued research is needed from both a scientific and practical
commercial perspective, as neither the U.S. Pork Board nor the Australian Code of
Practice has clear recommendations for space required for sows in groups, to determine
optimal stocking density.
AGGRESSION AND RESOURCE AVAILABILITY
Placement of resources (feed, water, etc.) can be a factor that influences the
level of aggression in a group-housing situation. It has been reported that 74% to 93%
of aggression is resource-related (Ewbank and Bryant, 1973 cited in Baxter, 1985).
Group housing studies with sows indicate that aggression is often localized around food
(Broom et al. 1995). Another study, using a foraging mechanism (the Edinburgh
Foodball), reported that pigs budget their time differently if given something to do or a
reward to reach, though individual pigs may budget time in different ways (Young and
Lawrence, 1996). This data suggests that if a pig has to work to achieve food, it may
budget less time to engage in aggressive actions. Karlen (2005) reasoned that providing
straw would lessen the time pigs would engage in aggressive interactions. However,
Arey and Franklin (1995) found in growing pigs that provision of straw did not
significantly reduce the amount or length of time devoted to fighting. Familiar pigs also
showed the same amount of antagonistic interactions as non-familiar pigs during
feeding, in a study that compared pigs mixed in pairs (Puppe, 1998). Puppe (1998) also
reported that genetic relatedness of the pigs did not affect the amount of antagonistic
interactions at the feeding area. In boars, it has been shown that random feeding leads
to chronic stress, while boars fed on a fixed, predictable schedule adjusted very quickly
11. 11
to feeding (Barnett and Taylor, 1997). Thus, outside effects (such as a predictable
feeding time) could have marked effects on the frequency and severity of aggressive
interactions. These findings may lead to changes in animal feeding schedules as a
method of improving welfare in the pig.
A PIG’S PREFERENCE
However, there is another question in sow housing: What does the sow prefer?
Kirkden and Pajor (2006) used operant testing to assess the sow’s preference for
additional food or access to group housing. They used 96 stall-enclosed sows
throughout gestation and compared the sow’s motivation for a small amount of food
(1/16 of daily ad libitum intake, after the sow had been fed 15/16ths of ad libitum),
compared to the sow’s motivation to gain access to subordinate, familiar sows for a day
in a group. Pajor used operant testing (much like a Skinner box; see section 2.4) where
a sow had to press a panel to receive the resources, food or social contact. To test the
sows’ motivation (how hard the sow was willing to “work” for access to either), the
number of times the sow had to press the panel was increased slowly over a number of
weeks until the sow stopped the behavior. Operant use ranged from 10 to 100 presses
of the panel to achieve a resource. Pajor than reported that sows attached no more
importance to access to the social contact than to the last 1/16 of daily feed intake.
Further, it was reported that dominant, stall-housed sows were only weakly motivated to
social contact. This experiment may suggest that the sow may not place much value on
group housing, a counter-intuitive idea to many people. In addition, the study
demonstrates that welfare testing is complex and what the sow prefers is not necessarily
what the public thinks the sow wants. In Pajor’s, mind sow-housing research should be
12. 12
carried out to “determine how to maximize comfort and minimize suffering” (AVMA,
2004).
As one can see from the short example of sow-housing welfare, considerations
are complex. If aggression is a problem for sow welfare, what type of aggression is the
worst--or is all aggression bad? How are we to stop aggression if it is related to several
different factors? And of utmost importance, will the general public accept scientific
data suggesting that sows prefer one system to the other? These are serious questions,
and science must be used to help provide answers that will keep agriculture viable in the
developed world.
13. 13
CHAPTER 3
REVIEW OF LITERATURE
It is generally concluded within the scientific community that there is no single
measure that explains a significant amount of the variation in an animal’s welfare
(Dawkins, 2003). Mechanisms that evolved to help an animal in the wild could be
assumed causes of poor welfare, especially in human-designed situations (Dawkins,
2001). The following strategies: the Five Freedoms, biological and physiological
testing, nature of the species and preference testing are examples of attempts by humans
to measure animal welfare.
FIVE FREEDOMS
One form of broad assessment of animal welfare has been proposed by the U.K.
Farm Animal Welfare Council in its Five Freedoms approach. These freedoms are:
1. Freedom from hunger and thirst by ready access to fresh water and a diet to
maintain full health and vigor.
2. Freedom from discomfort by providing an appropriate environment including
shelter and a comfortable resting area.
3. Freedom from pain, injury and disease by prevention or rapid diagnosis and
treatment.
14. 14
4. Freedom to express normal behavior by providing sufficient space, proper
facilities and company of the animal’s own kind.
5. Freedom from fear and distress by ensuring conditions and treatment that avoid
mental suffering. (Farm Animal Welfare Council, 1996)
While most authors agree with the underlying ethics of these principles, the definitions of
some of these principles are vague (Karlen, 2005). The least defined of these principles
is the freedom to express natural behavior. Ignoring the fact that company of the
animal’s own kind applies only to social animals, some natural behaviors, such as combat
in pigs, may be maladaptive in modern farming techniques. Also, because domestic
animals differ greatly from their wild ancestors, what may be natural for them may not be
the same as for their wild counterparts. In fact, the Farm Animal Welfare Council (1996)
itself considers the five freedoms to be ideal states, but currently there are no
standardized methods for assessing these states. While the principles behind the Five
Freedoms may be of ethical use, the lack of definition and their universality do not lend
easily to scientific observation.
NATURE OF THE SPECIES
Nature of the species is an approach in which an animal is detrimented to have a
good state of welfare if it is allowed to act as it would in the wild. This type of approach
is very popular with animal rights organizations (Karlen, 2005). However, this approach
has serious limitations as pointed out by Johnston (2004):
The “nature of the species” approach is intuitively nice, however whilst this
natural behavior approach has probably been the longest standing method, there
are some areas where it has not developed as fully as it perhaps should have. It is
15. 15
now recognized that some of the “natural” behaviors are in fact adaptations to
cope with what is effectively a very harsh environment. So, how necessary are
some of these behaviors when considering the domesticated situation? The
natural behaviors have not been consistently defined, and more importantly, no
work has shown what welfare risk is associated with not performing some of the
behaviors.
Once again a lack of definition limits this approach. If we were to free farm animals,
placing them back into their natural habitat, their welfare in the short term would
certainly be affected. Also, who is to say that the “unnatural” situation the animal finds
itself in is not one where the animal has an enhanced state of welfare or that this is what
the animal prefers? Thorpe (1965, cited in Fraser and Mathews, 1997) offered an
observation. To paraphrase, ‘in the process of relocating some African buffalo in Kenya
in 1964, the animals were captured and placed into pens and treated much like domestic
cattle. After their transport and release in a new area, they tried to go back into the
paddocks they were housed in at night. In the short term this could simply be caused by
familiarity with the housing system. It could also be speculated that the buffalo preferred
the restricted and well-fed surrounding of the paddocks than to the wild.’ So from this
and other anecdotal evidence, animals may well prefer the farming situation to the wild.
BIOLOGICAL AND PHYSIOLOGICAL TESTING
Broom (1988) refers to welfare of an individual as its state as it attempts to cope
with its environment or maintain homeostasis. Using this definition, Barnett and
Hemsworth (2003) state:
In this definition, the “state as regards attempts to cope” refers to both how much
16. 16
has to be done by the animal in order to cope with the environment and the extent
to which the animal’s coping attempts are succeeding. Attempts to cope include
the functioning of body repair systems, immunological defenses, physiological
stress responses and a variety of behavioral responses. The extent to which coping
attempts are succeeding refers to the lack of biological costs to the animal such as
deterioration in growth efficiency, reproduction, health and freedom from injury.
Therefore, using such a definition, the risks to the welfare of an animal by an
environmental challenge can be assessed at two levels: firstly the magnitude of
the behavioral and physiological responses and secondly the biological or fitness
costs of these responses.
Some consider biological testing as the most obvious and universally accepted measure
of animal welfare (Dawkins, 2003). In much of the literature, stress is considered the
main detriment to welfare. During stress, changes can occur in plasma concentrates of
hormones including glucocorticosteroids, vasopressin catecholamine and others (Terlouw
et al., 1997). Chronic stress can also have damaging effects on the individual and lead to
disease, failure to reproduce or failure to develop in a normal fashion (Moberg, 1985).
Another test of biological functioning is stereotypes. Stereotypes are repetitive,
relatively invariant behaviors with no obvious function. Stereotypes may develop as a
consequence of boredom, restraint, or a frustration of feeding motivation (Fraser 1975,
Cronin 1985, Lawrence and Terlouw 1993 as cited in Barnett et al. 2001). Stereotypic
behavior may be a coping mechanism used in the short term, though long-term effects are
unknown (Barnett et al., 2001). Some studies suggest that stereotypes may be related to
neurobiology, the brain trying to cope with a stressful situation by changing its chemistry
17. 17
(Loijens et al. 2002, Cronin et al. 1985) or releasing endorphins (Cronin et al. 1985) in
response to performing stereotypes. If this is the case, stereotypes come about because of
the brain’s attempt to deal with stress using neurotransmitters and hormones. Some
hormones have also been shown to have a calming effect on animals, notably
progesterone in mammals (Kohlert and Meisel, 2001). Stereotypes may also be
physically damaging, as in the case of sows rubbing their tails on the back of the stall
(Barnett et al., 2001), or in grower pigs in the case of tail-biting. Stereotypes may also
cause permanent changes in the brain (Cronin et al. 1985). However, in general,
stereotypes are seen as an indicator of welfare states as a function of an animal not having
enough environmental stimulation (Barnett et al., 2001).
Briefly the SAM axis is a neural (neuroendocrine) response whereby the nervous
system regulates the release of adrenalin and noradrenalin from the adrenal medulla that is
part of the autonomic nervous system. The HPA involves a cascade of hormones
functioning to aid the release of corticosteroids from the adrenal glands and is regulated at
the level of the hypothalamus and pituitary gland. Corticotrophin releasing factor (CRF) is
released from the hypothalamus in response to a stressor that may be internal or external
and mental or physical in origin, and in turn the presence of a stressor stimulates the
secretion of adrenocorticotrophic hormone (ACTH) from the pituitary gland. ACTH is
transported in the blood to the adrenal glands where it regulates the synthesis and release of
corticosteroids, predominantly cortisol and corticosterone, depending on the species. There
is a negative feedback mechanism at the control of the pituitary and hypothalamus with
cortisol feeding back on the pituitary to control the release of ACTH and both cortisol and
ACTH feeding back on the hypothalamus to control the release of CRF (Carrasco and Kar,
18. 18
2003).
Hormones secreted from the HPA axis have broad, long-lasting effects on the
body and presents challenges to homeostasis that result in long-lasting neuroendocrine
responses which clearly have implications for animal welfare. While some component of
behavior is likely to be involved in every stress response, behavioral responses may not
be appropriate or effective for all situations. Indeed, long-term behavioral responses, as
with long-term neuroendrocrine responses, may indicate difficult or inadequate
adaptation. For example, the lack of resource such as a nutrient requirement or a situation
in which the animal is highly motivated but is unable to perform an appropriate
behavioral response may lead to either redirected behavior or stereotypes and may be
associated with physiological responses indicative of a chronic stress response as well as
direct biological costs such as injury (Broom and Johnson, 1993). It is in this way, many
conclude, that inadequate adaptation will generate welfare problems for animals.
Gender may also have a role in stress effects, because after isolation, the
amplitude of the peak concentrations of cortisol is greater in castrates, but not in gilts,
and has been further observed to be influenced by age and time of the stressor (Ruis et. al
1997). These data suggest stress may affect pigs of different genders and ages in
different ways and may affect the usefulness of cortisol (and perhaps other hormonal
indicators or immunological measures) for the scientific assessment of welfare states.
Hormonal measures can be so variable that Hicks et al. (1998) suggested that behavioral
changes during acute stress might be the most constant and reliable indicators of stress,
compared with immunological and blood measures.
19. 19
FEELING-BASED APPROACH
Feeling-based approaches define animal welfare by how the animal feels or what
emotions the animal has (Duncan and Fraser, 1997). Many believe that feelings are
primitive bases for conscious experience, though the animals may not be aware of what
emotions mean or what is happening to them mentally and physically (Karlen, 2005).
However, Bolles (1981) points out that “Emotions are not the basic source of animal
behavior, but more like the occasional disruptors of behavior.” Subjective emotional
states are often linked to visceral and/or bodily arousal linked to emotional cognitive
processes (Bolles, 1981). Feeling-based testing also promotes the reduction of negative
feelings and/or the promotion of feelings that are positive (Duncan and Fraser, 1997).
The feeling-based approach also suffers from the lack of clear definition. Barnett and
Hemsworth (2003) point out that emotion may reflect different patterns of arousal and the
bodily reactions to many emotions remain fairly constant. They go on to point out that
“Most animals react physiologically in essentially the same way whether the arousal is
sexual, fear provoking or if there is the anticipation of play or food” (Barnett and
Hemsworth, 2003). Certainly the lack of agreement on the biological measures of
emotions and the ability to delineate these from one another in animals are a detriment to
purely feelings based research.
One method of combating the similarities of the animal emotions has been
aversion testing. Aversion testing to a certain stimulus may be the most direct index of
short-term suffering (Rushen and de Passille, 1992). Aversion testing is used extensively
with rodents while, in contrast, its use in farm animal welfare is currently limited.
Rushen (1996) states that aversion testing is easier to interpret than both behavioral and
20. 20
physiological testing.
Electro-immobilization causes an acute stress response in sheep and cattle. In
sheep, plasma cortisol concentrations increased 5-times basal concentrations to a peak at
10 min post-electro-immobilization (44 mA for 2 minutes) while plasma β-endorphin/β-
lipoprotein increased about 4-times basal concentrations to a peak at 4 min post-electro-
immobilization (Jephcott et al., 1986).
Behavioral studies of aversiveness indicate that electro-immobilization is
probably equivalent to other handling procedures. Rushen and Congdon (1986) found
that simulated shearing together with electro-immobilization (current of 30-45 mA for
45-60 s) was more aversive than either electro-immobilization or simulated shearing
alone, while electro-immobilization and simulated shearing were of similar aversiveness.
Rushen and Congdon (1986) tested the preference of 12 sheep for partial shearing or
electro-immobilization in a Y-maze. No strong preference was exhibited, although there
was a bias by nine sheep towards the choice of being shorn, while three sheep were
indifferent.. Grandin et al. (1986) demonstrated that electro-immobilization (10-200mA
for 5 s) was more aversive than restraint in a squeeze-tilt table for pregnant Suffolk ewes.
Raj and Gregory (1995) used aversion testing to determine the pig’s aversion to
argon and carbon dioxide, which are used in stunning before meat harvesting in the
abattoir. Raj and Gregory reported that a pig would readily enter a chamber with 90%
argon and the majority of pigs would enter a 30% carbon dioxide for a reward (apples).
But, a majority of pigs would not enter a chamber of 90% carbon dioxide even after a 24
hour fast. Aversion testing has also been used in sheep in reference to electro-
immobilization (Grandin et al., 1986). Aversion testing is limited in that the animals
21. 21
involved in the treatment must learn about the treatment and its results and thus the
results are confounded by the learning and cognitive component (Rushen, 1996). Not
strictly addressed in the literature is whether it is ethical to expose animals to potentially
aversive situations.
Another test used to analyze animal emotions is operant testing. Operant testing
involves much effort an animal will work for a reward or to escape a punishment. This
type of test usually has an operandum that the animal can operate. Reinforcement are
used that will encourage use of the operandum (such as food pellets or Fruit Loops®) and
will be linked by signals that show the location and timing of the reinforcers. For
example, a rat may see a red light which means that a lever in the cage can be pressed to
receive a food pellet (or stop a shock, or gain access to an estrous female, or any manner
of combinations) (Dunnett and Brasted, 2001). The most famous of operant test
procedure is the Skinner Box, used primarily with rodents (Skinner, 1938), which
continues to be used with primates. A Skinner Box is a chamber that is used to conduct
operant conditioning research with animals. Within the chamber, there is usually a lever
(for rats) or a key (for pigeons) that an individual animal can operate to obtain a resource
within the chamber as a reinforcer. The chamber is connected to equipment that records
the animal's lever-pressing or key-pecking, allowing a pattern of behavior to be recorded.
This type of chamber can be modified to dispense food (or drugs or sexual contact, etc.)
for a set number of bar presses with the assumption being the more willing an animal is
to press the bar (the amount of “work”), the more the animal wants the resource linked to
the bar-pressing. This type of evaluation was conducted by Kirkden and Pajor (2006) in
the sow’s preference for group housing or feed reported previously in this manuscript.
22. 22
Of special interest to the research being conducted in the research being presented
in this manuscript are the tests of Matthews and Ladewig (1994) and Pedersen et al.
(2002). Matthews and Ladewig used operant testing to determine the amount of effort
which a 12-week-old male castrated pig (in a 1.7 x 1.45 x 1.15 m testing chamber) would
work to obtain access to feed (27 g of pellets) or social contact (for 15 sec, with a pig in a
160 x 40 x 120 cm crate separated by vertical bars). The pigs could also work simply to
open the door between them and a pen in which a stimulus pig would be housed. The pig
had to press on a nose plate to receive access to the resources. The number of presses
necessary to receive the stimulus was 1 to 30. The researchers reported (see Figure A.1)
that work for food was less elastic (nearly completely inelastic) than the effort made for
social contact (see Figure A.1). In other words, the pig had a much greater drive for food
than for social contact as a function of the amount of work the animal had to do, or the
animal preferred food to social contact. In a similar study, Pedersen et al. (2002) reported
that social isolation had an effect on demand curves for food and straw. Isolation made
the demand curves steeper: pigs would not work as hard for feed when in isolation as
when tested with a companion pig. Demand for straw was unaffected when the pig was
tested in isolation.
The final test of animal emotions or need is the preference test. Preference testing
involves having an animal choose between two resources to determine which it prefers.
By investigating these motivational mechanisms (which of two resources an animal
prefers) it may be possible to learn something about an animal’s important needs (Broom
and Johnson, 1993). Barnett and Hemsworth (2003) have noted that the preference of
animals for resources can be studied by allowing the animal to make a choice between
23. 23
two resources. Fraser and Matthews (1997) state that this type of testing has been used
since the early 1970s, and while this seems to be true in farm animals, the actual use of
preference testing (as an animal’s preference between resources) has been used in rodents
to a great extent since the 1920s and perhaps as early as about 1900 (see Tolman, 1948
and Wozniak, 1997). However, this may be referred to as learning or latent learning. To
use preference testing, three issues need to be addressed, as pointed out by Fraser and
Matthews (1997):
1. The tests must adequately reflect the animal’s preferences. Animals’
preferences may change due to time of day, age, gender, and other influences
[over simplicity]. Therefore, preference tests must be comprehensive enough
to identify the confounding effects associated with the preference.
2. The results must be interpretable in terms of how much an animal prefers a
resource so that welfare inferences can be made. To this end, many types of
methods have been proposed to measure strength of preference.
3. Environments preferred by the animal will often, but not always, promote
psychological welfare. However, preferences may not reflect welfare because
the choices lie outside the animal’s sensory, cognitive and affective capacities.
A model for the testing of preference between two resources is the Y-maze and the
closely related T-maze. The T- and Y-mazes are similar, consisting of three arms that are
configured in either a T or Y pattern, usually equal in length. The Y-maze maze is in the
shape of a Y where the animal is started in the lower single stem of the Y. The choice
resources are placed in the two forks of the Y. After a training period, the test animal
associates one side with one resource. The animal is then allowed to choose between the
24. 24
resources. The major difference between the Y- and T-maze is that the animal maintains
visual contact with the resources in the Y-maze at all times. The creation of the Y-maze
can be traced to Linus W. Kline and Willard S. Small around 1898 (Wozniak, 1997). The
Y-maze continues to be used in modern physiology research, especially in drug research (
Medvedev et al., 1998).
One of the earliest and simplest examples of a Y-maze being used to determine
preference between resources is reported by Spence and Lippitt (cited in Tolman, 1948).
This experiment was used to test cognitive mapping in rats, but the tests were conducted
by using preference testing. The Y-maze used by Spence and Lippitt had water and food
in the arms of the Y-maze. The rats were first allowed to explore the maze and, when
they reached the end of either arm, were rewarded by being placed back in their home
cages. After a period of time the rats were then food- or water-restricted. Spence and
Lippitt showed that the hungry rats more frequently went down the arm with food, while
the thirsty rats more frequently went down the arm with the water resource. Though not
strictly testing for preferences, the rats showed preference for the resource from which
they were deprived.
Dember and Richman (1989) concluded that there are four possible paths in the
maze:
1. The animal will alternate choice, or the previous resource chosen will not be
the one chosen in the next trial.
2. The animal will choose one resource more often than the other.
3. The animal will choose randomly.
4. The animal will not make a choice.
25. 25
The first possibility is referred to as Spontaneous Alteration Behavior and is a robust
phenomenon in rats (Dember and Richman, 1989) and other rodents (Hughes, 1989).
Another phenomenon seen in rats is Vicarious Trial and Error (Munzinger, 1938) where
rats hesitate and exhibit “looking-back-and-forth” behavior before choosing a path. It is
not known whether this type of behavior is found outside of rodents. It is also important
to note that there are several variations on these mazes including the X-maze (4 equal
arms radiating out from central point, in which the start box lies at the crossing of the
arms) (Vincent, 1915), and the multiple T-maze (a maze in which many T mazes are
linked together) (Tolman, 1948). The general idea is that the animal, after a short
training, will be able to identify resources in the arms of the maze and than choose one
resource over others. This shows the animal’s preference, or what the animal “likes”
more.
The Y-maze has had an amazingly versatile use. In the literature, the maze
testing has been used in insects, birds, reptiles, and mammals. Let us start with the most
intuitive method of preference, that of pain avoidance. Anisman et al. (1980) used the Y-
maze in assessing the escape behavior of mice in the Y-maze when exposed to electric
shock. Previously, it had been reported that rats under inescapable shock eventually
stopped trying to escape (see Anisman et al., 1980). The test was designed to determine
if the mice would escape from shock if given an escape route (always by turning right)
when compared with non-shocked animals. Anisman et al. reported that the non-
shocked mice did attempt to escape 100% of the trials, while the shocked mice failed to
attempt to escape 60% of the time and their performance (the percentage of time they
tried to escape) deteriorated over the successive sessions. This study seems to suggest
26. 26
that the Y-maze might not be a useful tool for determining the mouse’s preference for
avoiding pain. It certainly seems reasonable that mice would prefer not to be shocked
and that pain could elicit a stress response. Jackson et al. (1980) reported similar
results, with the shocked mice making more mistakes than the non-shocked animals.
They also reported that increasing the incidence of shock did not improve the error rate of
the shocked mice but it did show an increase in the speed of response. The results of
these studies may indicate a deficit in learning due to the stress caused by the electric
shock and not a defect in the ability for the mice to choose what they prefer. These
studies do indicate that outside influences other than that of preference can have a large
effect on the outcome. The mice, from an intuitive human perspective, should have
always tried to escape. Use of the Y-maze therefore may be too complicated to learn
accurately about preference in mice that are under stress.
If an animal can learn what resources are in the Y-maze and can associate
resources with another stimulus, the usefulness of Y-maze testing as a method for
preference testing can be supported. An interesting study by Hagen and Broom (2003)
seems to suggest that an animal can learn the Y-maze by associating two stimuli together.
In this experiment, six heifers were exposed to two different heifers at the end of the Y-
maze. When one of the heifers (the reward heifer) was chosen, the test subject would be
given a food reward. After five trials, the test subjects always chose the animal
associated with the food reward even when the side in which the reward animal placed
was randomized between the Y-maze arms. Hagen and Broom concluded that the
findings demonstrate that cows can distinguish between other cows and even that head
orientation was more important than body conformation in identifying the reward heifer.
27. 27
The test was actually used to determine if cows could recognize other cows, but a large
assumption was made. It was assumed that the heifer would go to the animal with the
food associated with the reward, and not merely because that heifer might prefer one
heifer to another. If the test had failed to show that the animal chose the food reward
heifer consistently, one could assume that the test assumptions were incorrect. However,
because the heifers were very consistent in choosing the reward heifer, the researchers
can infer that the animal preferred feed to the stimulation of either heifer. This
reasonable inference seems to demonstrate, at least in cattle, that the animal does make
preference choices. If our inference is correct, any stimulus could be used to provide
cues for the heifer to identify where the food was, and it can be assumed that the heifer
would choose the food stimulus (assuming it was not a negative stimulus).
Y-maze and T-maze testing have been used in many species of farm animals.
Dawkins (1977) used a T-maze to determine whether chickens preferred cages or outdoor
pens. Grandin et al. (1986) used the T-maze to examine pregnant ewes’ preference
between two shearing restraints.. In swine, it has been used in assessing the preference of
odor in piglets (Marrow-Tesch and McGlone, 1990), recognition of people (Koba and
Tanida, 2001), and recognition of conspecies (Kristensen et al., 2001). The T-maze has
been also used in swine to determine the preferences of flavors and food intake in
weanling pigs (McLaughlin et al., 1983), to determine if estrogen can defeminize the
behavior of pigs and whether late defeminization is an organizing effect by testing
perceptivity in the T-maze (Adkins-Regan et al., 1989). It has also been used to study
individual pig coping mechanisms, using rearing conditions and behavioral flexibility in
piglets (Bolhuis et al., 2004). Pajor et al. (2003) tested the choice of handling treatment
28. 28
in dairy cattle and reported that cows preferred feeding to nothing, feeding over gentling
(talking to the cow in a gentle voice and stroking it), and gentling over being yelled at in
an aggressive manner.
However, the use of the Y-maze for animal welfare assessment has been
criticized. Dawkins (1983) gives an excellent review of the objections; however, only
one directly affected Y-maze testing. To the objection, “the preference doesn’t mean
suffering,” Dawkins asserts that the only way to address this issue effectively is to
measure the amount of preference the animal has for a resource. With this assumption,
Dawkins (1983) believes that the only way forward is to apply economic theory to the
research and to use operant testing functionally, because it will tell how diligently the
animal will work and be used to than determine whether or not a resource is
economically elastic or inelastic. Elastic and inelastic refer to how much a resource is
wanted, whether it is a luxury or a necessity. Dawkins, however, uses an example of
herring being elastic and coffee being inelastic, although both are unnecessary to
maintain life, health, and vigor). The reason that this is a criticism of the Y-maze is that
the maze does not strictly measure how much an animal prefers a resource. However, the
Y-maze does in fact measure amount of preference, by comparing how often an animal
will choose one resource over the other. We measure relative choice and interpret this in
terms of preference. By comparing choice of resources in the maze one can determine
the amount of relative preference, perhaps even more effectively than by an animal’s
being made to “work” for a resource. According Matthews and Ladewig (1994), “There
are several major difficulties with the interpretation of the results of these tests
[preference testing, including Y-maze testing]… A major problem…is the interaction
29. 29
between preference and amount of effort required in making a choice”.
Others have also criticized preference testing. As Yerkes (1903) pointed out, “An
animal responds to a situation, not any one independent and isolated stimulus. Every
situation, to be sure may be analyzed into its component simple stimuli, but the influence
of each is conditioned by the situation.” In other words, the researchers must look at the
whole situation in using these maze tests to make sure what is being studied is not
influenced by confounding effects. Duncan (1978) argued that what the animal may
prefer is not always best for its welfare. The classic example of this can be observed
when assessing drug addiction: an animal will prefer drugs to any other resource, even to
the point of death. Karlen (2005) also criticized the fact that the choice given to the
animal may be too easy or that the choice may be difficult to assess or be misleading.
Also, any aspect that interferes with the three issues stated earlier, that the test must
reflect the animals’ preferences, show how much the animal prefers a resource, and
present preferences that are good for the animal, as pointed out by Fraser and Matthews
(1997), could be seen as a weakness for this type of testing. Dawkins (1983) also notes
that genetic differences will make a difference in preference testing. Genetic differences,
however, affect results in all kinds of animal testing, from production to endocrinology
research.
The use of preference testing and its validity is widely accepted in the field of
psychology. Though there have been criticisms of the use of this test, mostly from an
agricultural and welfare point of view, Y-maze testing has become a fixture for
psychological research. A great strength to this research is its explicit aim of
understanding what the animal prefers; these findings may be more palatable to the
30. 30
general public and they may accept them more readily. It is clear that the Y-maze testing
has potential but further research has to be carried out, especially in swine, to see if the
approach is reliable and accurate for animal welfare research.
The purpose of the present study was to assess preference for important resources
in swine using Y-maze methodology. This Y-maze test will test the pigs’ preference
between food and social contact under different levels of food and social restriction. As
it is generally agreed in the literature that food is necessary for a good state of welfare
and some (Matthews and Ladwig, 1994) suggest that it could be a “gold standard” when
it comes to preference testing, food seems to be what a pig would prefer over other
resources. Therefore, we hypothesize that the pig will prefer food to social contact.
31. 31
CHAPTER 4
MATERIALS AND METHODS
The experiment was conducted in three replicates. Replicates I and II were
preformed at the Animal Welfare Science Center in Werribee, Australia. Replicate III
was conducted at the Ohio Agricultural Research and Development Center, Western
Agricultural Research Station, South Charleston, Ohio, USA.
PIGS AND PIG MANAGEMENT
In replicates I and II, the pigs were prepubescent, female Large White × Landrace
crossbreds. In replicate I, the pigs weighed between 39.6 and 45 kg (mean = 41.4 kg) and
in replicate two, the pigs weighed between 32 and 49 kg (mean = 41.5 kg). For replicate
III, the pigs were prepubescent, purebred Landrace females weighing between 44.3 and
49.8 kg (mean = 46.9 kg). Prior to entering the test facility, all pigs in all replicates were
housed together in a commercial grower facility and provided ad libitum access to feed
and water. Because all pigs were housed together prior to initiation of the experiment, no
additional time was required to establish animal social interactions among the pigs. A
total of 20 pigs were brought to the test facility in each replicate, sixteen to be used for
subsequent allocation to treatments and four to be used as stimulus pigs during the testing
period. All pigs were identified by ear notch and ear tag. Live weight of the pigs was
32. 32
collected at the beginning of all replicates, while final live weight was collected only in
replicates I and III. In replicate III, pig live weights were recorded daily to monitor daily
pig growth rates.
In all replicates the pigs were provided ad libitum access to water from automatic
waterers (nipple or cup) and were housed on straw-bedded concrete for the duration of
the experiment. Replicates I and II were conducted in a steel-sided, mechanically
ventilated building providing natural and artificial light. Artificial lighting illuminated
the housed area and light was provided for approximately nine hours per day. In the third
replicate, pigs were housed in a naturally ventilated hoop structure (a half pipe structure
with a steel frame over-laid with a soft plastic roof) in a single space. Natural lighting
was provided via the translucent hoop roof and end wall doors. Throughout the first
week of the experiment (training phase), pigs were housed in a single group providing 1.2
m2
space allocation per pig in all replicates
During the testing phase of the experiment, following the one-week training
phase, pigs were allocated to experimental treatments requiring individual or paired
housing accommodations. Pens were designed to eliminate visual or tactile contact with
pigs in adjacent pens. Pigs housed individually or in pairs were provided 1.2 m2
per pig
space allocation.
Y-MAZE DESIGN
The Y-maze test apparatus is shown in Figure 4.1, including dimensions, gate
locations, and appropriate descriptors for segments of the Y-maze. The Y-maze, from the
point of pig entry, consisted of the following outline. Pigs entered the Start Box, a 1.5 m
× 2.0 m area, where the pig is allowed visual contact with arms of the Y-maze via a mesh
33. 33
gate (Gate A) that opens into the Long Arm (3 m ×1.5 m) of the maze. Gate A was in the
closed position as the pig entered the Start Box. After the pig entered the Start Box, solid
guillotine gates B and C were opened simultaneously to allow the pig to see both Short
Arms of the Y-maze (2 m × 1.5 m) and the choice options (feed or social contact) were
located at the termination of the Short Arms. After gates B and C were opened, gate A
was opened to allow the pig to enter the Long Arm of the Y-maze and gate A was closed
following entry into the Long Arm to prevent reentry into the Start Box. When the pig
was in the long arm it was standing at the point of clear division of the two arms. After
the pig fully entered a Short Arm of the Y-maze, indicating a choice response, the gate (B
or C) to the resource not chosen was closed so that the pig had access only to the short
arm of the resource chosen and the entire long arm of the Y-maze. Following a defined
choice, the pig remained with access to the chosen resource for two minutes. The Y-
maze in all replicates was illuminated by natural lighting through a translucent roof.
34. 34
Figure 4.1. Diagram and dimensions of the Y-maze test apparatus.
2.00 m
Mesh Fence
1.50 m
Mesh Fence
1.50 m
Mesh guillotine gate
1.50 m
Solid guillotine gates
1.30 m each
Solid guillotine gate
1.00 m
4.05 m
1.40 m
5.00 m
2.00 m
Gate CGate B
Gate A
Start box
35. 35
EXPERIMENTAL PROCEDURE-TRAINING
Week one of the experiment consisted of familiarizing the pigs with their
surroundings and initiation of the training portion of the experiment to familiarize and
learn the Y-maze apparatus and to allow acclimation to their handlers.
Day 1: Pigs weighed and introduced to the new building. The pigs were placed in
one pen and allowed to adjust to new surroundings.
Days 2 and 3: Introduction of random pairs of pigs to the empty maze in the
morning and afternoon (four introductions per pig over the two-day period). Pairs
of pigs were placed in the empty maze for five minutes at each introduction and
order of entry to the maze was random.
Days 4 and 5: The Y-maze was set up with a feeder in one Short Arm and two
pigs (social contact) in the other Short Arm. Pigs were introduced to the Start
Box in pairs and subsequently allowed random access to one Short Arm of the Y-
maze for a period of two minutes. After two minutes, pairs of pigs were returned
to the Start Box and then allowed access to the other Short Arm for a period of
two additional minutes. Pigs were trained in both the morning and afternoon for a
total of four experiences in the Y-maze over the two days.
Days 6 to 7: Procedures for days 6 and 7 were similar to days 4 and 5, except that
pigs were introduced as individuals rather than in pairs.
“Pig Allocation”
On day seven, after the final training, the pigs were allocated to a treatment.
Factor one treatments were: full feeding (FF), provision of as much feed as a pig could
consume in two twenty-minute feeding periods (a.m. and p.m.), and feed restriction (FR),
36. 36
provision of approximately 70% of estimated FF intake, and feed was supplied in two,
twenty minute feeding periods (a.m. and p.m.). Feeding periods were separated by
approximately seven hours. Feed allocation (kilograms per pig) under each treatment
was based on farm level records of feed consumption in pigs of similar age and weight
under standard farm finishing protocols. Feed allocations were weighed before each
feeding period in all replicates, and weight of residual feed was recorded only in replicate
III.
Factor two treatments involved social contact. Factor two treatments included:
social contact (SC), consisting of pigs housed in pairs with full contact and interaction
capabilities, and isolation (I), consisting of individual pig housing without tactile or
visual contact with other pigs. Olfactory and auditory contact with other pigs was not
controlled in the experiment.
Pigs were assigned to treatment pseudo-randomly in a 2 x 2 factorial arrangement
of treatments consisting of four pigs each within the FF and SC, FF and I, RF and SC,
and RF and I treatment combinations for each replicate. The four remaining, non-
assigned pigs, used to provide social contact within the Y-maze, were housed as a group
in a separate pen.
Following assignment of a pig to a treatment, position of the choice resources
(feed and social contact) in the Short Arm of the Y-maze was assigned for each pig,
whereby the feed or social contact choice was always offered on either the left or right
side of the Y-maze for the twelve-day testing period. Positions of feed and social contact
choices in the right and left Short Arms of the Y-maze were balanced across all treatment
combinations. In addition, eight pigs were tested in the morning and eight tested in the
37. 37
afternoon, balancing for treatment combinations with assignment to morning or afternoon
testing maintained throughout the study. Two non-assigned pigs were used as social
contact subjects in the morning and the remaining two non-assigned pigs used as social
contact subjects in the afternoon, maintaining the pairing and testing time throughout the
study.
Testing Procedures
For each pig, the Y-maze was set up with a feeder in the assigned Short Arm and
two pigs (social contact) in the other Short Arm. Pigs were removed from their assigned
pen and moved to the Y-maze by their handler, weighed (replicate III only), and placed in
the Start Box. Following placement in the start box, the handler simultaneously raised
the solid guillotine gates (gates B and C) allowing the pig to view both choice resource
options through the mesh gate (gate A). Mesh gate A was lifted and the pig were allowed
to make a choice of the two available resources. Once the pig chose a resource, the solid
gate leading to the non-chosen resource was closed to prevent entry and sight of the
alternative. Each pig was allowed to interact with the chosen resource for two minutes.
After two minutes had elapsed, the pig was removed from the Y-maze and returned to its
pen. Order of testing within a given day was random. The test was carried out for 12
consecutive days.
Data recorded included: daily choice made within the Y-maze and within
replicate III only, the time the individual pig spent closely (approximately 25 cm)
interacting with the chosen resource and for pigs choosing feed, the amount of feed
consumed was recorded. In replicate I and III, average daily gain for the full testing
period was calculated.
38. 38
Statistical Analysis
Data analyses were performed using SPSS 15.0 statistical software using General
Linear Models with fixed effects of feed treatment, social contact treatment, the
interaction between feed and social contact treatments, and the fixed effect of replication.
Pig was the experimental unit in analyses of choice behavior. The dependent variables
tested included the average proportion of the testing period that a pig chose the feed
resource in the Y-maze, and in replicates I and III, a pig’s average daily gain throughout
the test. In addition, phenotypic correlations between proportionate choice of feed,
average daily gain, and starting and final weights were calculated. Choice responses,
averaged for a given pig throughout the study, were calculated and used as the basis for
additional cluster analysis using a dendogram algorithm.
39. 39
CHAPTER 5
RESULTS
Of the percentage of all the choices made in the Y-maze, 63.0% of them were to
social contact and 37.0% to feed (for individual choice proportions and distribution see
Figure B.1). A breakdown of percentages going to feed and social contact in the Y-maze
by both treatments (2 x 2 factorial design) is presented in Table 5.1, and the distribution
of individual choice proportions is presented in Figure B.2. When divided by one factor
treatment, pigs on FF chose feed in the Y-maze 27.9% of the time, while pigs on FR
chose feed 46.5% (for distribution see Figure B.3). Pigs on SC chose feed in the maze
38.3% of the time and those under SR chose feed in 35.7% of trials (for distributions see
Figure B.4).
Histograms were made to show the distribution of the individual pig’s percentage
of choice of feed in the Y-maze and are presented in Appendix B. These histograms
show the distribution of all pigs in the study (Figure B.1), pigs’ choice behavior broken
down by treatment in the 2 x 2 factorial design (Figure B.2), and pigs’ choice behavior
when divided by one factor (feed or social treatment) (Figures B.3 and B.4)
40. 40
Experiment Wide,
Y-maze Choice Choice in the Y-maze
Pigs Observations Social Contact Feed
48 576 63.0 37.0
Percent of Time
Feed Chosen in
the Y-mazea
Feed Treatment
Restricted Feed Full Feed Row Averageb
Social Treatment
Social Restriction 49.2 27.5 38.3
Social Contact 43.8 27.5 35.7
Column Averageb
46.5 27.5
Percent of Time
Social Contact
Chosen in the Y-
mazea
Feed Treatment
Restricted Feed Full Feed Row Averageb
Social Treatment
Social Restriction 50.8 72.5 61.7
Social Contact 56.2 72.5 64.3
Column Averageb
53.5 72.5
a
Twelve pigs and 144 observations within the Y-maze per sub-cell.
b
Twenty-four pigs and 288 observations within the Y-maze per row (column) average.
Table 5.1. Distribution of choice behavior (feed or social contact) in the Y-maze testing
across replicates and within the 2 x 2 factorial arrangement of treatments (social contact
vs. social restriction and full feed vs. restricted feed).
Table 5.2 shows the least squared means across treatments and replicates. The
percent of time that the pigs choose feed in the Y-maze was significantly affected by
feed treatment but not by social treatment or replicate. Pigs under restricted feeding
chose feed int eh Y-maze 19% more frequently that the full-fed pigs. Average Daily
Gain (ADG), which could only be analyzed from the first and third replicates, was
41. 41
significantly affected by feed and social treatment, but not by replicate. Restriction of
feed lowered ADG by 0.18 Kg/day, while social restriction reduced ADG by 0.078
Kg/day.
Traita
Percent Choice
of Feed, %
Average Daily
Gain, kg/day
Treatmentb
N LSMEAN SE N LSMEAN SE
Social Contact 24 38.3 6.1 16 0. 719d
0.024
Social Restriction 24 35.7 6.1 16 0.641 e
0.024
Treatmentb
Full Feed 24 27.5d
6.1 16 0.770d
0.024
Restricted Feed 24 46.5e
6.1 16 0.590e
0.024
Replicatec
Werribee 1 16 31.6 7.5 16 0.674 0.024
Werribee 2 16 48.2 7.5 - -
OSU 16 31.3 7.5 16 0.686 0.024
a
Percent Choice of Feed = Proportion of choice of feed, in contrast to choice of social contact, in the Y-
maze across 12 consecutive days of Y-maze testing; Average Daily Gain = Growth rate of pigs
throughout 12 consecutive days of testing in the Y-maze.
b
Social Contact = Pigs housed in pairs with full interaction for 12 consecutive days of testing; Social
Restriction = Pigs housed in isolation without visual or tactile contact with another pig for 12 consecutive
days of testing; Full Feed = Pigs provided ad libitum access to feed in two, twenty-minute feeding
periods per day over 12 consecutive days of testing; Restricted Feed = Pigs provided 75% of estimated ad
libitum intake of feed in two, twenty-minute feeding periods per day over 12 consecutive days of testing.
c
Experiment conducted in three replicates, two in Werribee, Australia and one at OSU, The Ohio State
University, USA.
d, e
Least squares means within a treatment by trait subclass without common superscripts differ
significantly (P < 0.05).
Table 5.2. Results of three replications of Y-maze testing in pigs assessing the impact
of imposed social and feed treatments on choice of resources in the Y-maze and growth
rate.
42. 42
A hierarchical analysis using a dendrogram algorithm on proportion of time feed
chosen by an individual pig was performed. This analysis showed that there were two
distinct clusters of pigs. The first cluster (n = 36) included pigs with proportions of
choosing feed in the Y-maze 0 to 58% over the twelve consecutive trials. The second
cluster (n = 12) included pigs choosing feed in the Y-maze 75 to 91% over the twelve
consecutive trials.
Correlations were calculated to assess the linear relationship between ADG and
percent choice of feed in the Y-maze (see Table 5.3 for correlations). A significant
Pearson correlation (r = -0.42 was reported between ADG and percent of time feed was
chosen in the Y-maze for data from the first and third replicate. When residual
correlations were carried out and the model effects (feed treatment, social treatment and
replicate) were accounted for there was no significant correlation between percent
choice and ADG. When the residual correlation accounted for social treatment and
replicate, there was a significant negative correlation (r = -0.39 between ADG and
percent of time feed was chosen in the Y-maze. When the residual correlation was
adjusted for feed treatment and replicates no significant correlation was found. From
these results, it is evident that the reduction in ADG observed throughout the trial was
only associated with pigs that were exposed to the restricted feeding treatment. Thus,
the feeding rate effect was sufficient to elicit hunger in FR pigs, causing them to choose
feed more frequently in the Y-maze.
43. 43
N Correlation Significance
Pearson Phenotypic Correlation 32 - 0.42 P < 0.05
Residual Phenotypic Correlation –
Adjusted for Social Treatment, Feed
Treatment and Replicate Model Effects
32 - 0.14 P = 0.48
Residual Phenotypic Correlation –
Adjusted for Social Treatment and
Replicate Model Effects
32 - 0.39 P < 0.05
Residual Phenotypic Correlation –
Adjusted for Feed Treatment and
Replicate Model Effects
32 - 0.20 P = 0.29
Table 5.3. Phenotypic and model adjusted residual correlations between average daily
gain and proportion of times pigs chose feed in the Y-maze over twelve consecutive
days of Y-maze testing.
44. 44
CHAPTER 6
DISCUSSION
These results suggest that pigs have a strong preference for social contact and
indeed, for some pigs (irrespective of the level of deprivation of feed or social contact as
studied in the present experiment), this preference for social contact may be stronger than
that for feed under many conditions. The findings are in contrast to the research by
Matthews and Ladewig (1994) using behavioral demand that indicated that pigs should
prefer feed to social contact.
In the present experiment, there was a significant main effect of feed treatment on
choice behavior. Pigs under FR increased feed choice in the Y-maze from 28% to 47%
when compared with FF pigs. However, there were no main effects of social contact or
significant interactions between main effects on choice behavior. The effects of FR on
choice behavior suggest that for some pigs, there is a preference for feed over social
contact (which may be caused by biological factors, e.g., hunger). The preference for a
biological necessity, such as food, overriding that of social preference, makes
evolutionary sense.
45. 45
The overall data on choice behavior can be further explored by conducting a
hierarchical analysis using a dendrogram algorithm on the choice behavior of the 48
study pigs. This analysis suggested that there were two distinct clusters of pigs, with the
separation of clusters pigs choosing feed up to 58% of the time and that choosing feed >
75% of the time. The first cluster included 36 pigs (75%) that chose feed in the Y-maze
in 0 to 58% of the tests and the second cluster, consisting of 12 pigs (25%), chose feed in
75 to 91% of tests. These limited data suggest that under deprivation or no deprivation
conditions, there may be two types of pigs, those that prefer food and those that prefer
social contact. If this is a real effect, these results have important implications for animal
welfare. One interpretation, for example, is that pigs may differ in their welfare
requirements.
The overall relationship between percent choice behavior in the Y-maze and ADG
may be mainly a function of the feed restriction treatment (see Table 5.3). Though the
phenotypic Pearson correlation was a significant and negative correlation, when residual
phenotypic correlations were carried out and when all treatments and combinations were
accounted for, feed treatment was the driver of the negative correlations, not replicate or
social treatment. The negative correlation between percent feed choice in the Y-maze
and ADG suggests that pigs not meeting their appetitive biological needs, i.e., the pigs
feel hungry enough to change preferences in order to maintain a normal ADG (within
their similar genetic and environmental conditions) and prefer feed in the Y-maze at a
greater rate than the effect caused by the FF and social treatments. Once again, the
biologically necessary resource could override choice behavior when the biological
resource is restricted.
46. 46
The results from this experiment indicate that the methodology is valid on the
basis of the consistency of choice behavior, both within and between animals. There
was also considerable similarity between replicates, including between the Australian and
U.S. replicates, in which both genetics and housing conditions varied markedly. These
data suggest that the preference testing using a Y-maze methodology as demonstrated in
the present experiment may provide valuable information on welfare priorities.
The results of the present study appear to contradict those of Matthews and
Ladewig (1994), since the current study suggests that social contact may be as/more
desirable than feed, in most pigs (which, by extension, would suggest that the “gold
standard” of preference testing may well be social contact at this treatment level). It
should be noted, however, that with preference testing there is some degree of arbitrary
assignment of resources that could affect results. The amount of reward may make a
difference on choice or risk-taking (Matthews and Ladewig, 1994). Availability of other
resources could also affect choice behavior (Matthews and Ladewig, 1994). An animal’s
preference may also be for what is not in the animal’s best interest, which has been
demonstrated in rats with drug addiction (van der Kooy, 1987).
However, the Matthews and Ladewig (1994) and the current study differ in
priorities and procedures in several ways:
1. All pigs were housed in isolation in Matthews and Ladewig
2. Differences in how the pigs could interact when they made their choice
3 Matthews and Ladewig may have had pigs under constant light conditions
The housing of all pigs in isolation (accept 10 minutes per day) in Matthews and
Ladewig may affect their results. Dawkins (1983) believed that testing welfare in
47. 47
isolation was unreliable. This aspect aside, Matthews and Ladewig only placed their pigs
under social restriction and not food restriction. The restriction of only social contact
could influence results. Social isolation has been shown to have an effect on feeding
behavior (Birte et al., 1996). Without a way of restricting or varying feed intake, it may
be hard to know what effect a feed treatment would have on results. It is also unclear that
even if pigs were meeting their biological needs, they were also meeting their appetitive
(physiological) needs. Also, the reinforcer of social contact may not be enough to elicit a
true preference choice (Savory and Duncan, 1982). For instance, in the Y-maze a pig
could eat as much as it could in two minutes, while in Matthews and Ladewig (1994) the
pig had to work for 27 grams of feed in each bout of feeding. It is possible that in
Matthews and Ladewig’s study, the pig would have to work harder to obtain the utility of
feeding. This is also directly related to differences in how the pigs were allowed to
interact with the chosen resources. In the current experiment, the pig was allowed to
interact though mesh fencing with two pigs (as the social stimulus) that could move
around and in Matthews and Ladewig the pig could access the social stimulus of one pig
in a stall with restricted movement next to the operant chamber. Though unclear from the
previous work, the pigs in Matthews and Ladewig may have been kept under constant
lighting conditions, which could confound results. Constant lighting conditions could
lead to circadian deregulation (Haus and Smolensky, 2006). The effects on the circadian
deregulation on social need and appetite are not known in the pig, but may significantly
affect choice behavior.
Criticism of Y-maze methodology for not being able to determine the amount of
preference for an object seems unfounded. Though it is not possible to say how hard an
48. 48
animal may “work” for a resource, clearly, as the present study demonstrates, the pigs do
prefer one resource over the other, when allowed to make a free choice. Working for
social contact as described by Matthews and Ladewig (1994) did not extinguish (cease)
in any pig, no matter how much the pig had to work for social contact. The only thing
that was reduced was how often the pig would work for social contact. This may suggest
that when the pig knows that it has access to both feed and social contact, and one choice
does not affect the availability of the other, the pig may simply need less time with social
contact to find it sufficiently rewarding. This may explain why Matthews and Ladewig
found that pigs work harder for feed, because they may get enough social contact to be
satisfied by even working for just one instance of social contact.
49. 49
CHAPTER 7
CONCUSION
The Y-maze could have many advantages over other methods of preference
testing. Its ease of construction, learning, and use make it much easier to research larger
numbers of animals than many other preference tests, including operant testing. The
forcing of an animal to choose a resource to the detriment of the other may well be the
most definitive way of determining the animal’s overall preference for a resource. Also,
with continued testing, a hierarchy of preferences could be assessed to compare to other
preferences (pen size, food taste, different housing conditions, etc).
In conclusion, the Y-maze seems to be an accurate way of assessing preference in
the pig. Thought the amount of reward and testing procedures is somewhat arbitrary, the
consistent results of the pig’s choice of social contact over feed under the current
experimental conditions suggest that the pigs are making preference choices. The finding
that pigs prefer social contact over feed contradicts the prevailing belief that food is the
prevailing testing resource to use in preference testing, as social contact seems to be very
important to the pig. Further studies will need to be done to see the exact preference
behavior in the pig, but this study suggests food and social contact to be of equal
importance (or social contact more important) for the pig when it is given enough feed to
50. 50
maintain healthy metabolic function. Also, the identification of possible groups of pigs
choosing consistently different resources within the Y-maze requires further research in
the animals before preference-testing.
51. 51
BIBLIOGRAPHY
Adkins E, Orgeur P, Sigoret JP. (1989). Sexual differentiation of reproductive behavior
in pigs: defeminizing effects of prepubertal estradiol. Hormones and Behavior, vol. 23,
no. 2. 209-303
Alberta Department of Agriculture, Food and Rural Development (2005). An Update on
Gestation Housing of Swine. Retrieved February 23, 2006 from
http://www1.agric.gov.ab.ca/$department/newslett.nsf/all/bb6830
American Veterinary Medical Association (2004) A pigs eye view into animal welfare,
November 10, 2004. Accessed http://www.aasv.org/news/story.php?id=1299 on Mar. 2,
2004
Anisman H, Ritch M, Sklar LS (1981) Noradrenergic and dopaminergic interactions in
escape behavior: Analysis of uncontrollable stress effects. Psychopharmacology. 74, 3,
263-268
Appleby, M.C. and Huges, B.O. (1997). Introduction. In Animal Welfare, Eds. M.C.
Appleby and B.O. Huges, CAB International, Wallingford, UK.
Aquinas, Thomas (1920). Summa Theologica II, I, Q102 Art. VI. Translated by the
Fathers of the English Domican Province.
Arey and Franklin (1995). Effects of straw and unfamiliarity on fighting between
newly mixed growing pigs. Appil. Ani. Behav. Sci. 45, 1995, pp 23-30
Barnett JL and Hemsworth PH (2003). Science and its application in assessing the
welfare of laying hens in the egg industry. The Australian Vet. J. 81:615-623.
Barnett JL, Cronin GM, McCallum TH, Newman EA (1993) Effects of pen size/shape on
aggression when grouping unfamiliar adult pigs. Ani. Sci. Behav. 1993,36, 111-122
Barnett JL, Hemsworth PH, Cronin GM, Newman EA, McCallum TH (1991). Effects of
design of individual cage-stalls on the behavioral and physiological responses related to
the welfare of pregnant pigs. Appil. Ani. Behav. Sci. 32, 23–33.
52. 52
Barnett JL, Hemsworth PH, Cronin GM, Newman EA, McCallum TH(1991) Effects of
design of individual cage-stalls on the behavioral and physiological responses related to
the welfare of pregnant pigs. Applied Animal Behavior Science 32, 23–33.
Barnett J, Hemsworth P, Cronin G, Newman E, McCallum & Chilton D (1992), "Effects
of pen size, partial stalls and method of feeding on welfare-related behavioral and
physiological responses of group-housed pigs", Applied Animal Behavior Science,
1992,34, 207-220
Barnett J, Hemsworth PH, Cronin G, Jongman, Hutson. (2001) A review of the welfare
issues for sows and piglets in relation to housing. Australian Journal of Agricultural
Resources. 2001,52,1-28
Barnett, Hemsworth, Newman, McCallum, Winfield (1989) The Effect of Design of
Tether and Stall Housing on Some Behavioral and Physiological Responses Related to
the Welfare of Pregnant Pigs. Applied Animal Behavior Science 1989,24, 1-12
Barnett, J.L. and Taylor, I.A. (1997). Sequential versus concurrent feeding on acute and
chronic stress responses in pigs. Fifth International Livestock Environment Symposium
(eds) Bottcher, R.W. and Hoff, S.J. (American Society of Agricultural Engineers,
Michigan, USA), pp. 607-612.
Baxter, Mike (1985). Social space requirements of pigs. In R. Zayan (Ed.). Social
Space for Domestic Animals (pp116-127). Dordrecht: Martinus Nijhoff Publishers
Bolhuis JE, Schouten WG, de Leeuw JA, Schrama JW, Wiegant (2004). Individual
coping characteristics, rearing conditions and behavioural flexibility in pigs. Behav.
Brain Res. 152(2):351-60
Bolles R. (1981). Emotion. In The Oxford companion to Animal Behavior. Ed DJ
McFarland. Oxford University Press, Oxford. 149-152
Broom DM (1988). The Scientific Assessment of Animal Welfare. Appil. Ani. Behav.
Sci. 20. 5-1
Broom DM, Mendl, Zanella (1995). A comparison of the welfare of sows in different
housing conditions. Ani. Sci. 1995, 61: 369-365
Broom DM, Johnson KG (1993). Stress and Animal Welfare. Chapman and Hall,
London.
Broom, D.M, and Johnson K.G (2000). Stress and Animal Welfare. Dordrecht: Kluwer
Academic Publishers, pp 55
53. 53
Carrasco GA, van de Kar LD (2003) Neuroendocrine pharmacology of Stress. Euro. J. of
Pharmacology. 463, 235-272.
Cronin GM, Wiepkema PR, Van Ree JM (1985). Endogenous opioids are involved in
abnormal stereotyped behaviours of tethered sows. Neuropeptides 1985, 6, 527-530
Curtis, S.E., Hurst, R.J., Gonyou, H.W., Jensen, A.H., and Muehling, A.J. (1989) The
Physical space requirement of the sow. J. Anim. Sci. 1989, 67, 1242-1248
Da Costa AP, Guevara-Guzman RG, Ohkura S, Goode JA, Kendrick K (1996). The Role
of Oxytocin Release in the Paraventricular Nucleus in the Control of Maternal Behaviour
in the Sheep. J. Neuroend. 8 (3), 163–177.
Dawkins MS. 1977. Do hens suffer in battery cages? Environmental preferences and
welfare. Anim. Behav. 25:1034-1046.
Dawkins MS (1983) The current state of preference in tests in the assessment of animal
welfare. In Farm Animal Housing and Welfare, SH Baxter, MR Baxter and JAC
MacCormack Eds., Martinus Nijhoff Publishers. Boston
Dawkins, M.S. (2003). Behavior as a tool in the assessment of animal welfare. Zoology
106(4): 383-387.
Dawkins MS (2001). How Can We Recognize and Assess Good Welfare? In Coping
with Challenge Ed. D. M. Broom. Dahlem University Press. Köthen. 63-78
Drews, C. (1993) The concept and definition of dominance in animal behavior.
Behavior, 125, 283–311.
Dember WN, Richman CL (1989). Spontaneous alternation behavior in animals:
Functions and determinants. Springer-Verlag Publishing Co.
Duncan IJH (1978) The interpertaton of preference tests in animal behaviour. Br. Poultry
Sci., 4,197-200
Duncan IJH and Fraser D. (1997). Understanding animal welfare. In Animal Welfare ,
Eds. M.C. Appleby and B.O. Huges, CAB International, Wallingford, U.K. 19-31
Dunnett SB and Brasted PJ (2001). An operant analysis of fronto-striatal function in the
rat. In Methods of Behavior Analysis in Neuroscience. Ed. J.J. Buccafusco. CRC Press.
New York 201-229
Farm Animal Welfare Council. (May 1996). Report on the Welfare of Pigs Kept
Outdoors. Surry
54. 54
Fraser and Mathews (1997). Preference and motivational testing. In Animal Welfare ,
Eds. M.C. Appleby and B.O. Huges, CAB International, Wallingford, UK.
Grandin T, Curtis SE, Widowskii TM, Thrumon JC (1986) Electro-immobilation versus
mechanical restraint in an avoid-avoid choice test for ewes. J. of Ani. Sci. 62, 1469-
1480.
Hagen, K. and Broom, D.M. 2004 Emotional reactions to learning in cattle. Appl. Anim.
Behav. Sci. 85, 203-213.
Harman JS, Wright RL, Bellani R, Jackson JL, Kleen JK, McLaughln K, Tsekhanov S,
Conarad CD (2004) Lesion of the Dorsal Hippocampus Impairs Y-maze Performance
When Salient Internal Cues Are Absent but Not When Salient Internal Cues Are Present
Haus E, Smolensky M (2006) Biological clocks and shift work: circadian dysredulation
and potential long-term effects. Cancer Causes Control. 17, 4, 489-500
Hessing, M. J. C., Hagelsø, A. M., van Beek, J. A., Wiepkema, P. R., Schouten, W. P. G.,
& Krukow, R. (1993). Individual behavioral characteristics in pigs. Appil. Ani. Behav.
Sci. 1993, 37, 285-295.
Hicks TA, McGlone JJ, Whisnant CS, Kattesh HG, Norman RL (1998). Behavioral,
Endocrine, Immune, and Performance Measures for Pigs Exposed to Acute Stress. J.
Anim. Sci. 1998, 76, 474-483
Jackson RL, Alexander JH, Maier (1980) Learned helplessness, inactivity, and
associative deficits: effects of inescapable shock on response choice of escape learning. J
Exp. Psychol. Anim. Behav. Process. 6,1, 1-20.
Jensen Per, Yngvesson Jenny (1998) Aggression between unacquainted pigs-sequential
assessment and effect of familiarity and weight. Applied Animal Behavior Science 1998,
58, 49-61
Jephcott EH, McMillen IC, Rushen J, Hargreaves A, Thorburn GD (1986) Effect of
electroimmobilisation of ovine plasma concentration of B-endorphine/B-lipotrophin,
cortisol and prolactin. Res. Vet. Sci. 41, 371
Johnston C. (2004). Nociception and noiperception in fish: where does the debate fit in
primary industries. Ed. Bitty Jones. From Welfare Underwater: Issue with
Aquadic Animals, Proceedings of the 2004 RSPCA Australia Scientific Seminar.
RSPCA Australia.
Karlen, GA (2005). The welfare of gestating sows housed in conventional stalls and in
large groups on deep litter. Master of Animal Welfare. University of Melbourne.
55. 55
Kay RM, Burfoot A, Spoolder HAM, Docking CM (1999). Effect of flight distance on
aggression and skin damage of newly weaned sows at mixing. Proceedings of the British
Society of Animal Science. Page 14
Kirkden RD, Pajor EA (2006) Motivation for group housing in gestating sows. Ani.
Welfare. 15, 2, 119-130.
Luescher UA, Friendship RM, McKeown (1990). Evaluation of the methods to reduce
fighting among regrouped gilts. Can. J. Animal Science 1990, 70, 363-370
Loijens LWS, Janssens CJJG, Schouten WGP, Wiegant VM (2002) Opiod activity in
behavioral and heart rate responses of tethered pigs to acute stress. Physiology &
Behavior 2002, 75, 621-626
Marrow-Tesch J and McGlone JJ (1990). Sources of maternal odors and the
developmentof odor preferences in baby pigs. J Anim Sci. 68(11): 3563-71.
Mattehews and Ladewig (1994). Environmental requirements of pigs measured by
behavioral demand functions. Anim. Behav,47,713-719
McBride SD & Hemmings A (2001) Nucleus accumbens DI dopamine receptor numbers
are significantly higher in horses performing stereotypic behaviour. Proceedings of the
Association for Veterinary Teachers and Research Workers Conference, Scaborough 9-
12 April 2001
McLaughlin CL, Baile CA, Buckholtz LL, Freeman SK. (1983). Preferred flavors and
performance of weanling pigs. J. Anim Sci. vol. 56, no. 6. 1287-93
McGlone, John (1991). Techniques for evaluation and quantification of pig reproductive,
ingestive and social behaviours. J. Anim. Sci. 1991, 69, pp 4146-4154
Medvedev IO, Dravolina OA, Bespalov AY (1998) Effects of N-Methyl-D-Aspartate
Receptor Antagonists on Discriminative Stimulus Effects of Naloxone in Morphine-
Dependent Rats Using the Y-Maze Drug Discrimination Paradigm. J. of Pharm. And
Exper. Therapeutcs. 286, 3, 1260-1268
Mendl, Michael. 1991. Some problems with the concept of a cut-off point for
determining when an animal's welfare is at risk. Appl. Animal Beh. Sci. 1991,31,139-
146.
Moberg, GP (1985). Biological response to stress: key to assessment of animal well-
being? In Moberg GP (ed.) Animal Stress. American Physiological Society., Bethesda
Maryland. 27-49.
Muenzinger KF (1938). Vicarious trial and error at the point of choice: I. A general
survey of its relation to learning efficiency. J. General Psycho., 53: 75-86
56. 56
Nielsen BL, Lawrence AB, Whittemore CT (1996) Effect of individual housing on the
feeding behaviour of previously group housed growing pigs. Appl. Anim. Behav. Sci.
47, 149-161
Olsson, I.A.S., de Jonge, F.H., Schuurman, T., Helmond F.A. (1999) Poor rearing
condition and social stress in pigs; repeated social challenge and the effect on behavioral
and physiological responses to stressors. Behav. Processes 1999, 46, pp 201-215
Otten, W.; Puppe, B.; Stabenow, B.; Kanitz, E.; Schön, P.C.; Brüssow, K.P.; Nürnberg,
G. (1997). Agonistic interactions and physiological reactions of top- and bottom-ranking
pigs confronted with a familiar and an unfamiliar group: preliminary results. Appl. Anim.
Beh. Sci. 55, 79-90
Pajor, E., Rushen, J., & de Passillé, ., & , A. (2003). Dairy cattle’s choice of handling
treatments in a Y-maze. Applied Animal Behaviour Science, 80(2), 93-107
PETA (2007) Why Animal Rights? Retrived November 25, 2007 at
http://www.peta.org/about/WhyAnimalRights.asp
Pedersen LJ, Jensen MB, Hansen SW, Munksgaard L, Ladewig J, Matthews L (2002)
Social isolation affects the motivaton to work for food and straw in pigs as measured by
operant conditioning techniques. Appl. Ani. Behaviour Science. 77, 295-309.
Puppe, Birger (1998). Effects of familiarity and relatedness on agonistic pair
relationships in newly mixed domestic pigs. Appl. Anim. Beh. Sci 1998, 58, 233-239
Raj ABM, Gregory NG (1995). Welfare Implications of the Gas Stunning of Pigs.
Anim. Welfare, 4:4, 273-280
Regan, Tom (1983). The Case for Animal Rights. University of California Press
Ruis MAW, Te Brake JHA, Engel B, Ekkel ED, Buist WG, Blokhuis HJ, Koolhaas HM
(1997) The circadian rhythm of salivary cortisol in growing pigs: effects of age, gender
and stress (poster). In Hemsworth PH, Spinka M, Kostal L (eds.). Proceedings of the
31st
International Congress of the ISAE, 13-16 August 1997, Prague, Czech Republic.
Prague: Polygrafina SAV
Rushen, J., and P. Congdon. 1986. Relative aversion of sheep to simulated shearing with
and without electro-immobilization. Aust. J. Exp. Agric. 26:535.
Rushen, J. and de Pasille AMB (1992). The scientific assessment of the impact of
housing on animal welfare: A critical review. Can. J. of Anim. Sci. ; 72:199-214
Rushen, J. (1996). Using aversion learning techniques to assess the mental state,
suffering, and welfare of farm animals. J. of Anim. Sci. 74: 1990-1995
57. 57
Singer, Peter (1975). Animal Liberation. Avon Books. New York
Skinner, BF (1938). The Behavior of Organisms. Appleton-Century-Crofts. New York
Scruton, Roger (2000). Animal Rights and Wrongs. London: Metro Books and Demos
Terlouw C., Schouten W., Ladewig J. (1997). Physiology. In Animal Welfare , Eds.
M.C. Appleby and B.O. Huges, CAB International, Wallingford, UK.
Tolman EC (1948). Cognitive Maps in Rats and Men. The Psych. Review.
55:189-208
van der Kooy, D., Bucenieks, P., Mucha, R. F., & O’Shaughnessy, M. (1982).
Reinforcing effects of brain microinjections of morphine revealed by conditioned place
preference. Brain Research, 243, 107-117.
Vincent, SB (1915). The white rat and the maze problem: III. The introduction of tactual
control. J. of Ani. Behav. 5, 3, 176-184
Yerkes RM (1903). Relations of Stimuli in the Frog. Harvard Studies. Vol 2
Young and Lawrence (1996). The effects of high and low rates of food reinforcement on
the behavior of pigs. Applied Animal Science 49, 1996, pp 365-374
Wall Street Journal (2007). Smithfield to Phase Out Crates. January 25, 2007. Accessed
July 29, 2007 at http://online.wsj.com/article/SB116969807556687337.html
Weng, Edwards, English (1998). Behavior, social interaction and lesion scores of group-
housed sows in relation to floor space allowance. Applied Animal Behavior Science 59,
1998, 307-316
Wozniak, R. H. (1997). Experimental and Comparative Roots of Early Behaviorism: An
Introduction. Bryn Mawr College. Accessed Aug 31, 2006 at
www.brynmawr.edu/Acads/Psych/rwozniak/roots.html
59. 59
How to read the table: The above tables are of elasticity of demand (demand curves). The fixed ratio
refers the amount of presses necessary to receive a stimulus (1-30 presses on a nose plate). The log values
refer to the kilogram of food eaten or number of times pigs worked for social contact or door opening. The
flatter the line the more the pig is willing to work for a stimulus and the steeper the line the more elastic is
the pigs demand for a stimulus. Food is least elastic (almost completely inelastic) while opening the door is
the most elastic leading even to stopping work for door opening at 30 presses in some cases.
Figure A.1. Demand function graphs presented by Matthews and Ladewig (1994)
61. 61
Average individual pig proportion of feed choice in the Y-maze
1.000.800.600.400.200.00
Frequency(numberofpigs)
15
10
5
0
5
3
4
3
5
4
7
2
15
Figure B.1. Number of pigs that chose feed in the Y-maze, classified in percentage
increments (i.e., 15 pigs chose feed in the Y-maze between 0.0 and 10% of the time when
measured across 12 testing days).
62. 62
Frequency(numberofpigs)
5
4
3
2
1
0
10
Average individual pig proportion of feed choice in the Y-maze
1.000.800.600.400.200.00
5
4
3
2
1
0
1.000.800.600.400.200.00
01
1
2
111
2
4
3
2
11
3
2
111
22
5
2
111
2
1
4
Feed restricted and Soical
restricted pigs (FR and SR)
Full Fed and Social Restricted
pigs (FF and SR)
Full Fed and Social Contact pigs
(FF and SC)
Feed Resticted and Social
Contact pigs (FR and SC)
Figure B.2. Number of pigs that chose feed in the Y-maze, classified in percentage
increments for each factor in the 2 × 2 factorial arrangement of treatments (i.e. 2 pigs
chose feed between 0.0 and 10% of the time when measured across 12 testing days in the
feed-restricted and socially-restricted subclass).
63. 63
Average individual pig proportion of feed choice in the Y-maze
1.000.800.600.400.200.00
Frequency(numberofpigs)
10
8
6
4
2
0
1.000.800.600.400.200.00
10
2
1
22
33
2
9
5
1
3
1
3
1
4
6
Feed Restricted Pigs Full Fed Pigs
Figure B.3. Number of pigs that chose feed in the Y-maze, classified in percentage
increments by the feed factor (i.e. 6 pigs chose feed between 0.0 and 10% of the time
when measured across 12 testing days in the feed-restricted subclass).
64. 64
Average individual pig proportion of feed choice in the Y-maze
1.000.800.600.400.200.00
Frequency(numberofpigs)
10
8
6
4
2
0
1.000.800.600.400.200.00
10
222
1
3
2
3
9
3
1
2222
4
2
6
Pigs having Social ContactSocial Restricted Pigs
Figure B.4. Number of pigs that chose feed in the Y-maze, classified in percentage
increments by the social factor (i.e. 6 pigs chose feed between 0.0 and 10% of the time
when measured across 12 testing days in the socially-restricted subclass).
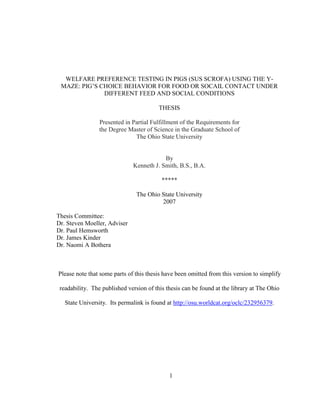
![2
CHAPTER 1
INTRODUCTION
The concept of animal welfare is not a new one. The earliest exhortations on
welfare of animals, in the West, are found in Judeo-Christian scripture from God
pronouncing creation good (Gen 1:31) and God knowing of the fate of the sparrow (Matt.
10:27) to the injunctions such as not boiling a kid in its dam’s milk (Deut. 14:21). In the
West, until the nineteenth century the best-known philosophical research and writing
about animals and how to treat them come from Aristotle and St. Thomas Aquinas. St.
Thomas Aquinas is often used to illustrate the view, held by a majority of people in
present-day societies and by almost everyone in the past that humans have dominion over
the animals and can use them for human wants and needs (food, medicine, clothing,
companionship, etc.). St. Thomas also believed that one should not be cruel to animals,
because “it is evident that if a man practices a pitiful affection for animals, he is all the
more disposed to take pity on his fellow-men [emphasis added]: wherefore it is written
(Proverbs 12:10): ‘The just regardeth the lives of his beasts: but the bowels of the wicked
are cruel’ (Aquinas, Summa Theologica II, I, Q102 Art. VI.). Thus, Aquinas believes that
we must treat animals humanely for the sake of our own humanity, not because animals](data:image/gif;base64,R0lGODlhAQABAIAAAAAAAP///yH5BAEAAAAALAAAAAABAAEAAAIBRAA7)