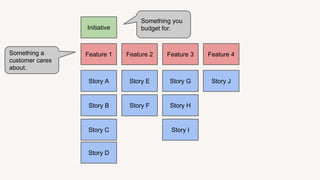
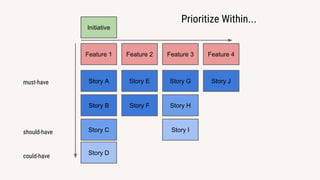
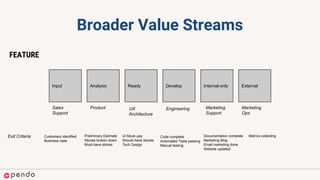
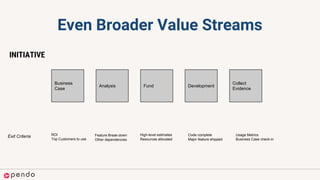
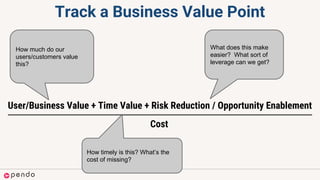
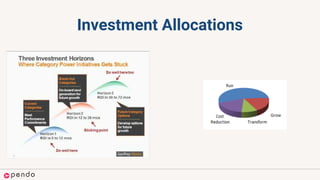
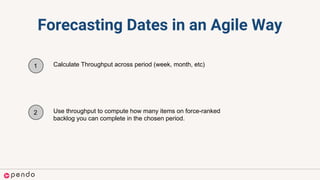
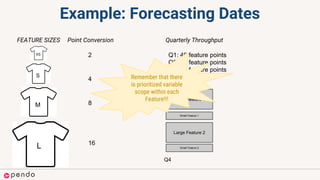
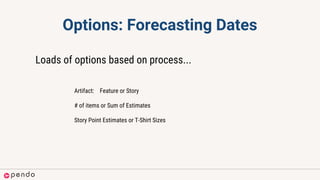
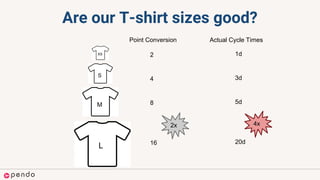
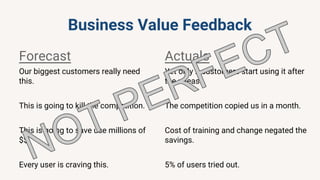
HELPING PEOPLE
CREATE GREAT PRODUCTS
Committing to $$ and Dates in an
Agile World
Todd Olson
www.pendo.io
First, a little about me
● CEO & Co-Founder, Pendo
Prior
● VP Products, Rally Software
● CTO / Co-Founder, 6th Sense Analytics
● Chief Scientist, Borland
● VP Development, TogetherSoft
● CTO / Co-Founder Cerebellum Software
Tweet @tolson
Don’t get run over. Change first.
Different Levels of
Abstraction
Feature 1 Feature 2 Feature 3 Feature 4
Story A
Story B
Story C
Story D
Story E
Story F
Story G
Story H
Story I
Story J
Initiative
Something a
customer cares
about.
Something you
budget for.
Feature 1 Feature 2 Feature 3 Feature 4
Story A
Story B
Story C
Story D
Story E
Story F
Story G
Story H
Story I
Story J
Initiative
Prioritize Within...
must-have
should-have
could-have
PRODUCT
Marketing
Support
Broader Value Streams
Input Analysis Ready Develop Internal-only External
Exit Criteria Preliminary Estimate
Stories broken down
Must-have stories
UI Mock-ups
Should-have stories
Tech Design
Code complete
Automated Tests passing
Manual testing
Documentation complete
Marketing Blog
Email marketing done
Website updated
Customers identified
Business case
Metrics collecting
FEATURE
Marketing
Support
Sales
Support
Product UX
Architecture
Engineering Marketing
Ops
Even Broader Value Streams
Business
Case
Analysis Fund Development
Collect
Evidence
Exit Criteria Feature Break-down
Other dependencies
High-level estimates
Resources allocated
Code complete
Major feature shipped
ROI
Top Customers to use
Usage Metrics
Business Case check-in
INITIATIVE
What does the Board care about?
&
How much..
Is a feature worth?
User/Business Value + Time Value + Risk Reduction / Opportunity Enablement
Cost
What does this make
easier? What sort of
leverage can we get?
How timely is this? What’s the
cost of missing?
How much do our
users/customers value
this?
Track a Business Value Point
Investment Allocations
Forecasting Dates in an Agile Way
1 Calculate Throughput across period (week, month, etc)
2 Use throughput to compute how many items on force-ranked
backlog you can complete in the chosen period.
Example: Forecasting Dates
XS
S
M
L
2
Point Conversion
4
8
16
Quarterly Throughput
Q1: 40 feature points
Q2: 38 feature points
Q3: 42 feature points
FEATURE SIZES
Q3
Q4
Large Feature 1
Small Feature 1
Small Feature 2
Remember that there
is prioritized variable
scope within each
Feature!!!
Large Feature 2
Options: Forecasting Dates
Loads of options based on process...
Artifact: Feature or Story
# of items or Sum of Estimates
Story Point Estimates or T-Shirt Sizes
INSPECT AND ADAPT
Are our T-shirt sizes good?
XS
S
M
L
2
Point Conversion Actual Cycle Times
1d
4 3d
8 5d
16 20d
2x 4x
Business Value Feedback
Forecast
Our biggest customers really need
this.
This is going to kill the competition.
This is going to save use millions of
$$.
Every user is craving this.
Actuals
Yet only 2 customers start using it after
the release.
The competition copied us in a month.
Cost of training and change negated the
savings.
5% of users tried out.
Measure everything
● Usage
○ By customer
○ By user
● Revenue
○ Sales cycle
○ Win-loss
● Cost-savings
● Customer Satisfaction
● Developer Satisfaction
● Support Tickets
● Forum posts
● Help searches
Continue your Agile Journey...
Start small…
Start with Features
HELPING PEOPLE
CREATE GREAT PRODUCTS
Questions?
www.pendo.io

Keeping up with Agilists

  • 1.
    HELPING PEOPLE CREATE GREATPRODUCTS Committing to $$ and Dates in an Agile World Todd Olson www.pendo.io
  • 2.
    First, a littleabout me ● CEO & Co-Founder, Pendo Prior ● VP Products, Rally Software ● CTO / Co-Founder, 6th Sense Analytics ● Chief Scientist, Borland ● VP Development, TogetherSoft ● CTO / Co-Founder Cerebellum Software Tweet @tolson
  • 4.
    Don’t get runover. Change first.
  • 7.
  • 8.
    Feature 1 Feature2 Feature 3 Feature 4 Story A Story B Story C Story D Story E Story F Story G Story H Story I Story J Initiative Something a customer cares about. Something you budget for.
  • 9.
    Feature 1 Feature2 Feature 3 Feature 4 Story A Story B Story C Story D Story E Story F Story G Story H Story I Story J Initiative Prioritize Within... must-have should-have could-have
  • 10.
  • 11.
    Broader Value Streams InputAnalysis Ready Develop Internal-only External Exit Criteria Preliminary Estimate Stories broken down Must-have stories UI Mock-ups Should-have stories Tech Design Code complete Automated Tests passing Manual testing Documentation complete Marketing Blog Email marketing done Website updated Customers identified Business case Metrics collecting FEATURE Marketing Support Sales Support Product UX Architecture Engineering Marketing Ops
  • 12.
    Even Broader ValueStreams Business Case Analysis Fund Development Collect Evidence Exit Criteria Feature Break-down Other dependencies High-level estimates Resources allocated Code complete Major feature shipped ROI Top Customers to use Usage Metrics Business Case check-in INITIATIVE
  • 13.
    What does theBoard care about?
  • 14.
  • 15.
    How much.. Is afeature worth?
  • 16.
    User/Business Value +Time Value + Risk Reduction / Opportunity Enablement Cost What does this make easier? What sort of leverage can we get? How timely is this? What’s the cost of missing? How much do our users/customers value this? Track a Business Value Point
  • 17.
  • 18.
    Forecasting Dates inan Agile Way 1 Calculate Throughput across period (week, month, etc) 2 Use throughput to compute how many items on force-ranked backlog you can complete in the chosen period.
  • 19.
    Example: Forecasting Dates XS S M L 2 PointConversion 4 8 16 Quarterly Throughput Q1: 40 feature points Q2: 38 feature points Q3: 42 feature points FEATURE SIZES Q3 Q4 Large Feature 1 Small Feature 1 Small Feature 2 Remember that there is prioritized variable scope within each Feature!!! Large Feature 2
  • 20.
    Options: Forecasting Dates Loadsof options based on process... Artifact: Feature or Story # of items or Sum of Estimates Story Point Estimates or T-Shirt Sizes
  • 21.
  • 22.
    Are our T-shirtsizes good? XS S M L 2 Point Conversion Actual Cycle Times 1d 4 3d 8 5d 16 20d 2x 4x
  • 23.
    Business Value Feedback Forecast Ourbiggest customers really need this. This is going to kill the competition. This is going to save use millions of $$. Every user is craving this. Actuals Yet only 2 customers start using it after the release. The competition copied us in a month. Cost of training and change negated the savings. 5% of users tried out.
  • 24.
    Measure everything ● Usage ○By customer ○ By user ● Revenue ○ Sales cycle ○ Win-loss ● Cost-savings ● Customer Satisfaction ● Developer Satisfaction ● Support Tickets ● Forum posts ● Help searches
  • 25.
  • 26.
  • 28.
    HELPING PEOPLE CREATE GREATPRODUCTS Questions? www.pendo.io