Download to read offline


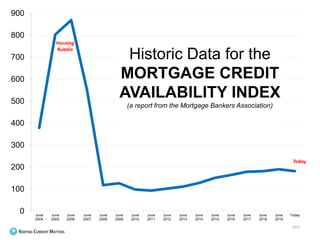
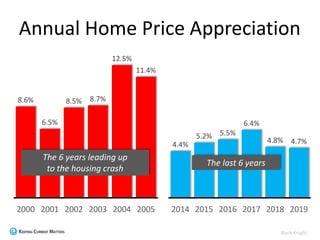
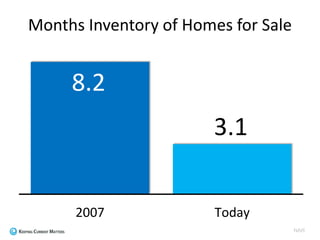
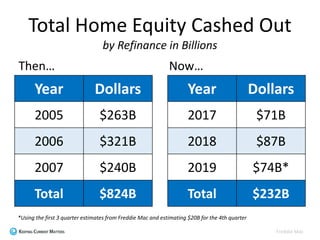
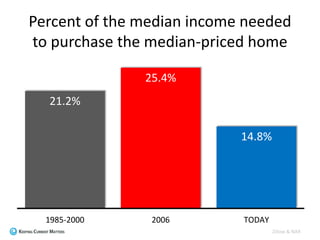

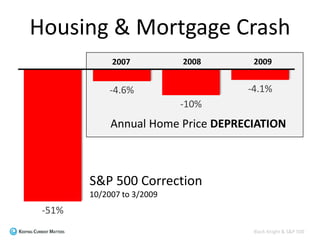

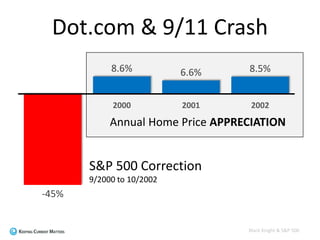


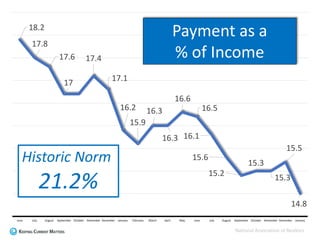


This document provides a summary of key housing market data and expert opinions on the potential economic impact of the COVID-19 pandemic. It shows data on home prices, inventory, and mortgage financing from 2000 to the present. Experts predict a recession but not a housing crisis, as the financial system remains sound, and a recovery in 2021. The document also notes measures by FHA and GSEs to limit foreclosures and evictions during this time.