Spike sars cov-2 protein as procoagulant factor and vaccine class effect hypo...
Justine McKittrick SURB poster 2015 FINAL
1. -700
-600
-500
-400
-300
-200
-100
0
0 5 10 15 20 25 30
WidthofScratch(pixels)
Time Post Scratch (Hours)
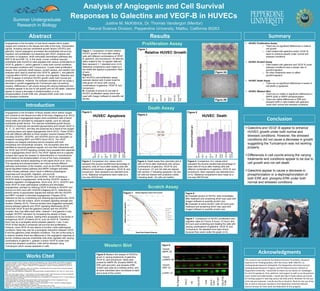
HUVEC Migration Rates Post Scratch
No Signals
GALS
GALS/VB
TUNI
GALS/TUNI
VB/TUNI
GALS/VB/TUNI
Analysis of Angiogenic and Cell Survival
Responses to Galectins and VEGF-B in HUVECs
Justine M. McKittrick, Dr. Thomas Vandergon (Mentor)
Natural Science Division, Pepperdine University, Malibu, California 90263
Abstract Results
Introduction
Works Cited
Acknowledgments
Summer Undergraduate
Research in Biology
D'Haene N, Sauvage S, Maris C, Adanja I, Le Mercier M, Decaestecker C, et al. (2013) VEGFR1 and VEGFR2 Involvement in
Extracellular Galectin-1- and Galectin-3-Induced Angiogenesis. PLoS ONE 8(6): e67029. doi:10.1371/journal.pone.0067029
Griffioen, Arjan W., and Victor L. Thijssen. “Galectins in Tumor Angiogenesis.” Annals of Translational Medicine 2.9 (2014): 90.
PMC. Web. 17 May 2015
Hagberg, C., A. Mehlem, A. Falkevall, L. Muhl, and U. Eriksson. "Endothelial Fatty Acid Transport: Role of Vascular Endothelial
Growth Factor B." Physiology 28.2 (2013): 125-34. Web.
Koch, Sina. "Neuropilin Signalling in Angiogenesis." Biochemical Society Transactions Biochem. Soc. Trans. 40.1 (2012): 20-25.
Web.
Koch, Sina, Sònia Tugues, Xiujuan Li, Laura Gualandi, and Lena Claesson-Welsh. "Signal Transduction by Vascular Endothelial
Growth Factor Receptors." Biochem. J. Biochemical Journal 437.2 (2011): 169-83. Web.
Li, Xuri, Anil Kumar, Fan Zhang, Chunsik Lee, and Zhongshu Tang. "Complicated Life, Complicated VEGF-B." Trends in Molecular
Medicine 18.2 (2012): 119-27. Web.
Lohela, Marja, Maija Bry, Tuomas Tammela, and Kari Alitalo. "VEGFs and Receptors Involved in Angiogenesis versus
Lymphangiogenesis." Current Opinion in Cell Biology 21.2 (2009): 154-65. Web.
Markowska, A. I., F.-T. Liu, and N. Panjwani. "Galectin-3 Is an Important Mediator of VEGF- and BFGF-mediated Angiogenic
Response." The Journal of Cell Biology 190.4 (2010): I12. Web.
Stanley, Pamela. "Galectin-1 Pulls the Strings on VEGFR2." Cell 156.4 (2014): 625-26. Web.
Thijssen, V. L., and A. W. Griffioen. "Galectin-1 and -9 in Angiogenesis: A Sweet Couple." Glycobiology 24.10 (2014): 915-20. Web.
Figure 6.
A.) Example picture of HUVEC cells immediately
after treatment and scratching which was used with
ImageJ software to quantify scratch size
B.) Example of same HUVEC cells 24 hours post
treatment and scratching which was used with
ImageJ software to quantify scratch size
Conclusion
Galectins and VEGF-B appear to enhance
HUVEC growth under both normal and
stressed conditions. However, the stressed
conditions did not cause a decrease in growth
suggesting the Tunicamycin was not working
properly
Differences in cell counts among the varying
treatments and conditions appear to be due to
cell growth and not cell death
Galectins appear to cause a decrease in
phosphorylation or a dephosphorylation of
both ERK and phospho-ERK under both
normal and stressed conditions
Summary
HUVEC Proliferation Assay
o There are no significant differences in relative
cell growth
o Cells treated with galectins and/or VEGF-B
seem to enhance growth under normal and
stressed conditions
HUVEC Scratch Assay
o Cells treated with galectins and VEGF-B under
stressed conditions have a slower rate of
growth/migration
o No other treatments seem to affect
growth/migration
HUVEC Death Assay
o There are no significant differences in levels of
cell death or apoptosis
HUVEC Western Blot
o There are no visible or significant differences in
MAPK (p38) or MAPK phosphorylation.
o There are visible differences in ERK and
phospho-ERK in cells treated with galectins
under both normal and stressed conditions
Figure 1. Comparison of mean relative
HUVEC growth 24 hours after treating
cells with different combinations of VEGF-
B, galectins, and tunicamycin. All data are
ratios scaled to the ‘no signals’ data set.
Bars represent ∓ 1 standard error (n=3).
Statistical comparisons were made by a
two-tailed test against a population mean
of zero.
Figure 2.
A.) HUVECs cell proliferation assay
example stained with Crystal Violet for
cells grown 24 hours with varying
combinations of galectins, VEGF-B, and
tunicamycin.
B.) Example of picture of one well of
HUVEC proliferation assay which was
used with ImageJ software to quantify cell
density.
Figure 4. Death assay flow cytometry plot of
cells 24 hours after treatments with various
combinations of galectins, VEGF-B, and
Tunicamycin. Q1 and Q2 cells are stained
with annexin V indicating apoptosis. Q2 and
Q4 cells are stained with propidium iodide
indicating death. Q3 cells are healthy.
This research was funded by the National Science Foundation, Research
Experience for Undergraduates, REU-Site Grant, #DBI-1062721, an
Undergraduate Research Fellowship, the Pepperdine University Summer
Undergraduate Research Program, and the Natural Science Division of
Pepperdine University. I would like to thank my my mentor Dr. Vandergon
for all of his guidance, time, patience, and support as well as my lab partners
Joyce Forbes and Caleb Stubbs. I would also like to thank Selena and Jonah
for lending support in learning various lab skills and Dr. Brewster for the use
of his lab and materials. I would also like to thank Dr. Plank for the use of her
lab, as well as everyone involved in the Pepperdine University Natural
Science Division for their work and dedication to this program.
Angiogenesis is the formation of new blood vessels which supply
oxygen and nutrients to the tissues and cells of the body. Glycoprotein
signals, including vascular endothelial growth factors (VEGFs) and
galectins, induce angiogenic processes like endothelial cell survival,
migration and proliferation by interacting with VEGF receptors and
neuropilin co-receptors, which stimulates downstream pathways like
MAP K 38 and ERK 1/2. In this study, human umbilical vascular
endothelial cells (HUVECs) were signaled with various combinations of
VEGF-B, galectin-1, and/or galectin-3 under both normal conditions
and stressed conditions with Tunicamycin. Crystal violet proliferation
assays, flow cytometry death assays, scratch assays, and western blot
analyses were used to examine how VEGF-B, galectin-1, and galectin-
3 signals affect HUVEC growth, survival, and migration. Galectins and
VEGF-B appear to enhance HUVEC growth under both normal and
stressed conditions. However, the stressed conditions did not cause a
decrease in growth suggesting the Tunicamycin was not working
properly. Differences in cell counts among the varying treatments and
conditions appear to be due to cell growth and not cell death. Galectins
appear to cause a decrease in phosphorylation or a de-
phosphorylation of both ERK and phospho-ERK under both normal
and stressed conditions.
Angiogenesis is the formation of blood vessels which deliver oxygen
and nutrients to the tissues and cells of the body (Hagberg et al. 2013).
The process of angiogenesis begins when endothelial cells of blood
vessel walls are activated by angiogenic signals, such as vascular
endothelial growth factors. The vascular endothelial growth factors
(VEGFs) in mammals are secreted glycoproteins and include VEGF-A,
-B, -C, -D, and PGLF, and they are produced as a result of low oxygen
in growing tissue and signal angiogenesis (Koch 2012). These VEGFs
bind with different affinities to three receptor tyrosine kinases (RTKs)
including VEGFR1, VEGFR2, and VEGFR3 and to two neuropilin co-
receptors including NRP1 and NRP2 (Koch 2012). The VEGF
receptors are integral membrane bound receptors with both
intracellular and extracellular domains. The neuropilins were first
identified as neuronal guidance signals, but now their interactions with
the VEGF and VEGFR signaling complex have revealed their essential
role in angiogenesis (Koch 2012).The VEGF signals bind to a specific
receptor and cause the receptor to heterodimerize or homodimerize
which leads to the phosphorylation of one of the many intracellular
tyrosine kinase domains depending on the signal (Koch et al. 2011).
This signaling and phosphorylation can induce several different
pathways downstream of the receptor, such as the ERK (extracellular
signal-regulated kinase) pathway and MAPK (mitogen-activated
protein kinase) pathway, which result in different physiological
responses such as growth, migration, and survival.
VEGF-A binds both VEGFR1 and VEGFR2. VEGF-A binding to
VEGFR2 leads to angiogenesis, while binding VEGFR1 causes a
negative regulation of angiogenesis. (Koch et al. 2011). VEGFR1 also
binds VEGF-B under pathological conditions and stimulates
angiogenesis, perhaps by reducing VEGF-A binding to VEGFR1 and
forcing it to bind more with VEGFR2 (Hagberg 2013). Galectins are
another family of glycoprotein signals that interact with the VEGFR1
and NRP1 complex to stimulate angiogenesis (Thijssen 2014).
Galectins do this by crosslinking and retaining glycoproteins like VEGF
receptors on the cell surface, which increases signaling strength and
duration (Stanley 2014). Previous studies have suggested synergistic
actions between galectin and VEGF signaling (Markowska 2010).
Since both VEGF-B and the galectins interact with the VEGFR1
complex, they may affect each other. Galectin-1 and galectin-3 may
mediate VEGFR1 activation by increasing the density of these
receptors on the cell surface, making them accessible to low levels of
endogenous VEGF (D’Haene 2013), such as VEGF-B. Therefore,
there may be a synergistic action between galectin-1 and -3 and
VEGF-B that results in enhanced cell survival and proliferation.
However, since VEGF-B only seems to function under pathological
conditions, there may only be a synergistic interaction between VEGF-
B and the galectins under stressed conditions. The aim of this study is
to explore whether there are differences in the angiogenic response of
human umbilical vascular endothelial cells when signaled with varying
combinations of galectin-1, galectin-3 and/or VEGF-B under both
normal and stressed conditions. Cells will be stressed using
Tunicamycin which causes apoptosis in cells.
Figure 1
Figure 2A
Q1 Q2
Q3 Q4
Figure 4
Figure 3 Figure 5
Figure 6B
Figure 7. Comparison of HUVEC proliferation and
migration rates at 0 hours, 6 hours, 12 hours, and
24 hours post scratching and treating the cells with
varying combinations of galectins, VEGF-B, and
Tunicamycin. No standard error bars shown
because they would clutter the graph (n=3).
Figure 8.Western blot assays of HUVECs
grown in varying treatments of galectins,
VEGF-B, and tunicamycin. Blots were
probed for MAPK 38, phospho-MAPK 38,
ERK (p42 and p44), and phospho-ERK.
Tubulin was used as a loading control, and
all band intensities were normalized to each
lane’s level of the control.
Figure 8
Figure 7
Figure 2B
Figure 3. Comparison of p’ values which
represent the arcsine transformed percentage of
apoptotic cells 24 hours after treating cells with
different combinations of galectins, VEGF-B, and
tunicamycin. Bars represent one standard error
(n=3). Statistical comparisons were made by a
one-way ANOVA test.
Figure 5. Comparison of p’ values which
represent the arcsine transformed percentage of
dead cells 24 hours after treating cells with
different combinations of galectins, VEGF-B, and
tunicamycin. Bars represent one standard error
(n=3). Statistical comparisons were made by a
one-way ANOVA test.
Proliferation Assay
Tubulin
MAPK 38
Tubulin
p-MAPK 38
Tubulin
ERK 1/2
p-ERK 1/2
NoSignals
GALS
VB
GALS/VB
TUNI
GALS/
TUNI
VB/TUNI
GALS/VB
/TUNI
Death Assay
Scratch Assay
Western Blot
Relative HUVEC Growth
IntegratedDensityRatio
NoSignals
GALS
VB
GALS/VB
TUNI
GALS/
TUNI
VB/TUNI
GALS/VB/
TUNI
HUVEC Apoptosis HUVEC Death
No
Signals
GALS
VB
GALS/
VB
TUNI
GALS/
TUNI
VB/TUNI
GALS/
VB/TUNI
No
Signals
GALS
VB
GALS/
VB
TUNI
GALS/
TUNI
VB/TUNI
GALS/
VB/TUNI
AmountofDeath(p’)
AmountofApoptosis(p’)
Figure 6A