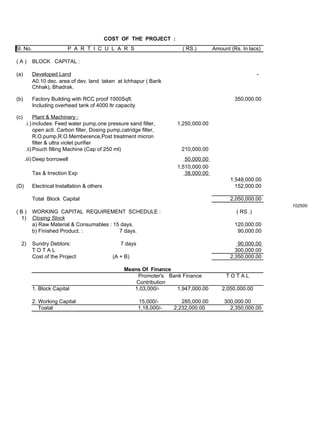
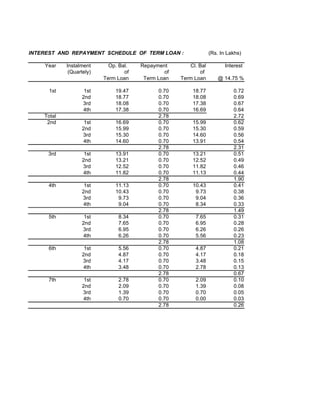
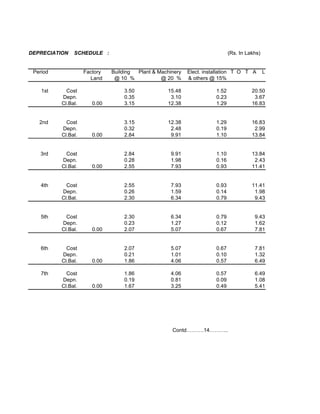
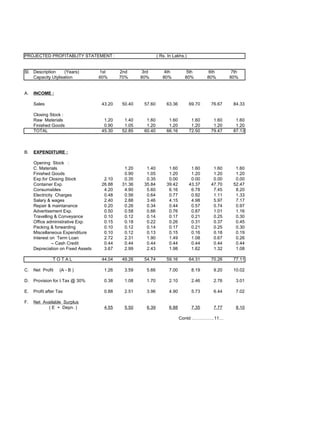
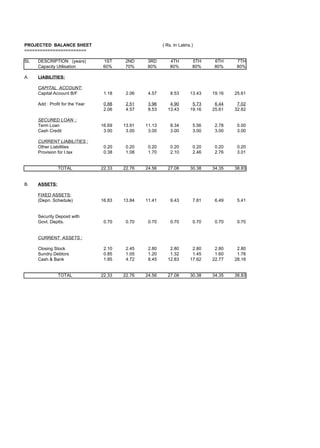
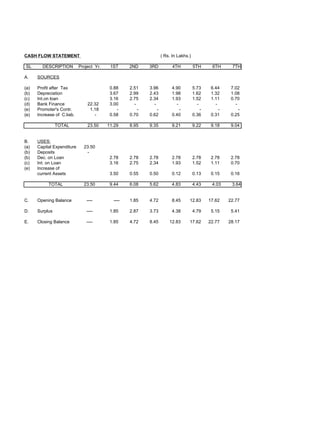
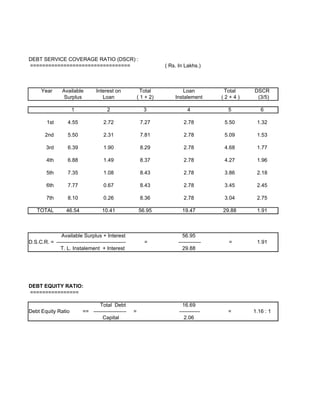
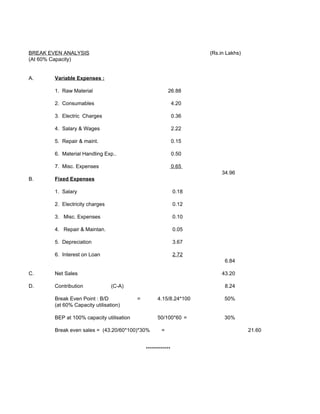
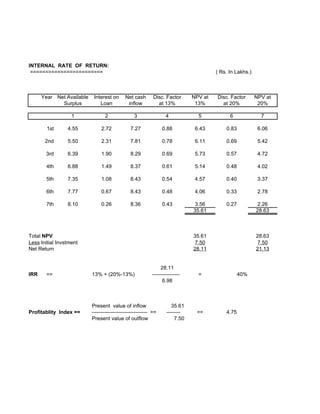
SlideShare a Scribd company logo
1 of 11
COST OF THE PROJECT :
Sl. No.                   P A R T I C U L A R S                            ( RS.)       Amount (Rs. In lacs)

(A)       BLOCK CAPITAL :

(a)       Developed Land                                                                                    -
          A0.10 dec. area of dev. land taken at Ichhapur ( Barik
          Chhak), Bhadrak.

(b)       Factory Building with RCC proof 1000Sqft.                                              350,000.00
          Including overhead tank of 4000 ltr capacity

(c)        Plant & Machinery :
      .i.) includes: Feed water pump,one pressure sand filter,           1,250,000.00
           open acti. Carbon filter, Dosing pump,catridge filter,
           R.O.pump,R.O.Memberence,Post treatment micron
           filter & ultra violet purifier
      .ii) Pouch filling Machine (Cap of 250 ml)                          210,000.00
      .iii) Deep borrowell                                                  50,000.00
                                                                         1,510,000.00
          Tax & Irrection Exp                                               38,000.00
                                                                                               1,548,000.00
(D)       Electrical Installation & others                                                       152,000.00

          Total Block Capital                                                                  2,050,000.00
                                                                                                                102500
(B)       WORKING CAPITAL REQUIREMENT SCHEDULE :                                                  ( RS .)
 1)       Closing Stock
          a) Raw Material & Consumables : 15 days.                                               120,000.00
          b) Finished Product. :            7 days.                                               90,000.00

  2)      Sundry Debtors:                         7 days                                          90,000.00
          TOTAL                                                                                  300,000.00
          Cost of the Project                  (A + B)                                         2,350,000.00

                                                   Means Of Finance
                                                       Promoter's Bank Finance               TOTAL
                                                       Contribution
          1. Block Capital                            1,03,000/-     1,947,000.00           2,050,000.00

          2. Working Capital                               15,000/-        285,000.00       300,000.00
             Toatal                                        1,18,000/-   2,232,000.00          2,350,000.00
Bank int.              110000
electr & others         42000
                       152000


              329220
              109740
INTEREST AND REPAYMENT SCHEDULE OF TERM LOAN :                   (Rs. In Lakhs)

    Year    Instalment      Op. Bal.   Repayment       Cl. Bal          Interest
             (Quartely)           of           of          of
                          Term Loan     Term Loan   Term Loan        @ 14.75 %

      1st           1st       19.47          0.70       18.77              0.72
                   2nd        18.77          0.70       18.08              0.69
                   3rd        18.08          0.70       17.38              0.67
                   4th        17.38          0.70       16.69              0.64
    Total                                    2.78                          2.72
     2nd            1st       16.69          0.70       15.99              0.62
                   2nd        15.99          0.70       15.30              0.59
                   3rd        15.30          0.70       14.60              0.56
                   4th        14.60          0.70       13.91              0.54
                                             2.78                          2.31
     3rd            1st       13.91          0.70       13.21              0.51
                   2nd        13.21          0.70       12.52              0.49
                   3rd        12.52          0.70       11.82              0.46
                   4th        11.82          0.70       11.13              0.44
                                             2.78                          1.90
     4th            1st       11.13          0.70       10.43              0.41
                   2nd        10.43          0.70        9.73              0.38
                   3rd         9.73          0.70        9.04              0.36
                   4th         9.04          0.70        8.34              0.33
                                             2.78                          1.49
     5th            1st        8.34          0.70        7.65              0.31
                   2nd         7.65          0.70        6.95              0.28
                   3rd         6.95          0.70        6.26              0.26
                   4th         6.26          0.70        5.56              0.23
                                             2.78                          1.08
     6th            1st        5.56          0.70        4.87              0.21
                   2nd         4.87          0.70        4.17              0.18
                   3rd         4.17          0.70        3.48              0.15
                   4th         3.48          0.70        2.78              0.13
                                             2.78                          0.67
     7th            1st        2.78          0.70        2.09              0.10
                   2nd         2.09          0.70        1.39              0.08
                   3rd         1.39          0.70        0.70              0.05
                   4th         0.70          0.70        0.00              0.03
                                             2.78                          0.26
3.69


       69535.71
DEPRECIATION   SCHEDULE :                                                    (Rs. In Lakhs)


 Period             Factory   Building Plant & Machinery   Elect. installation T O T A        L
                      Land     @ 10 %           @ 20 %     & others @ 15%

    1st     Cost                  3.50             15.48              1.52             20.50
          Depn.                   0.35              3.10              0.23              3.67
          Cl.Bal.      0.00       3.15             12.38              1.29             16.83


   2nd      Cost                  3.15             12.38              1.29             16.83
          Depn.                   0.32              2.48              0.19              2.99
          Cl.Bal.      0.00       2.84              9.91              1.10             13.84


    3rd     Cost                  2.84              9.91              1.10             13.84
          Depn.                   0.28              1.98              0.16              2.43
          Cl.Bal.      0.00       2.55              7.93              0.93             11.41


    4th     Cost                  2.55              7.93              0.93             11.41
          Depn.                   0.26              1.59              0.14              1.98
          Cl.Bal.                 2.30              6.34              0.79              9.43


    5th     Cost                  2.30              6.34              0.79              9.43
          Depn.                   0.23              1.27              0.12              1.62
          Cl.Bal.      0.00       2.07              5.07              0.67              7.81


    6th     Cost                  2.07              5.07              0.67              7.81
          Depn.                   0.21              1.01              0.10              1.32
          Cl.Bal.      0.00       1.86              4.06              0.57              6.49

    7th     Cost                  1.86              4.06              0.57              6.49
          Depn.                   0.19              0.81              0.09              1.08
          Cl.Bal.      0.00       1.67              3.25              0.49              5.41


                                                    Contd……….14………..
PROJECTED PROFITABLITY STATEMENT :                             ( Rs. In Lakhs.)


Sl. Description     (Years)         1st      2nd       3rd         4th         5th         6th      7th
    Capacity Utylisation            60%      70%      80%         80%         80%         80%      80%


A.   INCOME :

     Sales                           43.20    50.40    57.60        63.36         69.70    76.67    84.33

     Closing Stock :
     Raw Materials                    1.20     1.40     1.60         1.60          1.60     1.60     1.60
     Finished Goods                   0.90     1.05     1.20         1.20          1.20     1.20     1.20
     TOTAL                           45.30    52.85    60.40        66.16         72.50    79.47    87.13


B.   EXPENDITURE :

     Opening Stock :
     C. Materials                              1.20     1.40         1.60          1.60     1.60     1.60
     Finished Goods                            0.90     1.05         1.20          1.20     1.20     1.20
     Exp.for Closing Stock            2.10     0.35     0.35         0.00          0.00     0.00     0.00
     Container Exp.                  26.88    31.36    35.84        39.42         43.37    47.70    52.47
     Consumables                      4.20     4.90     5.60         6.16          6.78     7.45     8.20
     Electricity Charges              0.48     0.56     0.64         0.77          0.92     1.11     1.33
     Salary & wages                   2.40     2.88     3.46         4.15          4.98     5.97     7.17
     Repair & maintanance             0.20     0.26     0.34         0.44          0.57     0.74     0.97
     Advertisement Exp.               0.50     0.58     0.66         0.76          0.87     1.01     1.16
     Travelling & Conveyance          0.10     0.12     0.14         0.17          0.21     0.25     0.30
     Office administrative Exp.       0.15     0.18     0.22         0.26          0.31     0.37     0.45
     Packing & forwarding             0.10     0.12     0.14         0.17          0.21     0.25     0.30
     Miscellaneous Expenditure        0.10     0.12     0.13         0.15          0.16     0.18     0.19
     Interest on Term Loan            2.72     2.31     1.90         1.49          1.08     0.67     0.26
               -- Cash Credit         0.44     0.44     0.44         0.44          0.44     0.44     0.44
     Depreciation on Fixed Assets     3.67     2.99     2.43         1.98          1.62     1.32     1.08

               TOTAL                 44.04    49.26    54.74        59.16         64.31    70.26    77.11

C.   Net Profit    (A - B )           1.26     3.59     5.66         7.00          8.19     9.20    10.02

D.   Provision for I.Tax @ 30%        0.38     1.08     1.70         2.10          2.46     2.76     3.01

E.   Profit after Tax                 0.88     2.51     3.96         4.90          5.73     6.44     7.02

F.   Net Available Surplus
           ( E + Depn. )              4.55     5.50     6.39         6.88          7.35     7.77     8.10

                                                                            Contd ……………11…
PROJECTED BALANCE SHEET                                  ( Rs. In Lakhs.)
========================

SL   DESCRIPTION (years)          1ST     2ND     3RD       4TH         5TH     6TH     7TH
     Capacity Utilisation         60%     70%     80%       80%         80%     80%     80%

A.   LIABILITIES:

     CAPITAL ACCOUNT:
     Capital Account B/F          1.18    2.06    4.57       8.53      13.43   19.16   25.61

     Add : Profit for the Year    0.88    2.51    3.96      4.90        5.73    6.44    7.02
                                  2.06    4.57    8.53     13.43       19.16   25.61   32.62

     SECURED LOAN :
     Term Loan                   16.69   13.91   11.13       8.34       5.56    2.78    0.00
     Cash Credit                  3.00    3.00    3.00       3.00       3.00    3.00    3.00

     CURRENT LIABILITIES :
     Other Liabilities            0.20    0.20    0.20       0.20       0.20    0.20    0.20
     Provision for I.tax          0.38    1.08    1.70       2.10       2.46    2.76    3.01


               TOTAL             22.33   22.76   24.56     27.08       30.38   34.35   38.83


B.   ASSETS:

     FIXED ASSETS:
     (Depn. Schedule)            16.83   13.84   11.41       9.43       7.81    6.49    5.41


     Security Deposit with
     Govt. Deptts.                0.70    0.70    0.70       0.70       0.70    0.70    0.70


     CURRENT ASSETS :

     Closing Stock                2.10    2.45    2.80      2.80        2.80    2.80    2.80
     Sundry Debtors               0.85    1.05    1.20      1.32        1.45    1.60    1.76
     Cash & Bank                  1.85    4.72    8.45     12.83       17.62   22.77   28.16


               TOTAL             22.33   22.76   24.56     27.08       30.38   34.35   38.83
CASH FLOW STATEMENT                                                ( Rs. In Lakhs.)

SL      DESCRIPTION         Project Yr.    1ST     2ND     3RD           4TH          5TH      6TH      7TH

A.    SOURCES

(a)   Profit after Tax                     0.88    2.51    3.96          4.90         5.73     6.44     7.02
(b)   Depreciation                         3.67    2.99    2.43          1.98         1.62     1.32     1.08
(c)   Int.on loan                          3.16    2.75    2.34          1.93         1.52     1.11     0.70
(d)   Bank Finance              22.32      3.00      -       -             -            -        -        -
(e)   Promoter's Contr.          1.18         -        -       -             -            -        -        -
(e)   Increase of C.liab.          -       0.58    0.70    0.62          0.40         0.36     0.31     0.25

                TOTAL           23.50     11.29    8.95    9.35          9.21         9.22     9.18     9.04


B.    USES:
(a)   Capital Expenditure     23.50
(b)   Deposits                 -
(b)   Dec. on Loan                         2.78    2.78    2.78          2.78         2.78     2.78     2.78
(c)   Int. on Loan                         3.16    2.75    2.34          1.93         1.52     1.11     0.70
(e)   Increase of
      current Assets                       3.50    0.55    0.50          0.12         0.13     0.15     0.16

           TOTAL              23.50        9.44    6.08    5.62          4.83         4.43     4.03     3.64


C.    Opening Balance           ----        ----   1.85    4.72          8.45     12.83       17.62    22.77

D.    Surplus                   ----       1.85    2.87    3.73          4.38         4.79     5.15     5.41

E.    Closing Balance           ----       1.85    4.72    8.45        12.83      17.62       22.77    28.17
DEBT SERVICE COVERAGE RATIO (DSCR) :
=================================                                     ( Rs. In Lakhs.)


      Year       Available         Interest on               Total            Loan          Total   DSCR
                  Surplus             Loan                 ( 1 + 2)       Instalement      (2+4)     (3/5)

                      1                  2                    3                 4            5         6

         1st        4.55               2.72                 7.27              2.78          5.50     1.32

        2nd         5.50               2.31                 7.81              2.78          5.09     1.53

         3rd        6.39               1.90                 8.29              2.78          4.68     1.77

         4th        6.88               1.49                 8.37              2.78          4.27     1.96

         5th        7.35               1.08                 8.43              2.78          3.86     2.18

         6th        7.77               0.67                 8.43              2.78          3.45     2.45

         7th        8.10               0.26                 8.36              2.78          3.04     2.75

    TOTAL          46.54              10.41                56.95             19.47         29.88     1.91


              Available Surplus + Interest                                   56.95
D.S.C.R. = -----------------------------------------          =            -------------     =       1.91
             T. L. Instalement + Interest                                    29.88


DEBT EQUITY RATIO:
================

                                   Total Debt                                 16.69
Debt Equity Ratio           == -------------------     =                    ------------     =      1.16 : 1
                                    Capital                                    2.06
BREAK EVEN ANALYSIS                                                  (Rs.in Lakhs)
(At 60% Capacity)


A.      Variable Expenses :

        1. Raw Material                                   26.88

        2. Consumables                                        4.20

        3. Electric Charges                                   0.36

        4. Salary & Wages                                     2.22

        5. Repair & maint.                                    0.15

        6. Material Handling Exp..                            0.50

        7. Misc. Expenses                                     0.65
                                                                          34.96
B.      Fixed Expenses

        1. Salary                                             0.18

        2. Electricity charges                                0.12

        3. Misc. Expenses                                     0.10

        4. Repair & Maintan.                                  0.05

        5. Depreciation                                       3.67

        6. Interest on Loan                                   2.72
                                                                           6.84

C.      Net Sales                                                         43.20

D.      Contribution             (C-A)                                     8.24

        Break Even Point : B/D             =        4.15/8.24*100          50%
        (at 60% Capacity utilisation)

        BEP at 100% capacity utilisation            50/100*60 =            30%

        Break even sales = (43.20/60*100)*30%         =                              21.60


                                               ************
INTERNAL RATE OF RETURN:
 ========================                                                              ( Rs. In Lakhs.)


      Year Net Available    Interest on      Net cash       Disc. Factor      NPV at   Disc. Factor       NPV at
             Surplus           Loan           inflow          at 13%           13%       at 20%            20%

                   1              2              3                4             5            6              7

        1st      4.55           2.72           7.27              0.88          6.43        0.83            6.06

       2nd       5.50           2.31           7.81              0.78          6.11        0.69            5.42

       3rd       6.39           1.90           8.29              0.69          5.73        0.57            4.72

       4th       6.88           1.49           8.37              0.61          5.14        0.48            4.02

       5th       7.35           1.08           8.43              0.54          4.57        0.40            3.37

       6th       7.77           0.67           8.43              0.48          4.06        0.33            2.78

       7th       8.10           0.26           8.36              0.43          3.56        0.27           2.26
                                                                              35.61                       28.63


Total NPV                                                                     35.61                       28.63
Less Initial Invstment                                                         7.50                       7.50
Net Return                                                                    28.11                       21.13


                                                                28.11
IRR    ==                  13% + (20%-13%)                 ----------------     =                 40%
                                                                 6.98


                           Present value of inflow                    35.61
Profitablity Index ==      -------------------------------- ==     --------    ==          4.75
                           Present value of outflow                    7.50

More Related Content

Viewers also liked

Himalayan mineral water
Himalayan mineral water Himalayan mineral water
Himalayan mineral water Malcolm Pinto
 
Evaluation, Question one - Magazine cover
Evaluation, Question one - Magazine coverEvaluation, Question one - Magazine cover
Evaluation, Question one - Magazine coverrachie1234
 
Top ten horror movies
Top ten horror moviesTop ten horror movies
Top ten horror moviesallsaints1
 
Is time running out_on_the_billable_hour
Is time running out_on_the_billable_hourIs time running out_on_the_billable_hour
Is time running out_on_the_billable_hourMichael Carabash
 
Fernando Meirelles (Pesquisa)
Fernando Meirelles (Pesquisa)Fernando Meirelles (Pesquisa)
Fernando Meirelles (Pesquisa)Sérgio Ventura
 
Ellis Patents 1FP12SS FP Cable Cleat 16-19mm - Fire Resistant Cable Clamp
Ellis Patents 1FP12SS FP Cable Cleat 16-19mm - Fire Resistant Cable ClampEllis Patents 1FP12SS FP Cable Cleat 16-19mm - Fire Resistant Cable Clamp
Ellis Patents 1FP12SS FP Cable Cleat 16-19mm - Fire Resistant Cable ClampThorne & Derrick International
 
Put your clients in the middle of the(finished)
Put your clients in the middle of the(finished)Put your clients in the middle of the(finished)
Put your clients in the middle of the(finished)RandyBett
 
Academic letterofrecommendationwilliamsarsfield
Academic letterofrecommendationwilliamsarsfieldAcademic letterofrecommendationwilliamsarsfield
Academic letterofrecommendationwilliamsarsfieldIndependent Contractor
 
Bluesign standard brochuere_en_
Bluesign standard brochuere_en_Bluesign standard brochuere_en_
Bluesign standard brochuere_en_FerreHogar
 

Viewers also liked (20)

Himalayan mineral water
Himalayan mineral water Himalayan mineral water
Himalayan mineral water
 
Mineral water plant
Mineral  water plantMineral  water plant
Mineral water plant
 
Evaluation, Question one - Magazine cover
Evaluation, Question one - Magazine coverEvaluation, Question one - Magazine cover
Evaluation, Question one - Magazine cover
 
Rival water companies
Rival water companiesRival water companies
Rival water companies
 
Bohle-530
Bohle-530Bohle-530
Bohle-530
 
Story
StoryStory
Story
 
Top ten horror movies
Top ten horror moviesTop ten horror movies
Top ten horror movies
 
Is time running out_on_the_billable_hour
Is time running out_on_the_billable_hourIs time running out_on_the_billable_hour
Is time running out_on_the_billable_hour
 
Fernando Meirelles (Pesquisa)
Fernando Meirelles (Pesquisa)Fernando Meirelles (Pesquisa)
Fernando Meirelles (Pesquisa)
 
Ellis Patents 1FP12SS FP Cable Cleat 16-19mm - Fire Resistant Cable Clamp
Ellis Patents 1FP12SS FP Cable Cleat 16-19mm - Fire Resistant Cable ClampEllis Patents 1FP12SS FP Cable Cleat 16-19mm - Fire Resistant Cable Clamp
Ellis Patents 1FP12SS FP Cable Cleat 16-19mm - Fire Resistant Cable Clamp
 
Put your clients in the middle of the(finished)
Put your clients in the middle of the(finished)Put your clients in the middle of the(finished)
Put your clients in the middle of the(finished)
 
Job roles
Job rolesJob roles
Job roles
 
Fernando
FernandoFernando
Fernando
 
Club Guaf
Club GuafClub Guaf
Club Guaf
 
Academic letterofrecommendationwilliamsarsfield
Academic letterofrecommendationwilliamsarsfieldAcademic letterofrecommendationwilliamsarsfield
Academic letterofrecommendationwilliamsarsfield
 
Evaluation for blog
Evaluation for blogEvaluation for blog
Evaluation for blog
 
7x7 Prestadero
7x7 Prestadero7x7 Prestadero
7x7 Prestadero
 
7x7 clinica cuidate
7x7 clinica cuidate7x7 clinica cuidate
7x7 clinica cuidate
 
7x7 yogome
7x7 yogome7x7 yogome
7x7 yogome
 
Bluesign standard brochuere_en_
Bluesign standard brochuere_en_Bluesign standard brochuere_en_
Bluesign standard brochuere_en_
 

Similar to Julee mineral water

Business Plan - Setup A Jeans Factory
Business Plan - Setup A Jeans FactoryBusiness Plan - Setup A Jeans Factory
Business Plan - Setup A Jeans FactoryVinay Prajapati
 
3. Seastar 6.5ha Construction Cost Data
3. Seastar 6.5ha   Construction Cost Data3. Seastar 6.5ha   Construction Cost Data
3. Seastar 6.5ha Construction Cost Dataericbali
 
Energy, carbon, climate, action
Energy, carbon, climate, actionEnergy, carbon, climate, action
Energy, carbon, climate, actionRobert Cormia
 
Rpt formno16 fy201011 (1)
Rpt formno16 fy201011 (1)Rpt formno16 fy201011 (1)
Rpt formno16 fy201011 (1)imkartik93
 
Cache Creek Oklahoma Executive Summary
Cache Creek Oklahoma Executive SummaryCache Creek Oklahoma Executive Summary
Cache Creek Oklahoma Executive Summarystarr0167
 
Project Npv
Project NpvProject Npv
Project Npvwrdiehl
 
แนวทางการดำเนินงานกองทุนฟื้นฟูสมรรถภาพทางการแพทย์ โดย ดร.ทพ.วิรัตน์ เอื้องพูล...
แนวทางการดำเนินงานกองทุนฟื้นฟูสมรรถภาพทางการแพทย์ โดย ดร.ทพ.วิรัตน์ เอื้องพูล...แนวทางการดำเนินงานกองทุนฟื้นฟูสมรรถภาพทางการแพทย์ โดย ดร.ทพ.วิรัตน์ เอื้องพูล...
แนวทางการดำเนินงานกองทุนฟื้นฟูสมรรถภาพทางการแพทย์ โดย ดร.ทพ.วิรัตน์ เอื้องพูล...Nithimar Or
 
Line by environment interaction, yield stability and grouping of test locatio...
Line by environment interaction, yield stability and grouping of test locatio...Line by environment interaction, yield stability and grouping of test locatio...
Line by environment interaction, yield stability and grouping of test locatio...ILRI
 
SPICE MODEL of ZR6_RL=8.2(Ohm) in SPICE PARK
SPICE MODEL of ZR6_RL=8.2(Ohm) in SPICE PARKSPICE MODEL of ZR6_RL=8.2(Ohm) in SPICE PARK
SPICE MODEL of ZR6_RL=8.2(Ohm) in SPICE PARKTsuyoshi Horigome
 
03b Bri 3 Year Monthly Forcasts Y1
03b Bri   3 Year Monthly Forcasts Y103b Bri   3 Year Monthly Forcasts Y1
03b Bri 3 Year Monthly Forcasts Y1Thomas J. Lewis
 
RNP Meeting - January 27th 2013
RNP Meeting - January 27th 2013RNP Meeting - January 27th 2013
RNP Meeting - January 27th 2013radionorthwickpark
 
Your Dream Plot In Haridwar : Octagon vista Haridwar
Your Dream Plot In Haridwar : Octagon vista HaridwarYour Dream Plot In Haridwar : Octagon vista Haridwar
Your Dream Plot In Haridwar : Octagon vista HaridwarDna Real Estate Pvt. Ltd.
 

Similar to Julee mineral water (20)

Business Plan - Setup A Jeans Factory
Business Plan - Setup A Jeans FactoryBusiness Plan - Setup A Jeans Factory
Business Plan - Setup A Jeans Factory
 
Sabrina olivares
Sabrina olivaresSabrina olivares
Sabrina olivares
 
Muni
MuniMuni
Muni
 
Cipla 20-09-2010
Cipla   20-09-2010Cipla   20-09-2010
Cipla 20-09-2010
 
3. Seastar 6.5ha Construction Cost Data
3. Seastar 6.5ha   Construction Cost Data3. Seastar 6.5ha   Construction Cost Data
3. Seastar 6.5ha Construction Cost Data
 
Energy, carbon, climate, action
Energy, carbon, climate, actionEnergy, carbon, climate, action
Energy, carbon, climate, action
 
Design Project
Design ProjectDesign Project
Design Project
 
Rpt formno16 fy201011 (1)
Rpt formno16 fy201011 (1)Rpt formno16 fy201011 (1)
Rpt formno16 fy201011 (1)
 
Cache Creek Oklahoma Executive Summary
Cache Creek Oklahoma Executive SummaryCache Creek Oklahoma Executive Summary
Cache Creek Oklahoma Executive Summary
 
Metrado de madera
Metrado de maderaMetrado de madera
Metrado de madera
 
Project Npv
Project NpvProject Npv
Project Npv
 
แนวทางการดำเนินงานกองทุนฟื้นฟูสมรรถภาพทางการแพทย์ โดย ดร.ทพ.วิรัตน์ เอื้องพูล...
แนวทางการดำเนินงานกองทุนฟื้นฟูสมรรถภาพทางการแพทย์ โดย ดร.ทพ.วิรัตน์ เอื้องพูล...แนวทางการดำเนินงานกองทุนฟื้นฟูสมรรถภาพทางการแพทย์ โดย ดร.ทพ.วิรัตน์ เอื้องพูล...
แนวทางการดำเนินงานกองทุนฟื้นฟูสมรรถภาพทางการแพทย์ โดย ดร.ทพ.วิรัตน์ เอื้องพูล...
 
Economia IC part B
Economia IC part BEconomia IC part B
Economia IC part B
 
Line by environment interaction, yield stability and grouping of test locatio...
Line by environment interaction, yield stability and grouping of test locatio...Line by environment interaction, yield stability and grouping of test locatio...
Line by environment interaction, yield stability and grouping of test locatio...
 
SPICE MODEL of ZR6_RL=8.2(Ohm) in SPICE PARK
SPICE MODEL of ZR6_RL=8.2(Ohm) in SPICE PARKSPICE MODEL of ZR6_RL=8.2(Ohm) in SPICE PARK
SPICE MODEL of ZR6_RL=8.2(Ohm) in SPICE PARK
 
03b Bri 3 Year Monthly Forcasts Y1
03b Bri   3 Year Monthly Forcasts Y103b Bri   3 Year Monthly Forcasts Y1
03b Bri 3 Year Monthly Forcasts Y1
 
RNP Meeting - January 27th 2013
RNP Meeting - January 27th 2013RNP Meeting - January 27th 2013
RNP Meeting - January 27th 2013
 
Your Dream Plot In Haridwar : Octagon vista Haridwar
Your Dream Plot In Haridwar : Octagon vista HaridwarYour Dream Plot In Haridwar : Octagon vista Haridwar
Your Dream Plot In Haridwar : Octagon vista Haridwar
 
Daily report
Daily reportDaily report
Daily report
 
Ts0011725632
Ts0011725632Ts0011725632
Ts0011725632
 

Julee mineral water

  • 1. COST OF THE PROJECT : Sl. No. P A R T I C U L A R S ( RS.) Amount (Rs. In lacs) (A) BLOCK CAPITAL : (a) Developed Land - A0.10 dec. area of dev. land taken at Ichhapur ( Barik Chhak), Bhadrak. (b) Factory Building with RCC proof 1000Sqft. 350,000.00 Including overhead tank of 4000 ltr capacity (c) Plant & Machinery : .i.) includes: Feed water pump,one pressure sand filter, 1,250,000.00 open acti. Carbon filter, Dosing pump,catridge filter, R.O.pump,R.O.Memberence,Post treatment micron filter & ultra violet purifier .ii) Pouch filling Machine (Cap of 250 ml) 210,000.00 .iii) Deep borrowell 50,000.00 1,510,000.00 Tax & Irrection Exp 38,000.00 1,548,000.00 (D) Electrical Installation & others 152,000.00 Total Block Capital 2,050,000.00 102500 (B) WORKING CAPITAL REQUIREMENT SCHEDULE : ( RS .) 1) Closing Stock a) Raw Material & Consumables : 15 days. 120,000.00 b) Finished Product. : 7 days. 90,000.00 2) Sundry Debtors: 7 days 90,000.00 TOTAL 300,000.00 Cost of the Project (A + B) 2,350,000.00 Means Of Finance Promoter's Bank Finance TOTAL Contribution 1. Block Capital 1,03,000/- 1,947,000.00 2,050,000.00 2. Working Capital 15,000/- 285,000.00 300,000.00 Toatal 1,18,000/- 2,232,000.00 2,350,000.00
  • 2. Bank int. 110000 electr & others 42000 152000 329220 109740
  • 3. INTEREST AND REPAYMENT SCHEDULE OF TERM LOAN : (Rs. In Lakhs) Year Instalment Op. Bal. Repayment Cl. Bal Interest (Quartely) of of of Term Loan Term Loan Term Loan @ 14.75 % 1st 1st 19.47 0.70 18.77 0.72 2nd 18.77 0.70 18.08 0.69 3rd 18.08 0.70 17.38 0.67 4th 17.38 0.70 16.69 0.64 Total 2.78 2.72 2nd 1st 16.69 0.70 15.99 0.62 2nd 15.99 0.70 15.30 0.59 3rd 15.30 0.70 14.60 0.56 4th 14.60 0.70 13.91 0.54 2.78 2.31 3rd 1st 13.91 0.70 13.21 0.51 2nd 13.21 0.70 12.52 0.49 3rd 12.52 0.70 11.82 0.46 4th 11.82 0.70 11.13 0.44 2.78 1.90 4th 1st 11.13 0.70 10.43 0.41 2nd 10.43 0.70 9.73 0.38 3rd 9.73 0.70 9.04 0.36 4th 9.04 0.70 8.34 0.33 2.78 1.49 5th 1st 8.34 0.70 7.65 0.31 2nd 7.65 0.70 6.95 0.28 3rd 6.95 0.70 6.26 0.26 4th 6.26 0.70 5.56 0.23 2.78 1.08 6th 1st 5.56 0.70 4.87 0.21 2nd 4.87 0.70 4.17 0.18 3rd 4.17 0.70 3.48 0.15 4th 3.48 0.70 2.78 0.13 2.78 0.67 7th 1st 2.78 0.70 2.09 0.10 2nd 2.09 0.70 1.39 0.08 3rd 1.39 0.70 0.70 0.05 4th 0.70 0.70 0.00 0.03 2.78 0.26
  • 4. 3.69 69535.71
  • 5. DEPRECIATION SCHEDULE : (Rs. In Lakhs) Period Factory Building Plant & Machinery Elect. installation T O T A L Land @ 10 % @ 20 % & others @ 15% 1st Cost 3.50 15.48 1.52 20.50 Depn. 0.35 3.10 0.23 3.67 Cl.Bal. 0.00 3.15 12.38 1.29 16.83 2nd Cost 3.15 12.38 1.29 16.83 Depn. 0.32 2.48 0.19 2.99 Cl.Bal. 0.00 2.84 9.91 1.10 13.84 3rd Cost 2.84 9.91 1.10 13.84 Depn. 0.28 1.98 0.16 2.43 Cl.Bal. 0.00 2.55 7.93 0.93 11.41 4th Cost 2.55 7.93 0.93 11.41 Depn. 0.26 1.59 0.14 1.98 Cl.Bal. 2.30 6.34 0.79 9.43 5th Cost 2.30 6.34 0.79 9.43 Depn. 0.23 1.27 0.12 1.62 Cl.Bal. 0.00 2.07 5.07 0.67 7.81 6th Cost 2.07 5.07 0.67 7.81 Depn. 0.21 1.01 0.10 1.32 Cl.Bal. 0.00 1.86 4.06 0.57 6.49 7th Cost 1.86 4.06 0.57 6.49 Depn. 0.19 0.81 0.09 1.08 Cl.Bal. 0.00 1.67 3.25 0.49 5.41 Contd……….14………..
  • 6. PROJECTED PROFITABLITY STATEMENT : ( Rs. In Lakhs.) Sl. Description (Years) 1st 2nd 3rd 4th 5th 6th 7th Capacity Utylisation 60% 70% 80% 80% 80% 80% 80% A. INCOME : Sales 43.20 50.40 57.60 63.36 69.70 76.67 84.33 Closing Stock : Raw Materials 1.20 1.40 1.60 1.60 1.60 1.60 1.60 Finished Goods 0.90 1.05 1.20 1.20 1.20 1.20 1.20 TOTAL 45.30 52.85 60.40 66.16 72.50 79.47 87.13 B. EXPENDITURE : Opening Stock : C. Materials 1.20 1.40 1.60 1.60 1.60 1.60 Finished Goods 0.90 1.05 1.20 1.20 1.20 1.20 Exp.for Closing Stock 2.10 0.35 0.35 0.00 0.00 0.00 0.00 Container Exp. 26.88 31.36 35.84 39.42 43.37 47.70 52.47 Consumables 4.20 4.90 5.60 6.16 6.78 7.45 8.20 Electricity Charges 0.48 0.56 0.64 0.77 0.92 1.11 1.33 Salary & wages 2.40 2.88 3.46 4.15 4.98 5.97 7.17 Repair & maintanance 0.20 0.26 0.34 0.44 0.57 0.74 0.97 Advertisement Exp. 0.50 0.58 0.66 0.76 0.87 1.01 1.16 Travelling & Conveyance 0.10 0.12 0.14 0.17 0.21 0.25 0.30 Office administrative Exp. 0.15 0.18 0.22 0.26 0.31 0.37 0.45 Packing & forwarding 0.10 0.12 0.14 0.17 0.21 0.25 0.30 Miscellaneous Expenditure 0.10 0.12 0.13 0.15 0.16 0.18 0.19 Interest on Term Loan 2.72 2.31 1.90 1.49 1.08 0.67 0.26 -- Cash Credit 0.44 0.44 0.44 0.44 0.44 0.44 0.44 Depreciation on Fixed Assets 3.67 2.99 2.43 1.98 1.62 1.32 1.08 TOTAL 44.04 49.26 54.74 59.16 64.31 70.26 77.11 C. Net Profit (A - B ) 1.26 3.59 5.66 7.00 8.19 9.20 10.02 D. Provision for I.Tax @ 30% 0.38 1.08 1.70 2.10 2.46 2.76 3.01 E. Profit after Tax 0.88 2.51 3.96 4.90 5.73 6.44 7.02 F. Net Available Surplus ( E + Depn. ) 4.55 5.50 6.39 6.88 7.35 7.77 8.10 Contd ……………11…
  • 7. PROJECTED BALANCE SHEET ( Rs. In Lakhs.) ======================== SL DESCRIPTION (years) 1ST 2ND 3RD 4TH 5TH 6TH 7TH Capacity Utilisation 60% 70% 80% 80% 80% 80% 80% A. LIABILITIES: CAPITAL ACCOUNT: Capital Account B/F 1.18 2.06 4.57 8.53 13.43 19.16 25.61 Add : Profit for the Year 0.88 2.51 3.96 4.90 5.73 6.44 7.02 2.06 4.57 8.53 13.43 19.16 25.61 32.62 SECURED LOAN : Term Loan 16.69 13.91 11.13 8.34 5.56 2.78 0.00 Cash Credit 3.00 3.00 3.00 3.00 3.00 3.00 3.00 CURRENT LIABILITIES : Other Liabilities 0.20 0.20 0.20 0.20 0.20 0.20 0.20 Provision for I.tax 0.38 1.08 1.70 2.10 2.46 2.76 3.01 TOTAL 22.33 22.76 24.56 27.08 30.38 34.35 38.83 B. ASSETS: FIXED ASSETS: (Depn. Schedule) 16.83 13.84 11.41 9.43 7.81 6.49 5.41 Security Deposit with Govt. Deptts. 0.70 0.70 0.70 0.70 0.70 0.70 0.70 CURRENT ASSETS : Closing Stock 2.10 2.45 2.80 2.80 2.80 2.80 2.80 Sundry Debtors 0.85 1.05 1.20 1.32 1.45 1.60 1.76 Cash & Bank 1.85 4.72 8.45 12.83 17.62 22.77 28.16 TOTAL 22.33 22.76 24.56 27.08 30.38 34.35 38.83
  • 8. CASH FLOW STATEMENT ( Rs. In Lakhs.) SL DESCRIPTION Project Yr. 1ST 2ND 3RD 4TH 5TH 6TH 7TH A. SOURCES (a) Profit after Tax 0.88 2.51 3.96 4.90 5.73 6.44 7.02 (b) Depreciation 3.67 2.99 2.43 1.98 1.62 1.32 1.08 (c) Int.on loan 3.16 2.75 2.34 1.93 1.52 1.11 0.70 (d) Bank Finance 22.32 3.00 - - - - - - (e) Promoter's Contr. 1.18 - - - - - - - (e) Increase of C.liab. - 0.58 0.70 0.62 0.40 0.36 0.31 0.25 TOTAL 23.50 11.29 8.95 9.35 9.21 9.22 9.18 9.04 B. USES: (a) Capital Expenditure 23.50 (b) Deposits - (b) Dec. on Loan 2.78 2.78 2.78 2.78 2.78 2.78 2.78 (c) Int. on Loan 3.16 2.75 2.34 1.93 1.52 1.11 0.70 (e) Increase of current Assets 3.50 0.55 0.50 0.12 0.13 0.15 0.16 TOTAL 23.50 9.44 6.08 5.62 4.83 4.43 4.03 3.64 C. Opening Balance ---- ---- 1.85 4.72 8.45 12.83 17.62 22.77 D. Surplus ---- 1.85 2.87 3.73 4.38 4.79 5.15 5.41 E. Closing Balance ---- 1.85 4.72 8.45 12.83 17.62 22.77 28.17
  • 9. DEBT SERVICE COVERAGE RATIO (DSCR) : ================================= ( Rs. In Lakhs.) Year Available Interest on Total Loan Total DSCR Surplus Loan ( 1 + 2) Instalement (2+4) (3/5) 1 2 3 4 5 6 1st 4.55 2.72 7.27 2.78 5.50 1.32 2nd 5.50 2.31 7.81 2.78 5.09 1.53 3rd 6.39 1.90 8.29 2.78 4.68 1.77 4th 6.88 1.49 8.37 2.78 4.27 1.96 5th 7.35 1.08 8.43 2.78 3.86 2.18 6th 7.77 0.67 8.43 2.78 3.45 2.45 7th 8.10 0.26 8.36 2.78 3.04 2.75 TOTAL 46.54 10.41 56.95 19.47 29.88 1.91 Available Surplus + Interest 56.95 D.S.C.R. = ----------------------------------------- = ------------- = 1.91 T. L. Instalement + Interest 29.88 DEBT EQUITY RATIO: ================ Total Debt 16.69 Debt Equity Ratio == ------------------- = ------------ = 1.16 : 1 Capital 2.06
  • 10. BREAK EVEN ANALYSIS (Rs.in Lakhs) (At 60% Capacity) A. Variable Expenses : 1. Raw Material 26.88 2. Consumables 4.20 3. Electric Charges 0.36 4. Salary & Wages 2.22 5. Repair & maint. 0.15 6. Material Handling Exp.. 0.50 7. Misc. Expenses 0.65 34.96 B. Fixed Expenses 1. Salary 0.18 2. Electricity charges 0.12 3. Misc. Expenses 0.10 4. Repair & Maintan. 0.05 5. Depreciation 3.67 6. Interest on Loan 2.72 6.84 C. Net Sales 43.20 D. Contribution (C-A) 8.24 Break Even Point : B/D = 4.15/8.24*100 50% (at 60% Capacity utilisation) BEP at 100% capacity utilisation 50/100*60 = 30% Break even sales = (43.20/60*100)*30% = 21.60 ************
  • 11. INTERNAL RATE OF RETURN: ======================== ( Rs. In Lakhs.) Year Net Available Interest on Net cash Disc. Factor NPV at Disc. Factor NPV at Surplus Loan inflow at 13% 13% at 20% 20% 1 2 3 4 5 6 7 1st 4.55 2.72 7.27 0.88 6.43 0.83 6.06 2nd 5.50 2.31 7.81 0.78 6.11 0.69 5.42 3rd 6.39 1.90 8.29 0.69 5.73 0.57 4.72 4th 6.88 1.49 8.37 0.61 5.14 0.48 4.02 5th 7.35 1.08 8.43 0.54 4.57 0.40 3.37 6th 7.77 0.67 8.43 0.48 4.06 0.33 2.78 7th 8.10 0.26 8.36 0.43 3.56 0.27 2.26 35.61 28.63 Total NPV 35.61 28.63 Less Initial Invstment 7.50 7.50 Net Return 28.11 21.13 28.11 IRR == 13% + (20%-13%) ---------------- = 40% 6.98 Present value of inflow 35.61 Profitablity Index == -------------------------------- == -------- == 4.75 Present value of outflow 7.50