Download to read offline


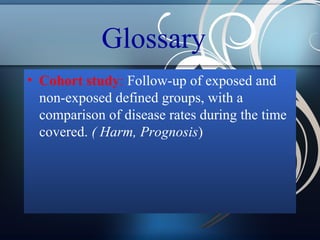
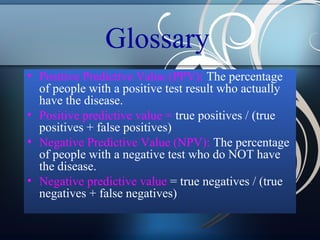
![Glossary
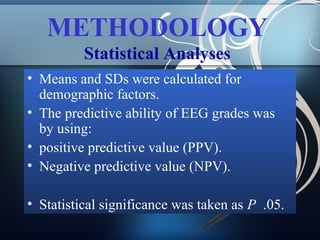
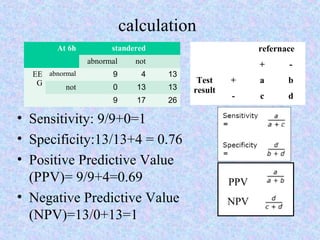
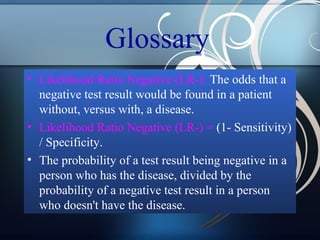
• Likelihood Ratio Positive (LR+): The odds that a
positive test result would be found in a patient
with, versus without, a disease.
• Likelihood Ratio Positive (LR+) = Sensitivity / (1
- Specificity).
• The probability of a test result being positive in a
person with the disease divided by the probability
of a test result being positive in a person without
the disease.
• LR(+) = [TP / (TP + FN)] / [FP / (FP + TN)]](https://image.slidesharecdn.com/journalclub222-140307052846-phpapp02/85/Journal-club222-EEG-as-predictive-tool-for-development-56-320.jpg)


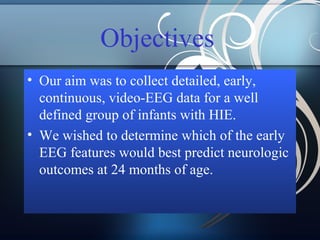
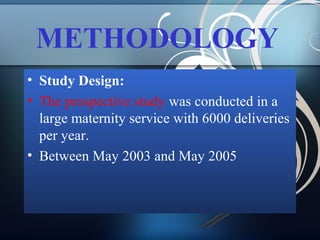
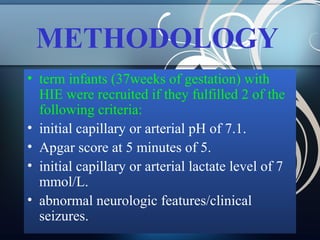
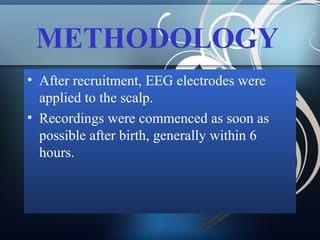
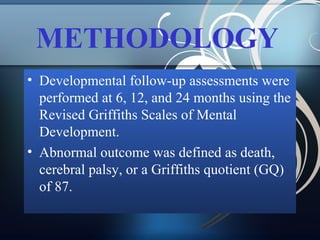
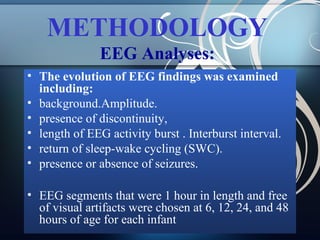
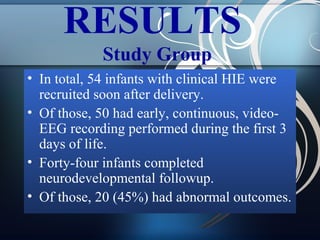
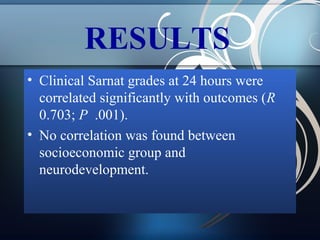
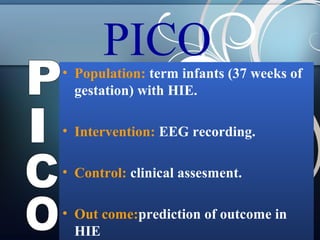
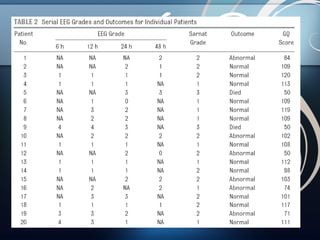
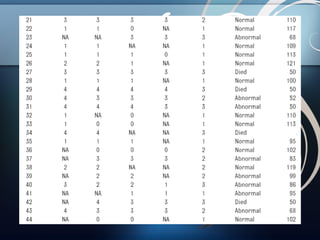
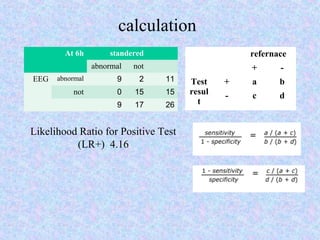
Three sentences: 1) The study aimed to determine if early electroencephalographic (EEG) abnormalities could predict neurodevelopmental outcomes at 24 months for term infants with hypoxic-ischemic encephalopathy (HIE). 2) Fifty infants with HIE underwent continuous video-EEG monitoring within 6 hours of birth, and EEG findings at 6, 12, 24, and 48 hours were correlated with outcomes assessed at 24 months. 3) The results showed that normal or mildly abnormal EEG findings within the first 24 hours highly accurately predicted normal outcomes, while more severe abnormalities were strongly associated with abnormal neurodevelopment.


![Paroxysmal Sympathetic Hyperactivity in Traumatic Brain Injury [PSH in TBI]](https://cdn.slidesharecdn.com/ss_thumbnails/pshintbi-170825135752-thumbnail.jpg?width=640&height=640&fit=bounds)


![Autism: Survey of Emerging Approaches [Clinical]](https://cdn.slidesharecdn.com/ss_thumbnails/2019-200320092556-thumbnail.jpg?width=640&height=640&fit=bounds)


