More Related Content
Similar to johnson & johnson Supplementary Sales Data Q4 2008
Similar to johnson & johnson Supplementary Sales Data Q4 2008 (20)
johnson & johnson Supplementary Sales Data Q4 2008
- 1. Johnson & Johnson and Subsidiaries
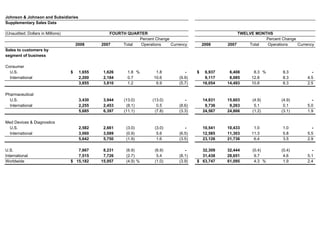
Supplementary Sales Data
(Unaudited; Dollars in Millions)
Percent Change Percent Change
2008 2007 Total Operations Currency 2008 2007 Total Operations Currency
Sales to customers by
segment of business
Consumer
U.S. 1,655$ 1,626 1.8 % 1.8 - 6,937$ 6,408 8.3 % 8.3 -
International 2,200 2,184 0.7 10.6 (9.9) 9,117 8,085 12.8 8.3 4.5
3,855 3,810 1.2 6.9 (5.7) 16,054 14,493 10.8 8.3 2.5
Pharmaceutical
U.S. 3,430 3,944 (13.0) (13.0) - 14,831 15,603 (4.9) (4.9) -
International 2,255 2,453 (8.1) 0.5 (8.6) 9,736 9,263 5.1 0.1 5.0
5,685 6,397 (11.1) (7.8) (3.3) 24,567 24,866 (1.2) (3.1) 1.9
Med Devices & Diagnostics
U.S. 2,582 2,661 (3.0) (3.0) - 10,541 10,433 1.0 1.0 -
International 3,060 3,089 (0.9) 5.6 (6.5) 12,585 11,303 11.3 5.8 5.5
5,642 5,750 (1.9) 1.6 (3.5) 23,126 21,736 6.4 3.5 2.9
U.S. 7,667 8,231 (6.9) (6.9) - 32,309 32,444 (0.4) (0.4) -
International 7,515 7,726 (2.7) 5.4 (8.1) 31,438 28,651 9.7 4.6 5.1
Worldwide 15,182$ 15,957 (4.9) % (1.0) (3.9) 63,747$ 61,095 4.3 % 1.9 2.4
FOURTH QUARTER TWELVE MONTHS
- 2. Johnson & Johnson and Subsidiaries
Supplementary Sales Data
(Unaudited; Dollars in Millions) FOURTH QUARTER TWELVE MONTHS
Percent Change Percent Change
2008 2007 Total Operations Currency 2008 2007 Total Operations Currency
Sales to customers by
geographic area
U.S. 7,667$ 8,231 (6.9) % (6.9) - 32,309$ 32,444 (0.4) % (0.4) -
Europe 3,851 4,159 (7.4) 2.7 (10.1) 16,782 15,644 7.3 1.8 5.5
Western Hemisphere excluding U.S. 1,187 1,309 (9.3) 6.0 (15.3) 5,173 4,681 10.5 7.7 2.8
Asia-Pacific, Africa 2,477 2,258 9.7 9.9 (0.2) 9,483 8,326 13.9 8.4 5.5
International 7,515 7,726 (2.7) 5.4 (8.1) 31,438 28,651 9.7 4.6 5.1
Worldwide 15,182$ 15,957 (4.9) % (1.0) (3.9) 63,747$ 61,095 4.3 % 1.9 2.4