Download to read offline
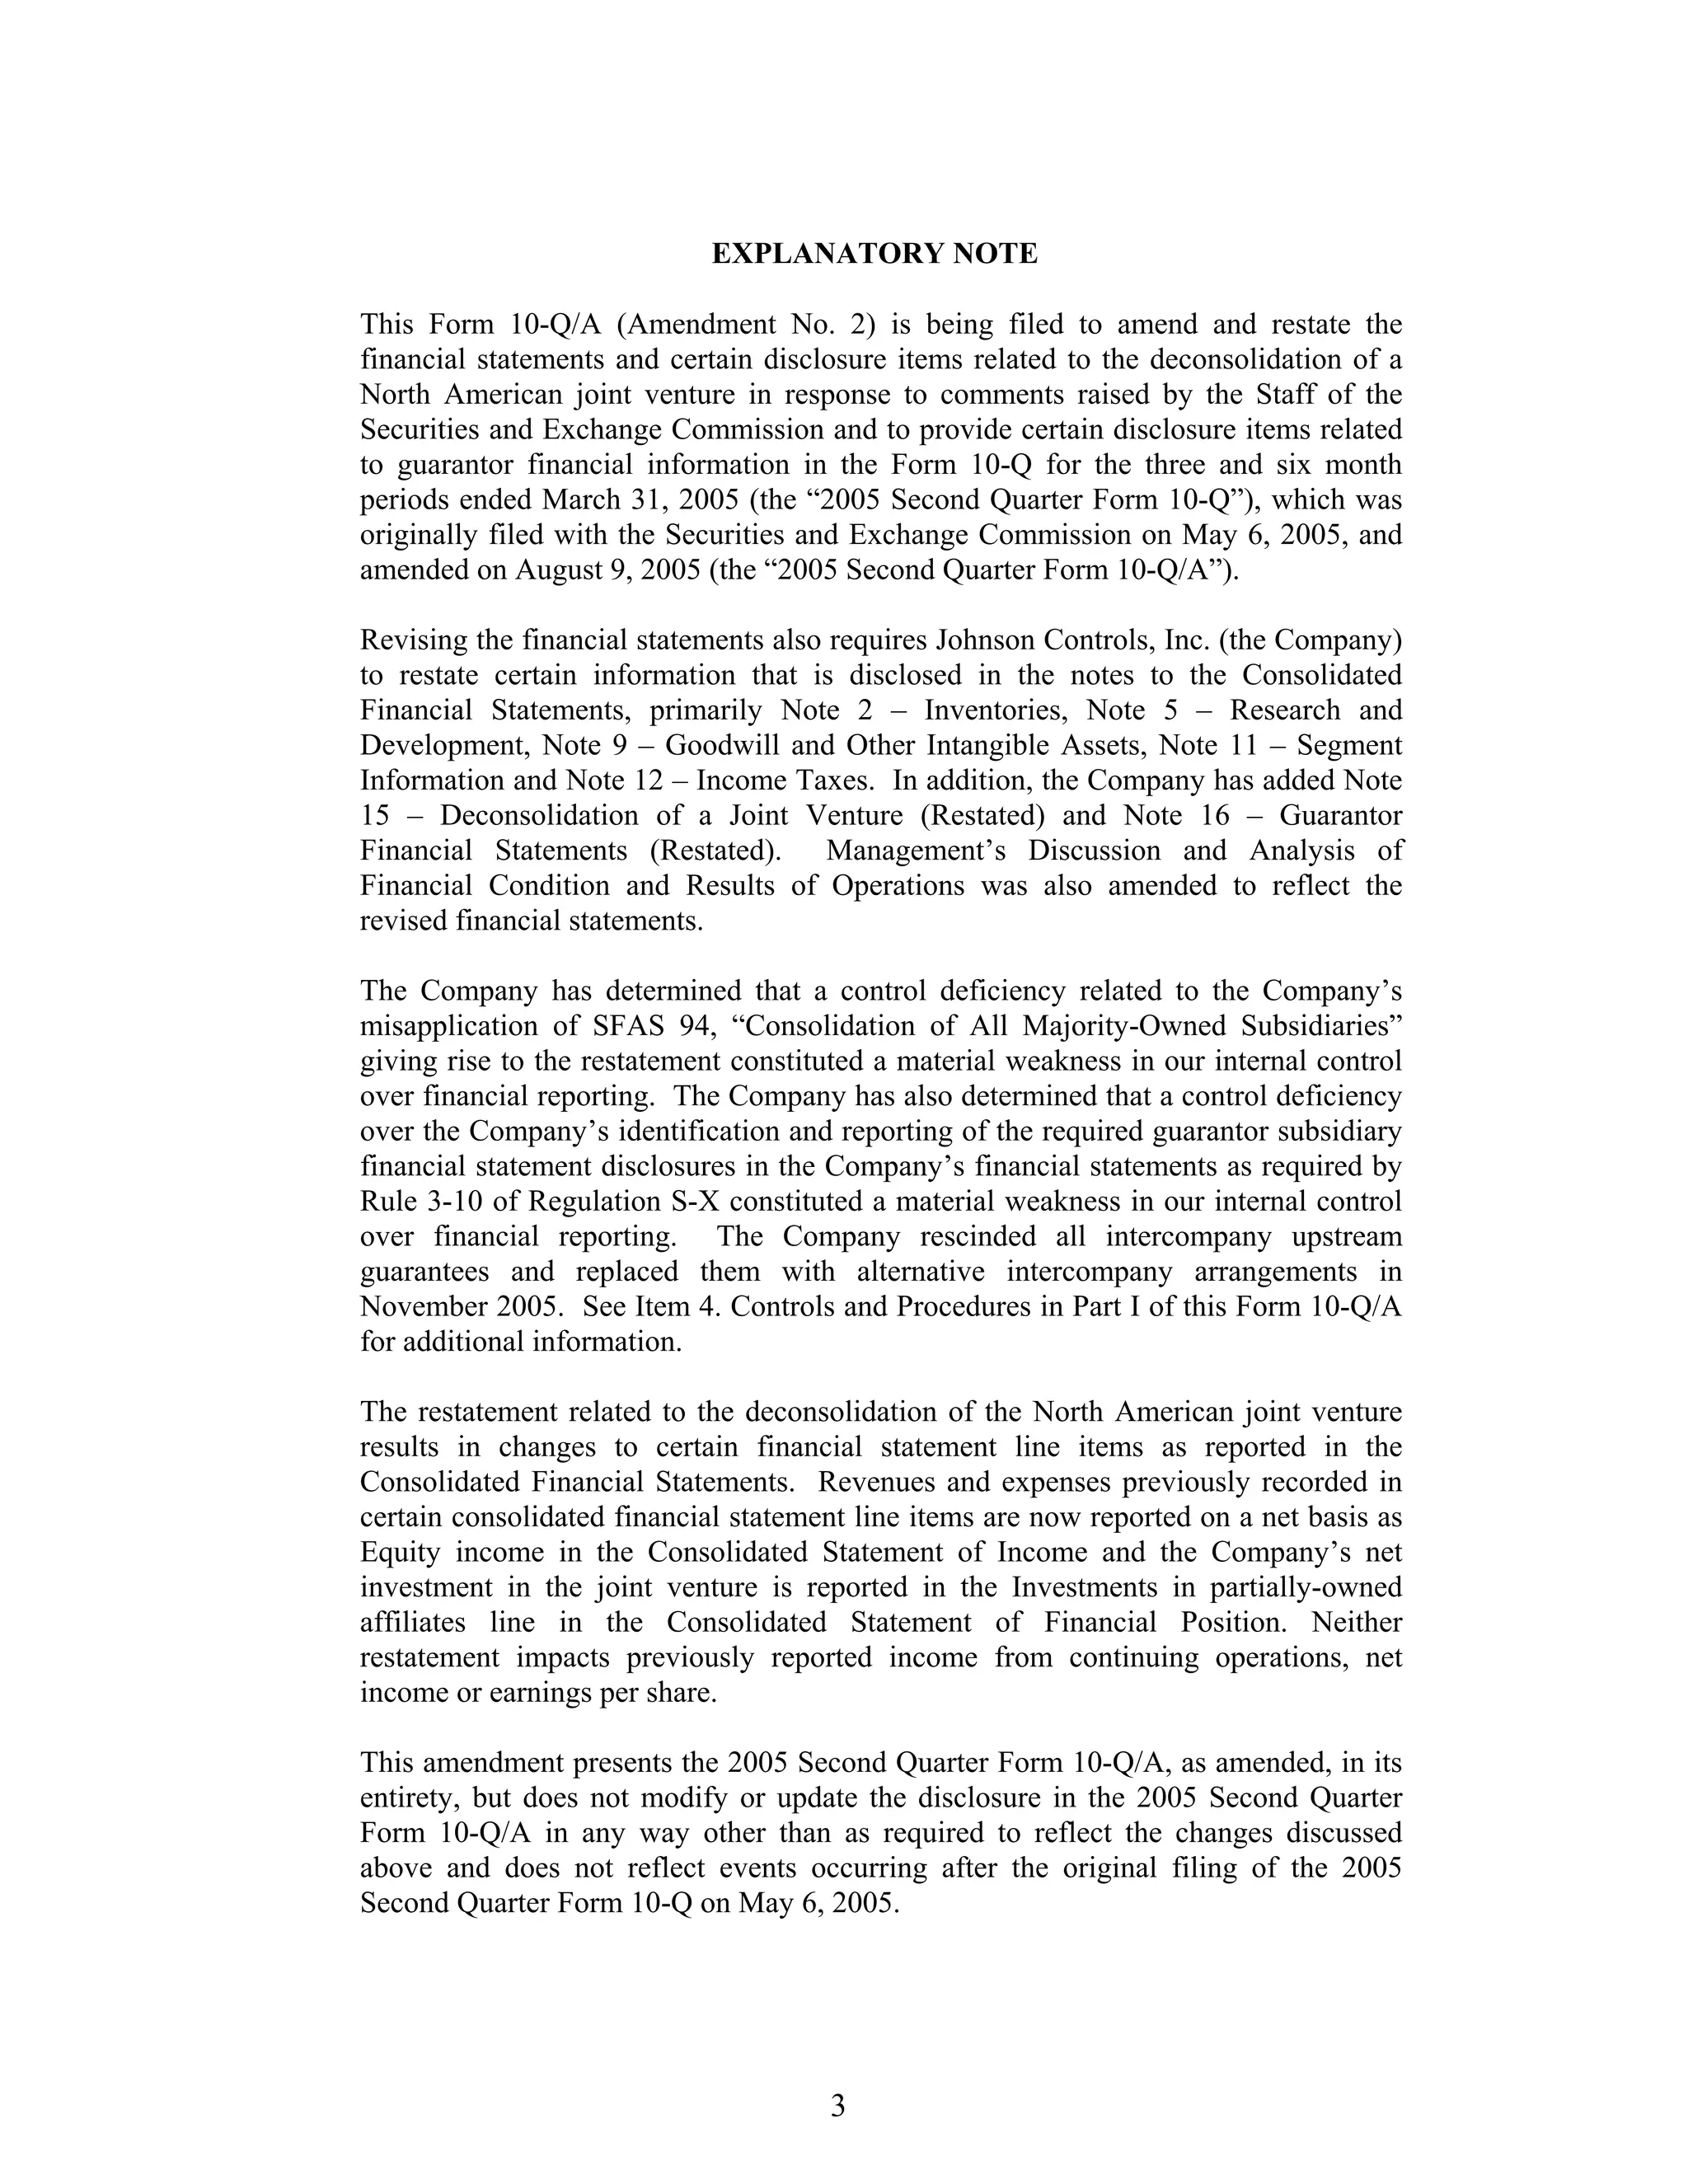
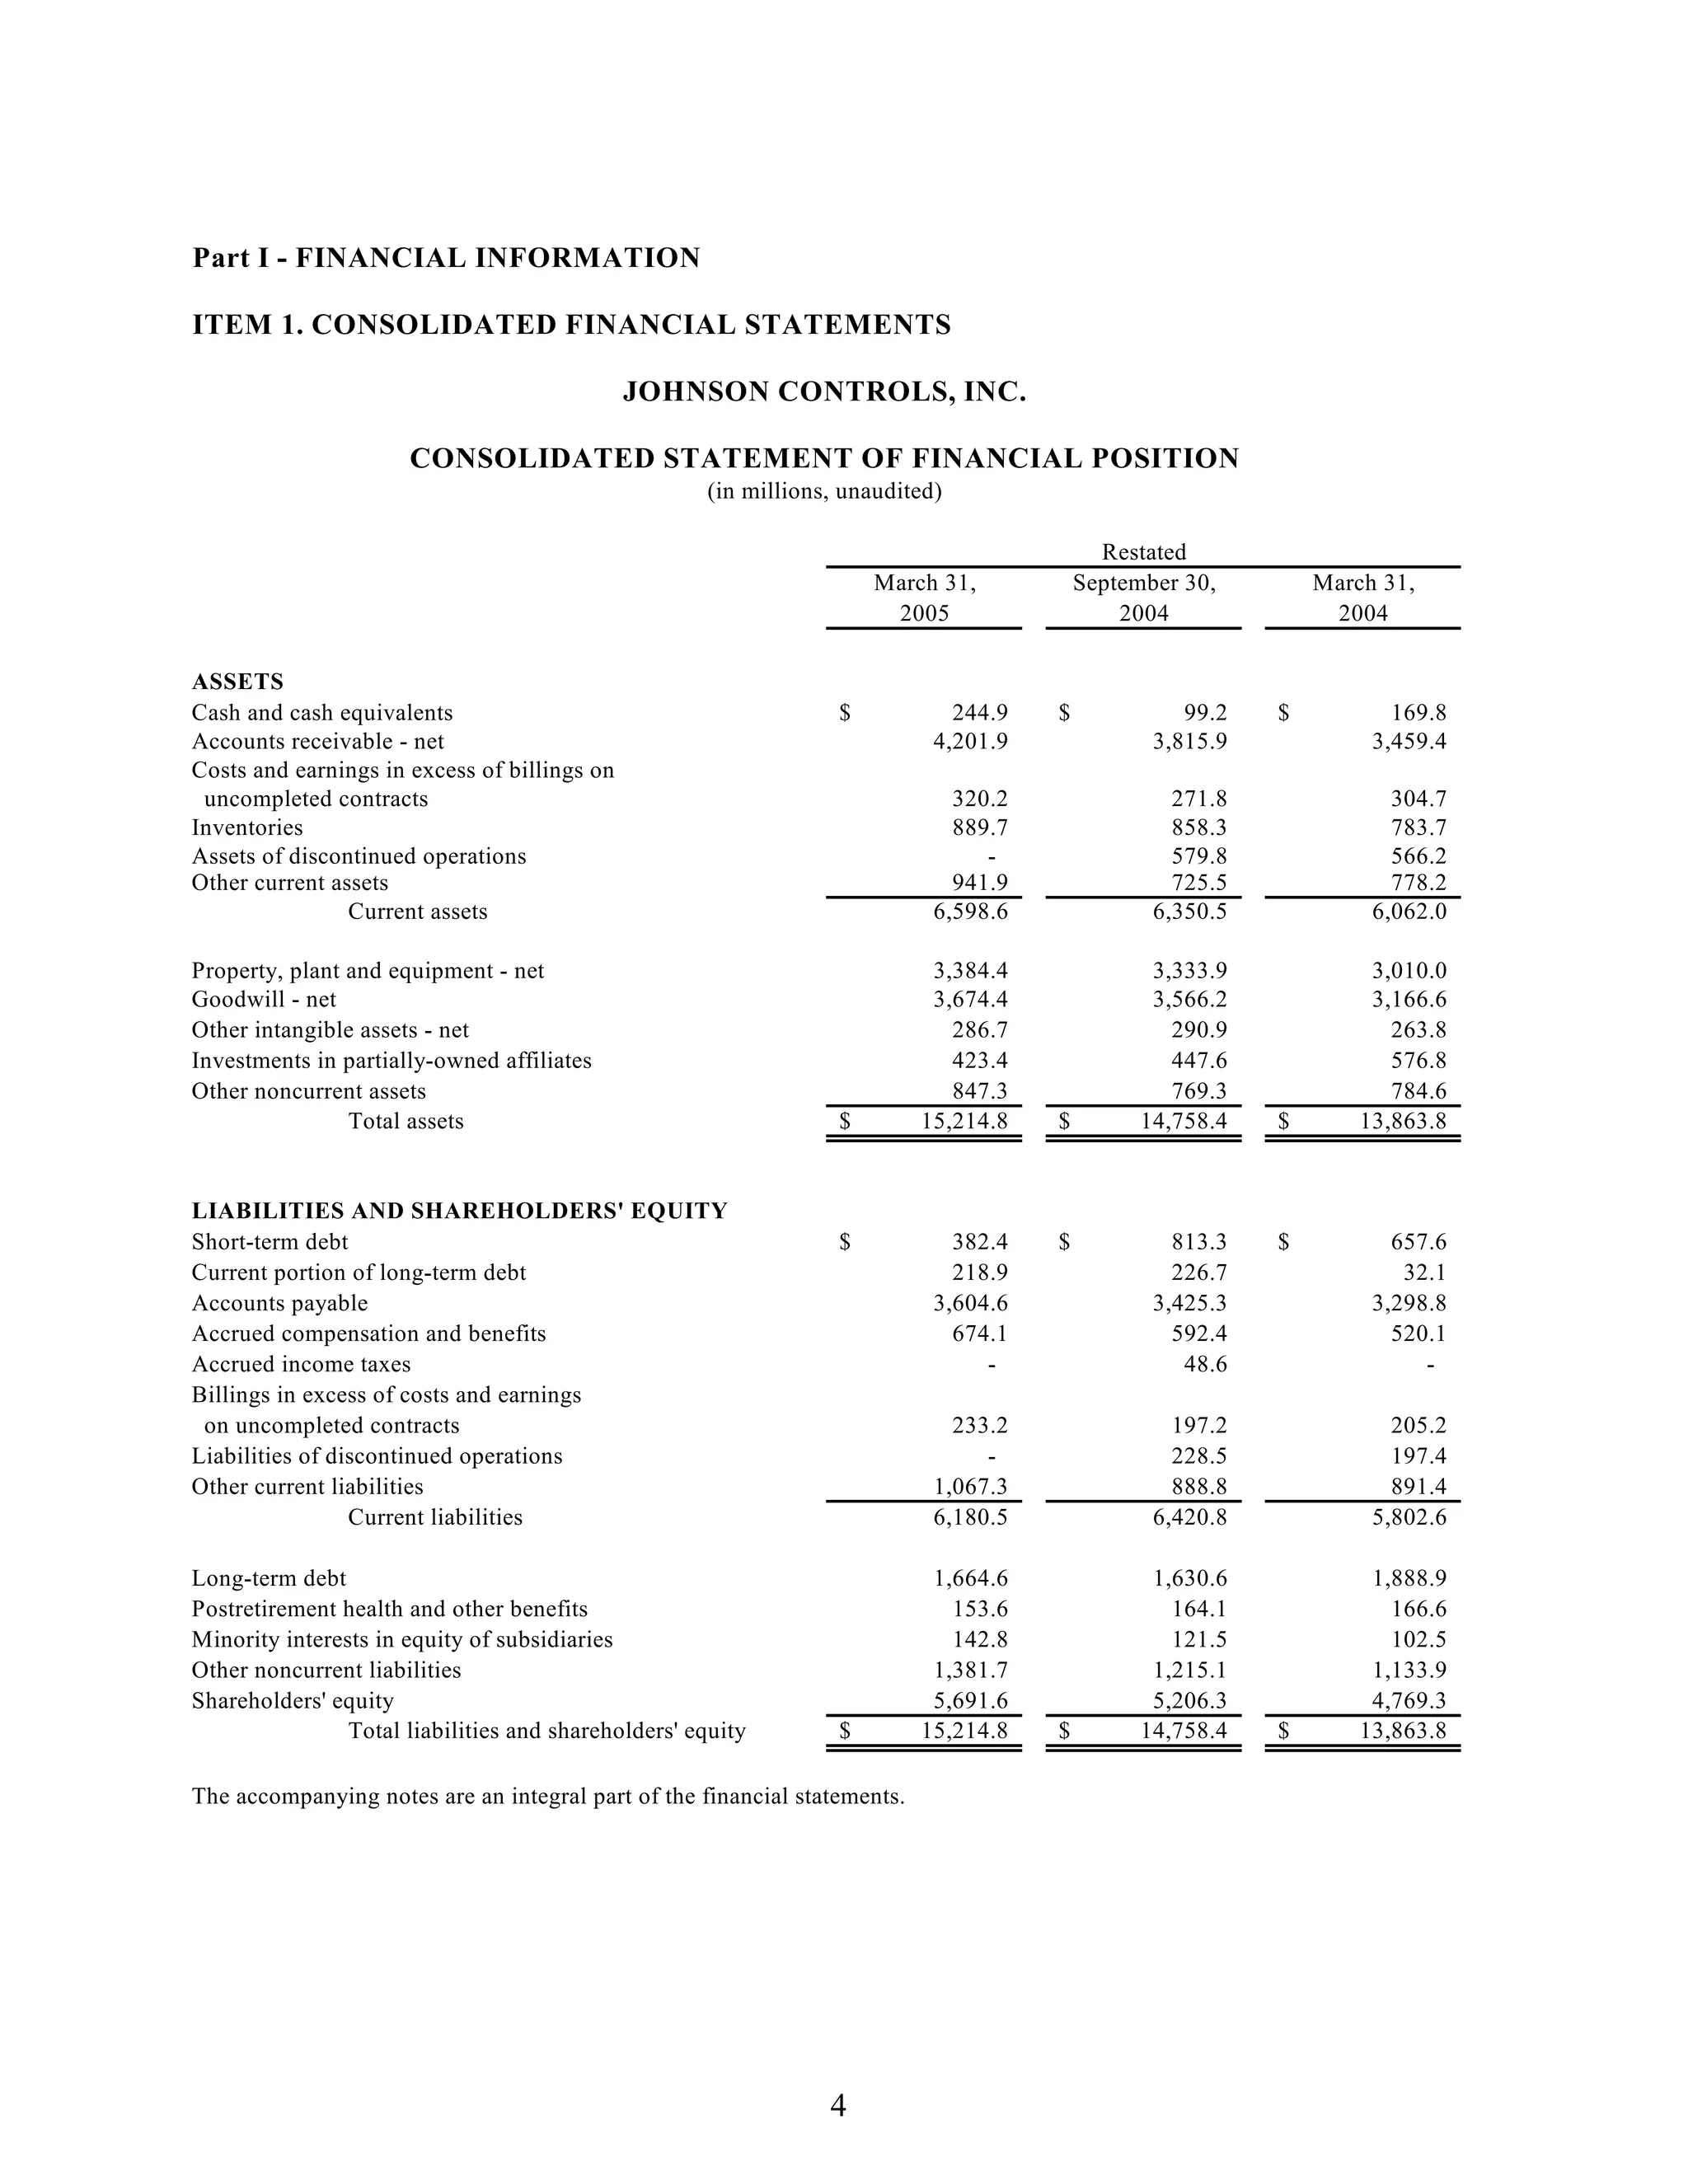
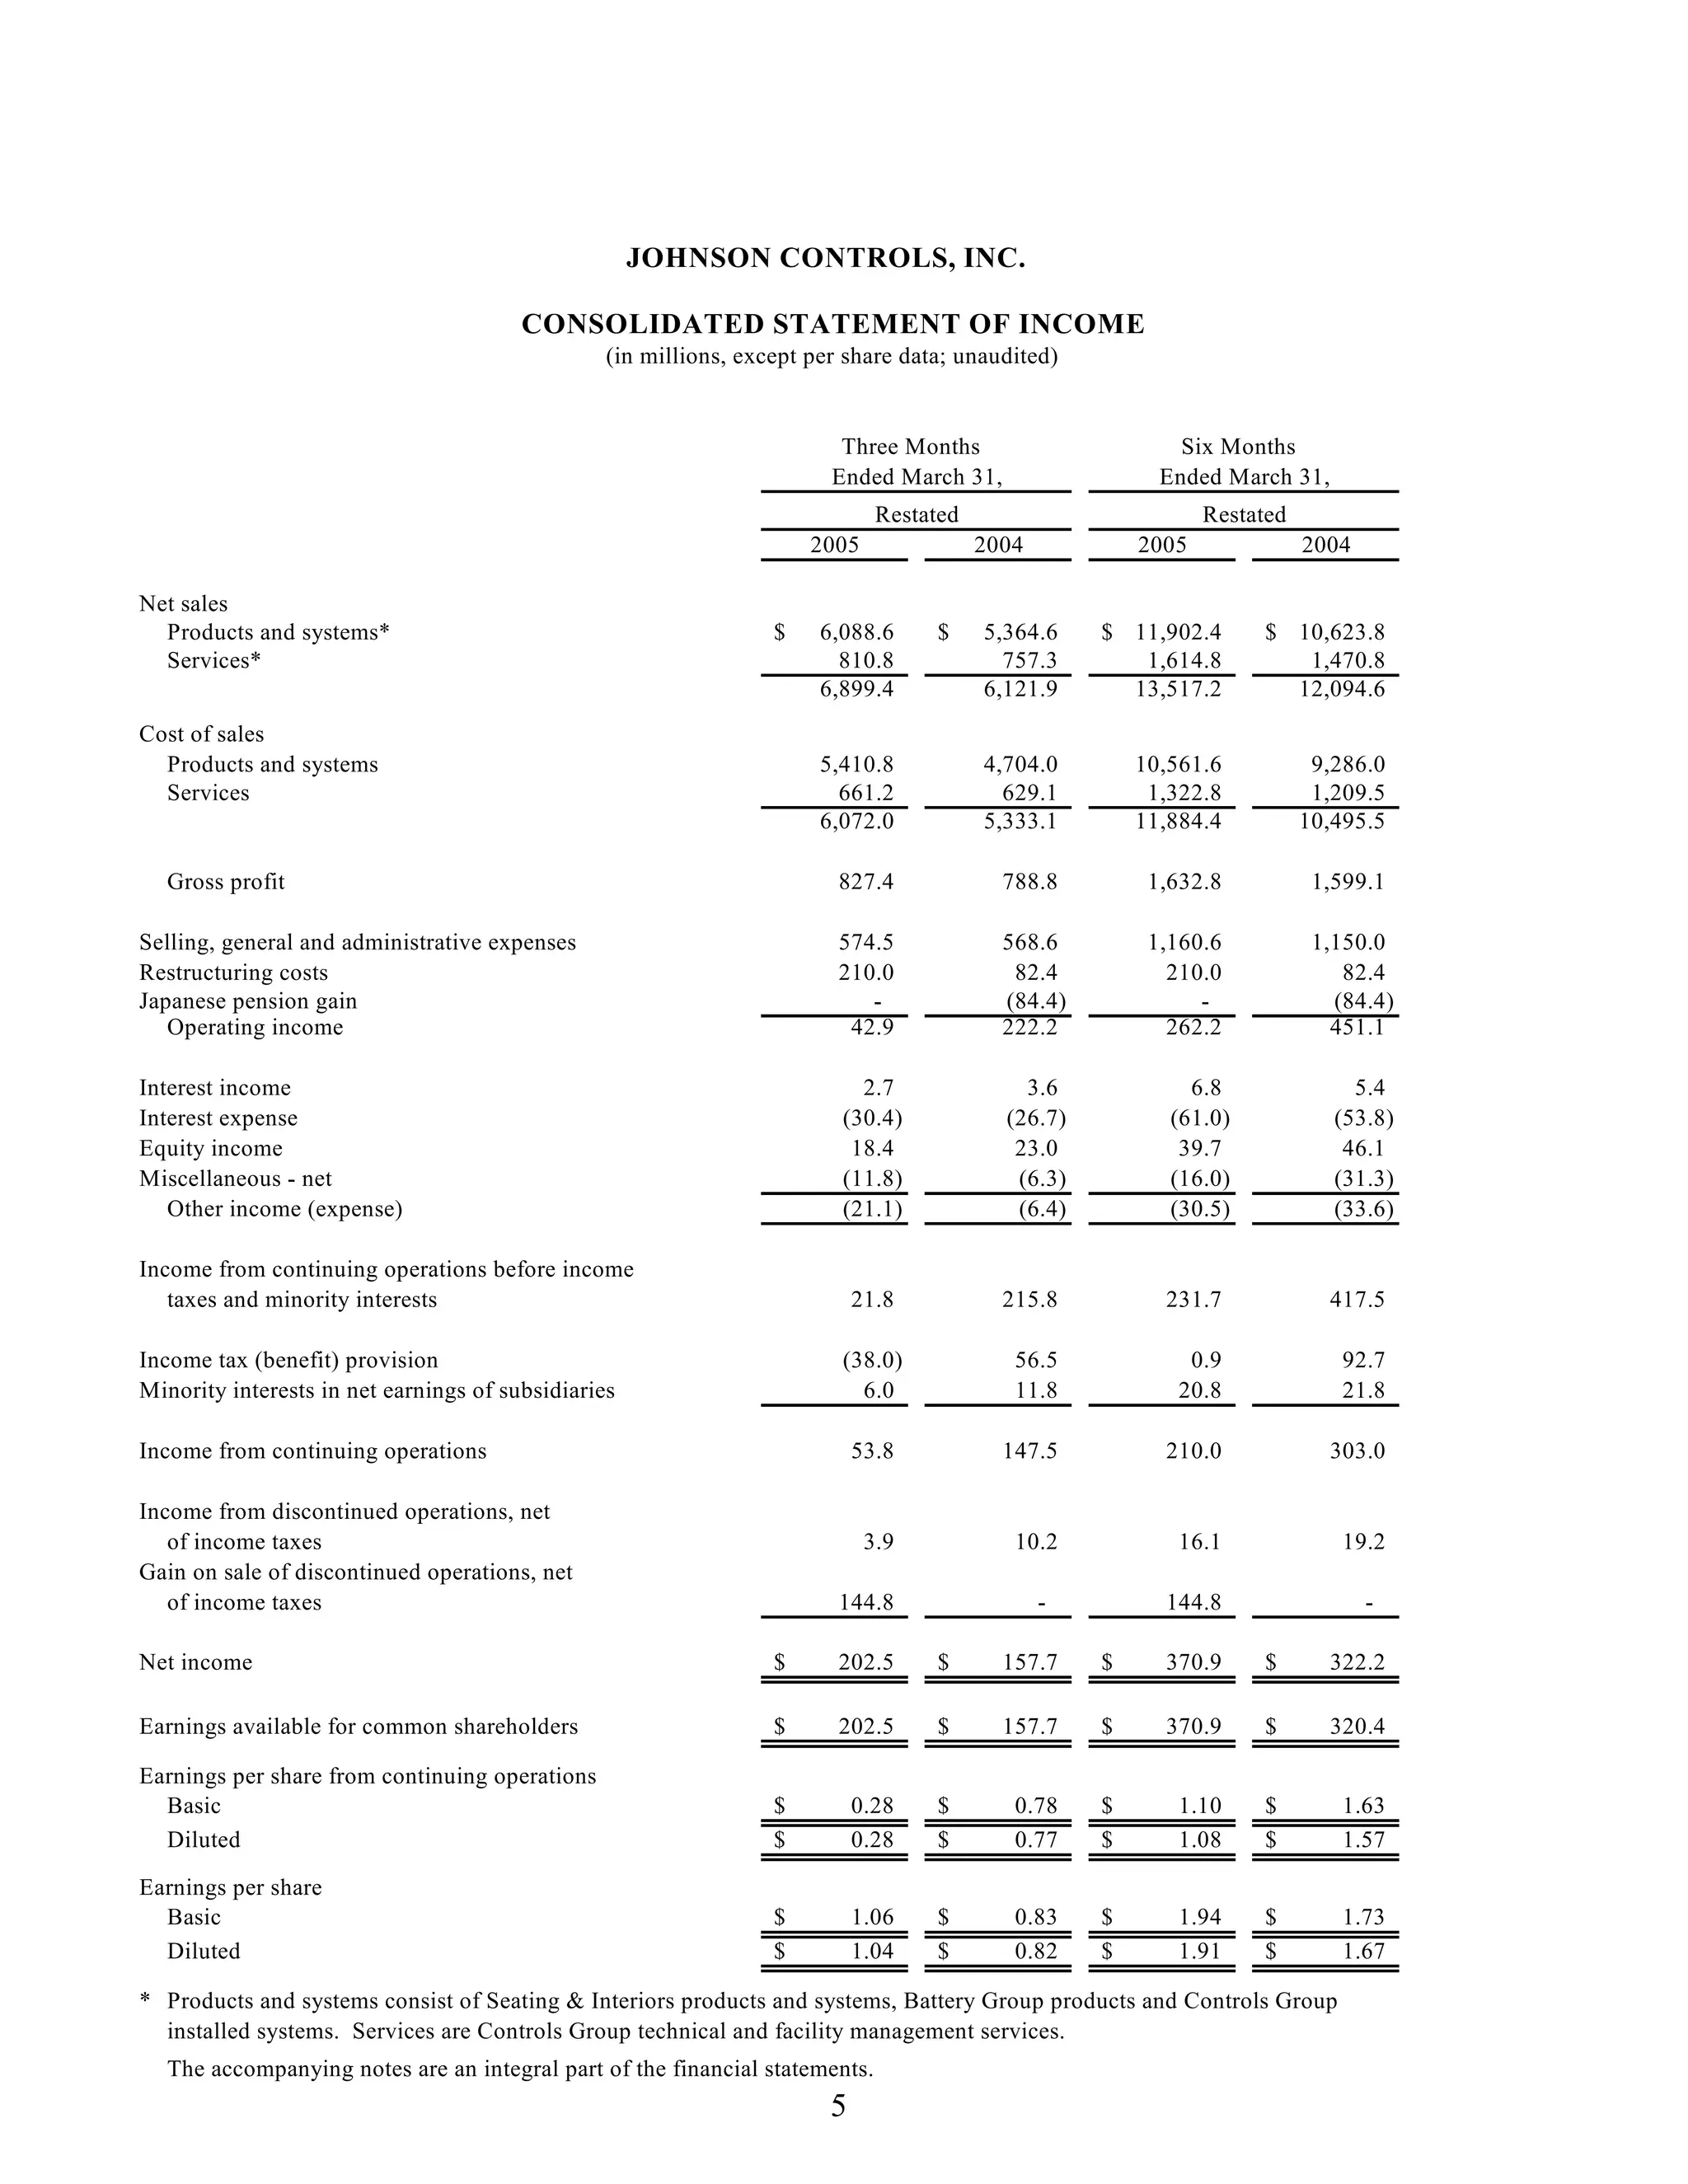
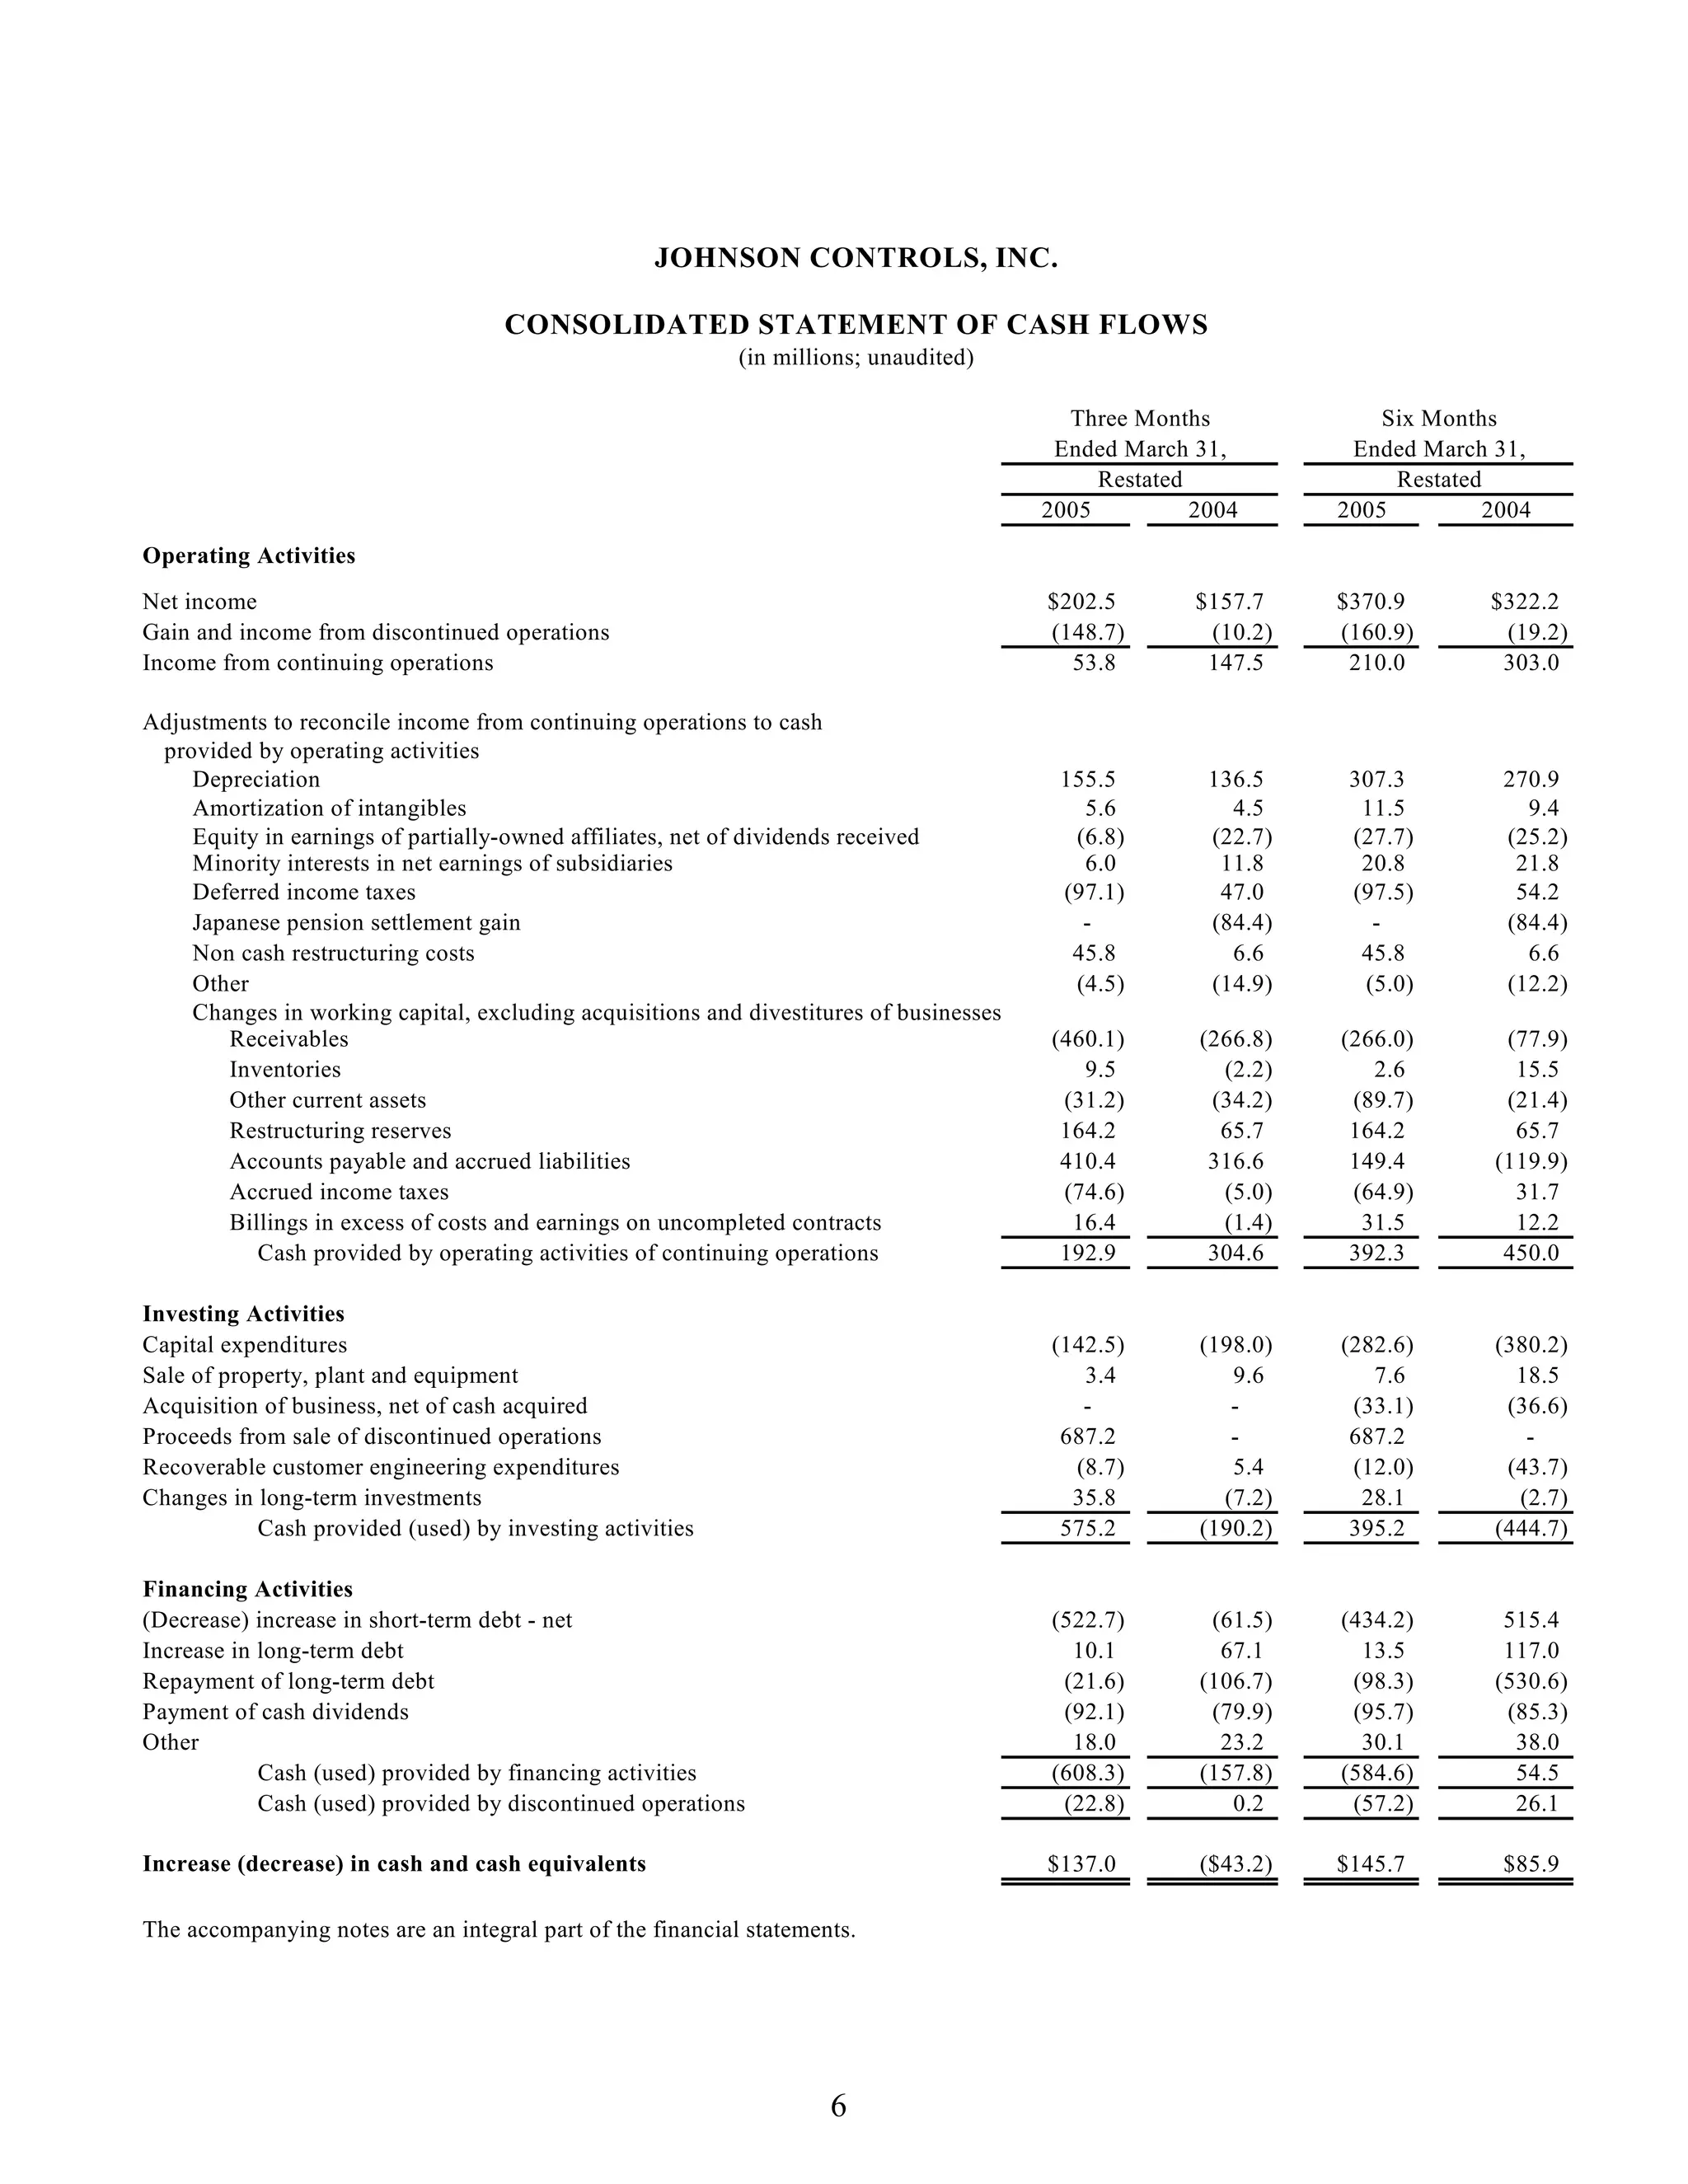
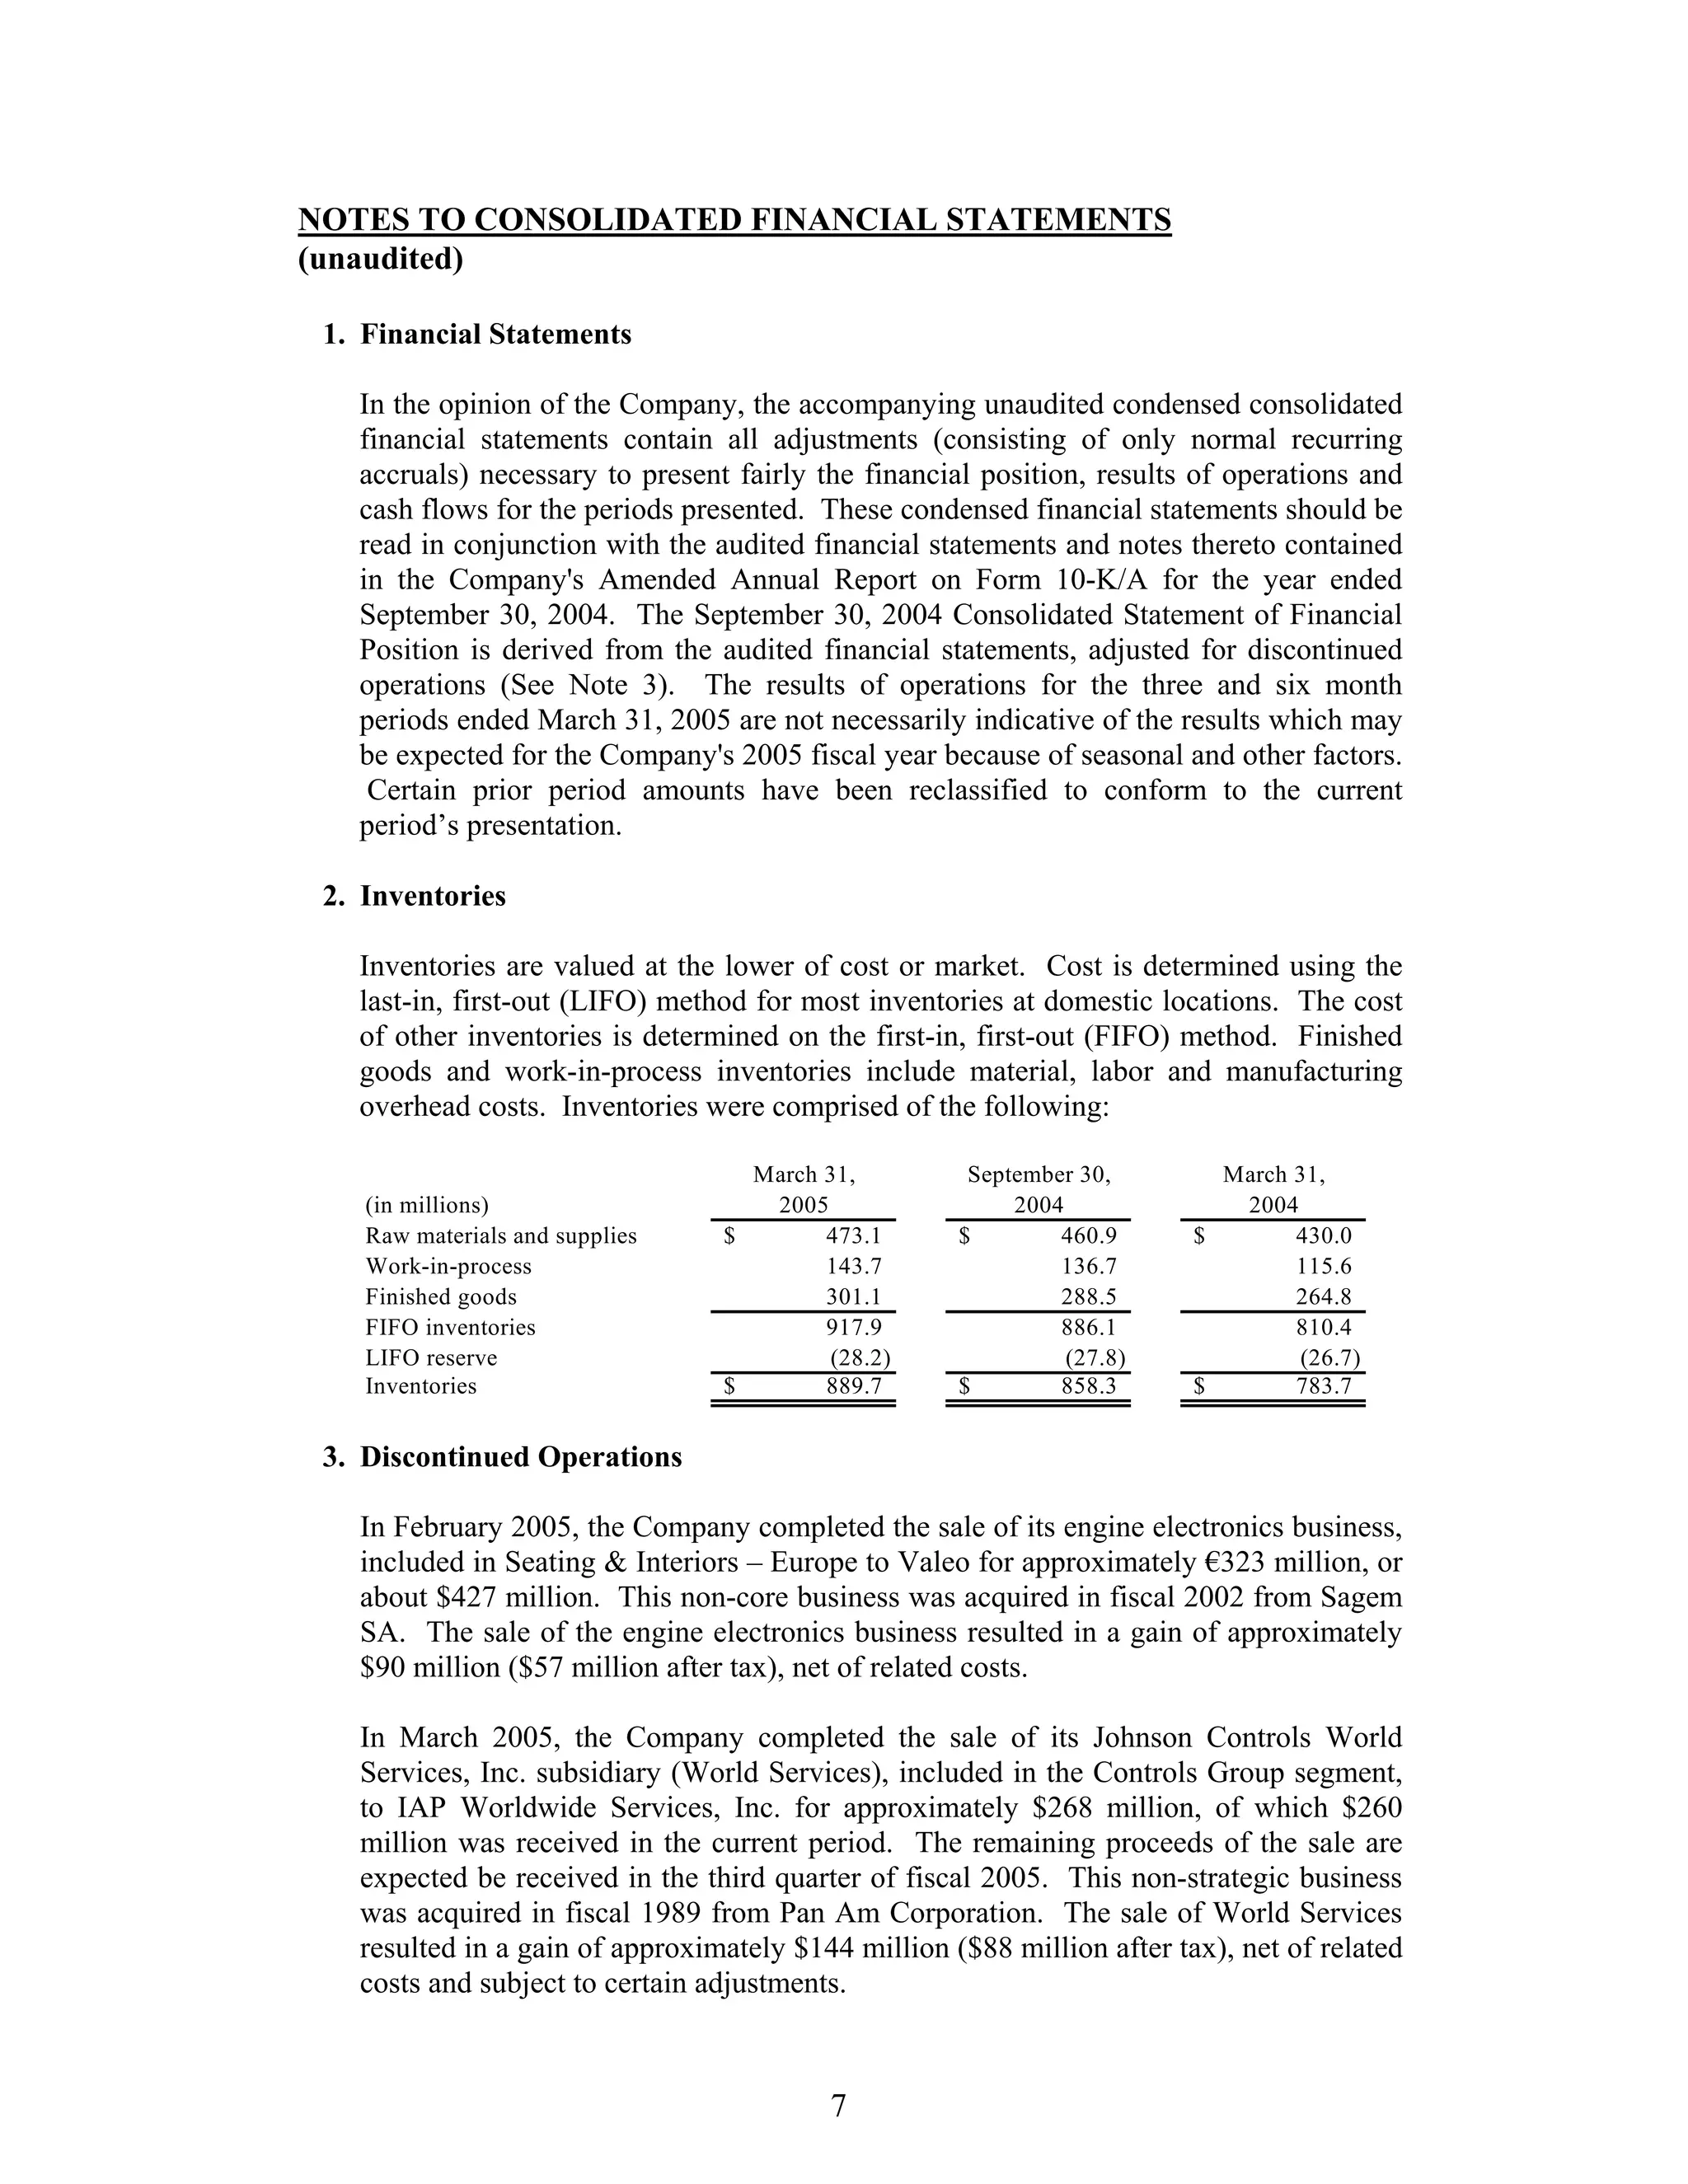
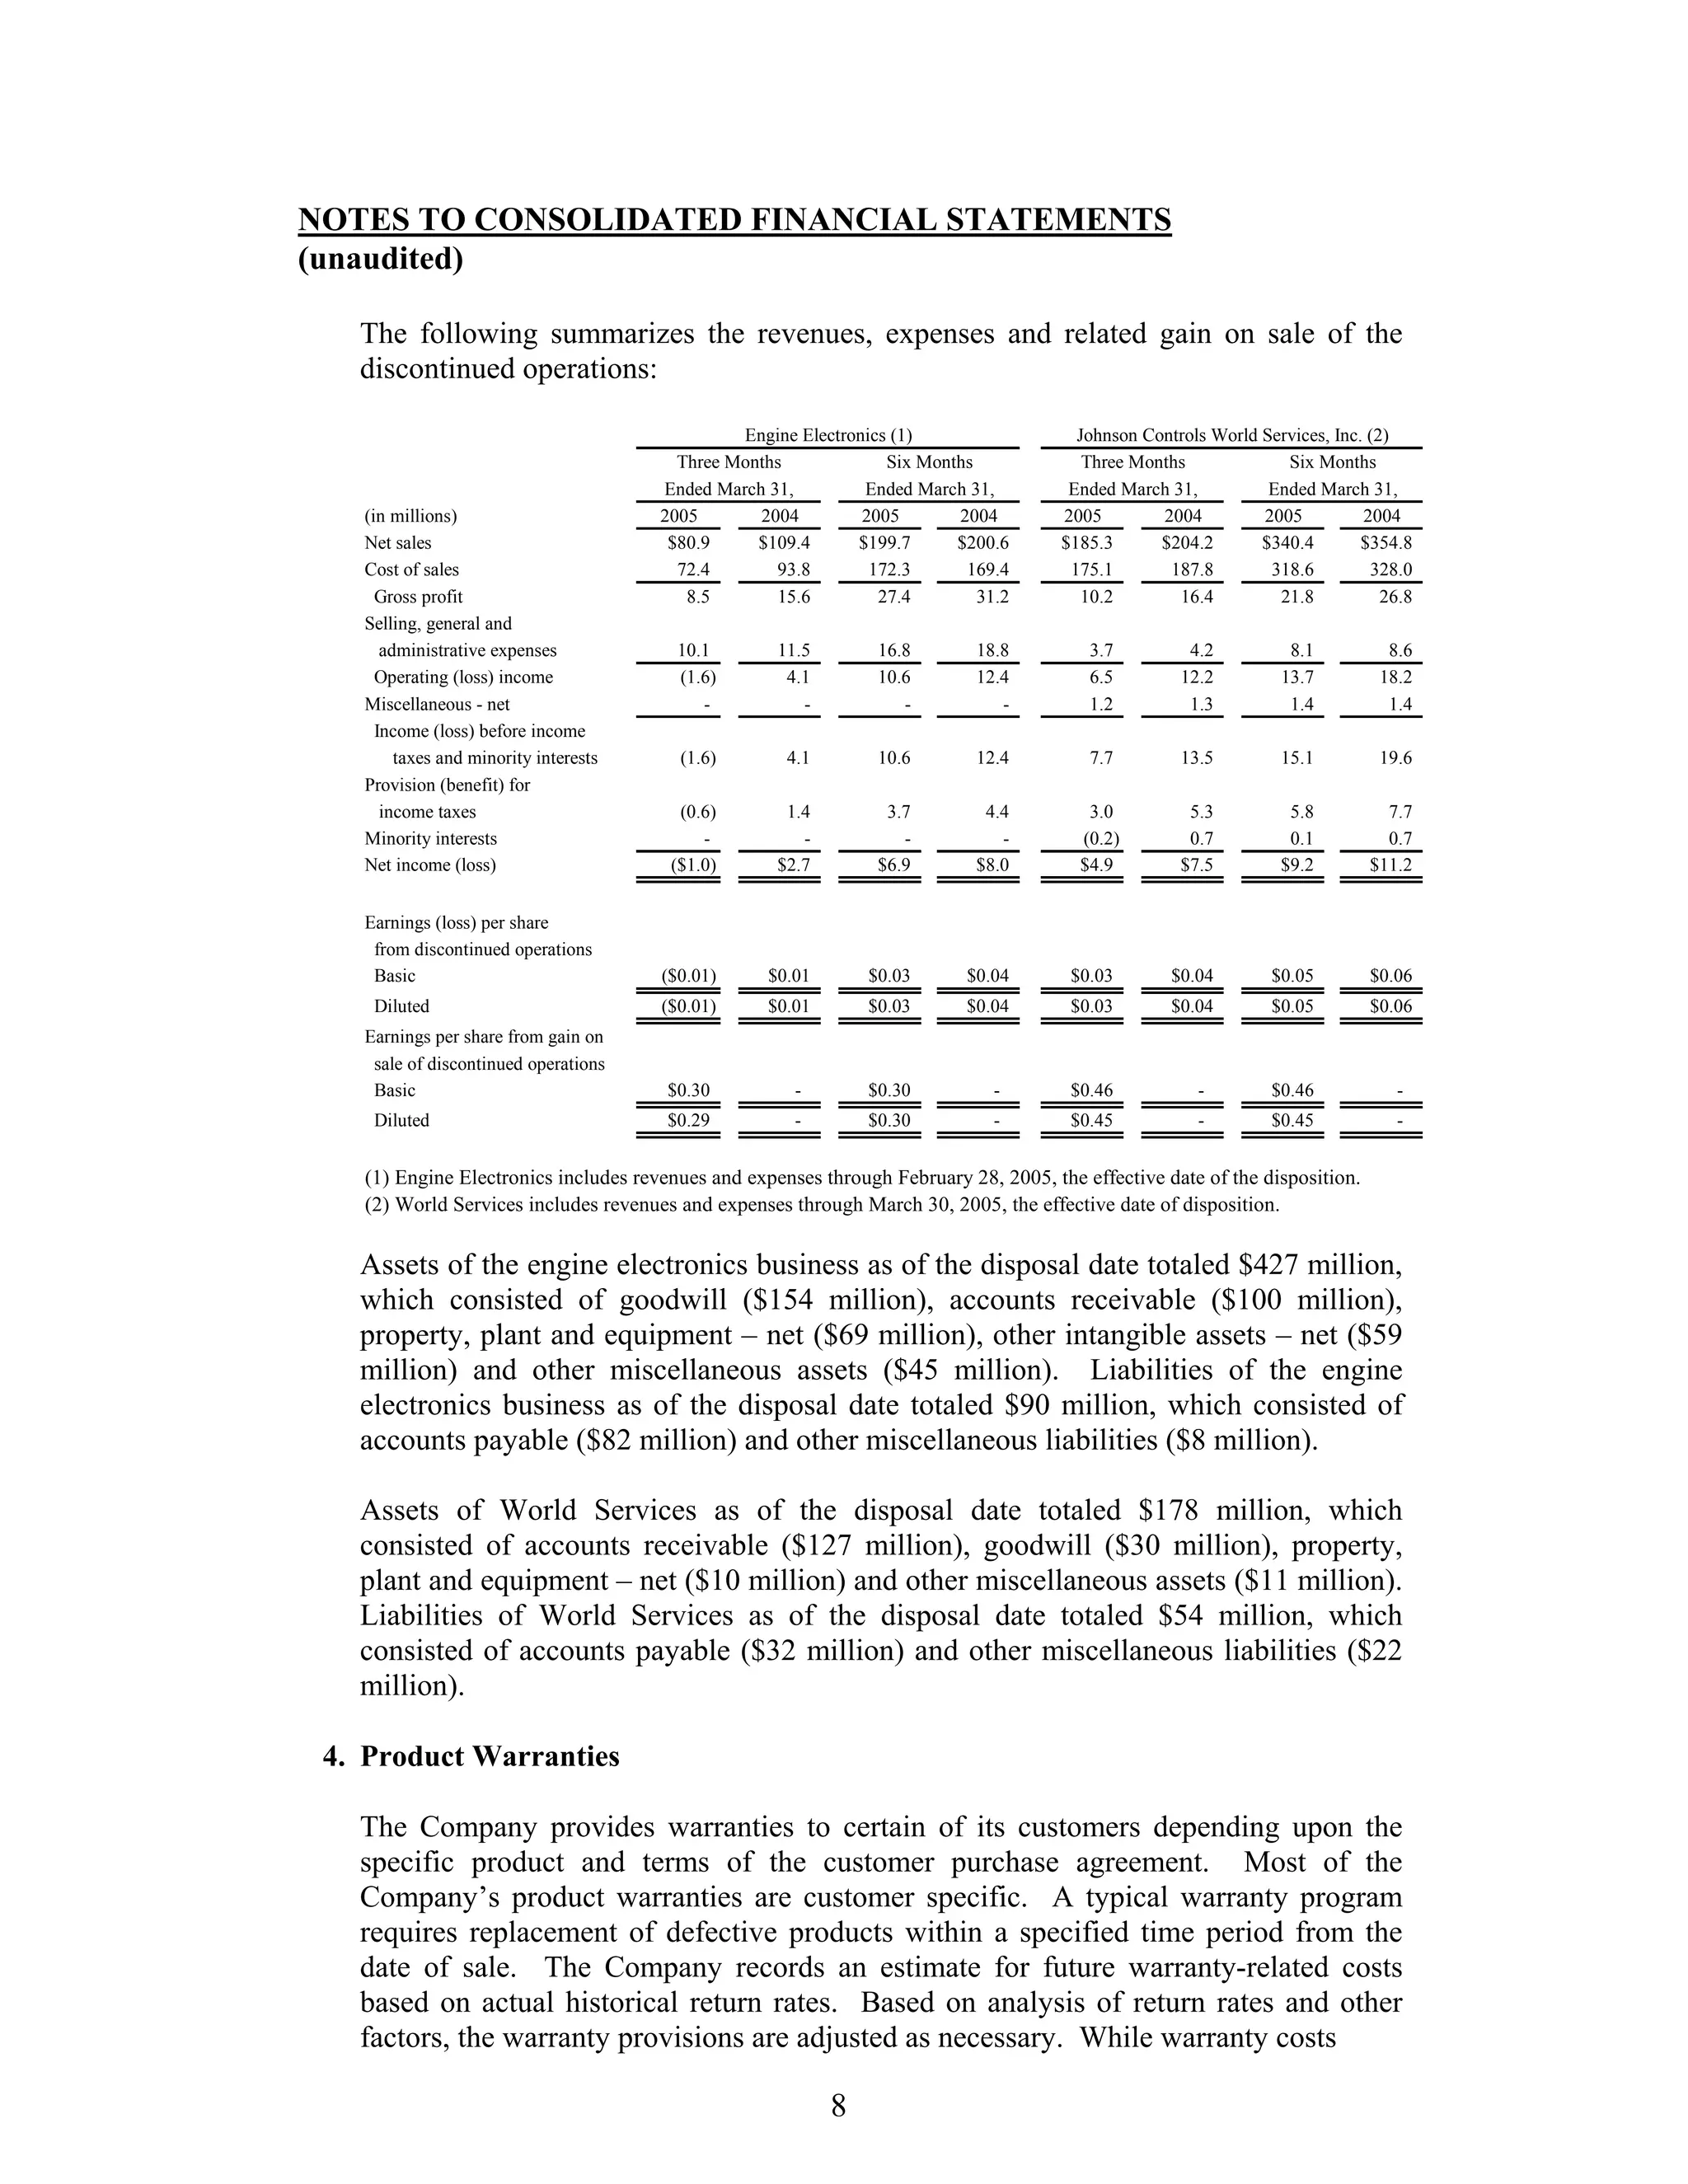
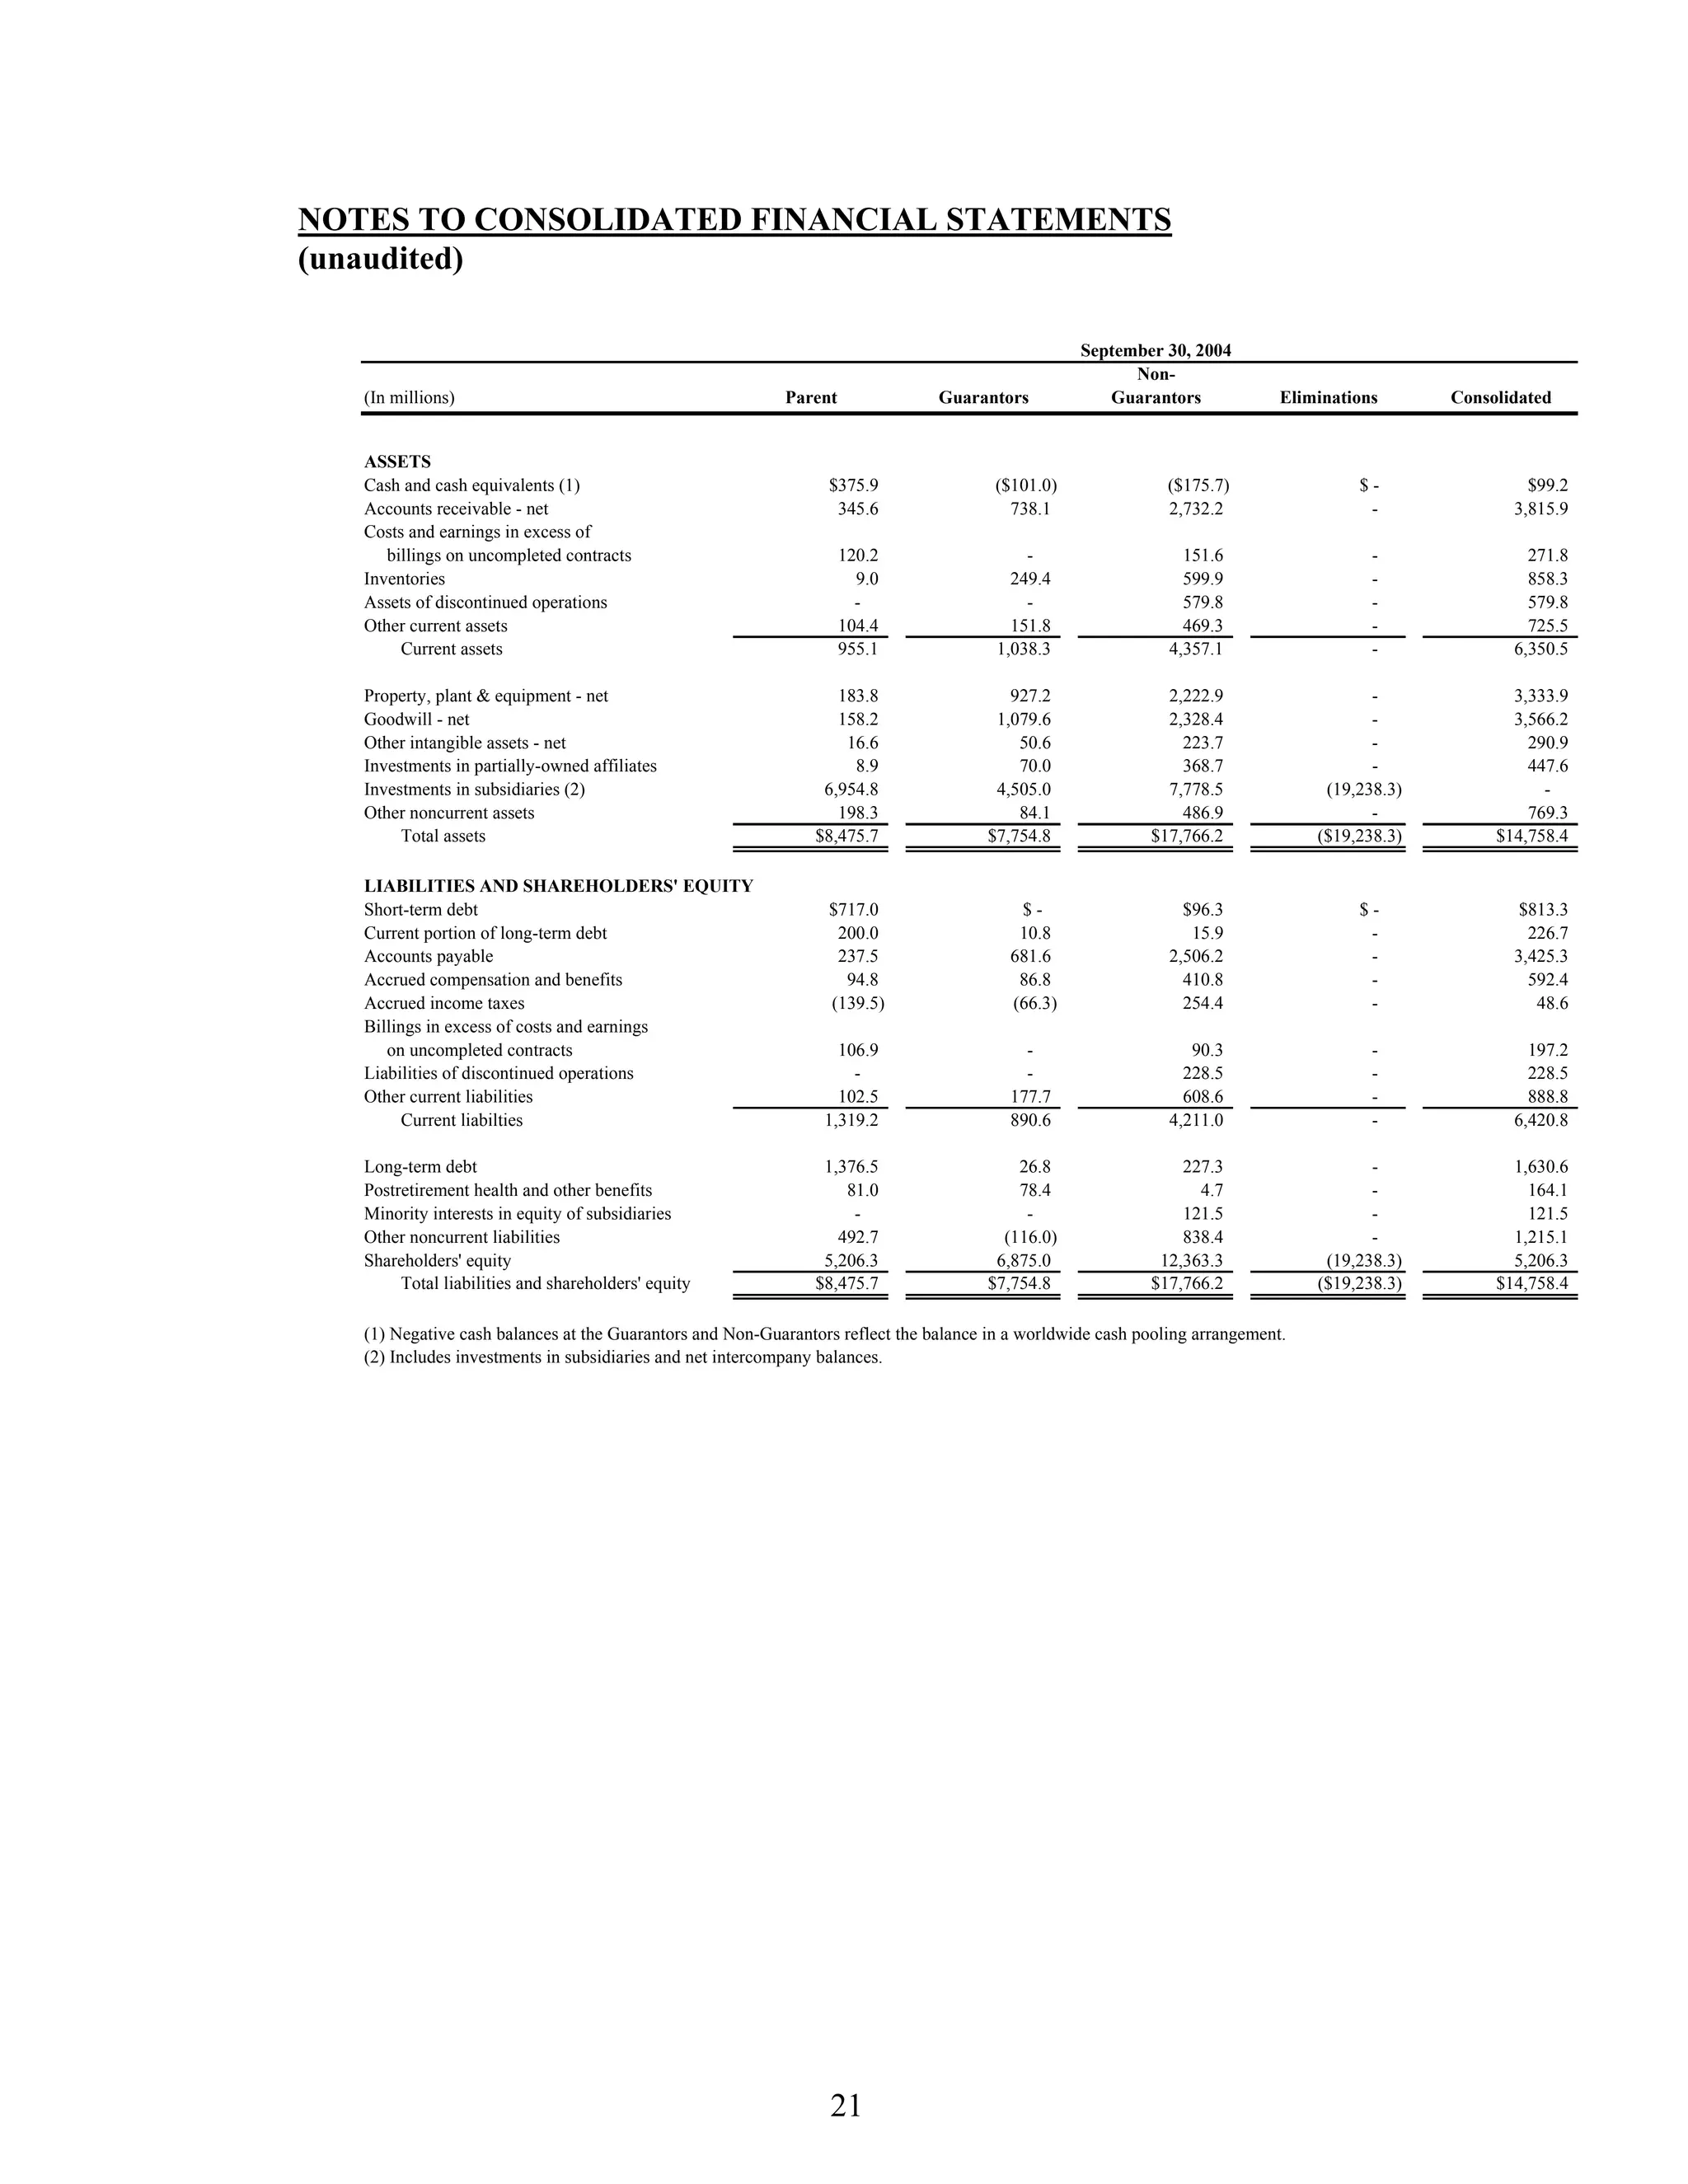
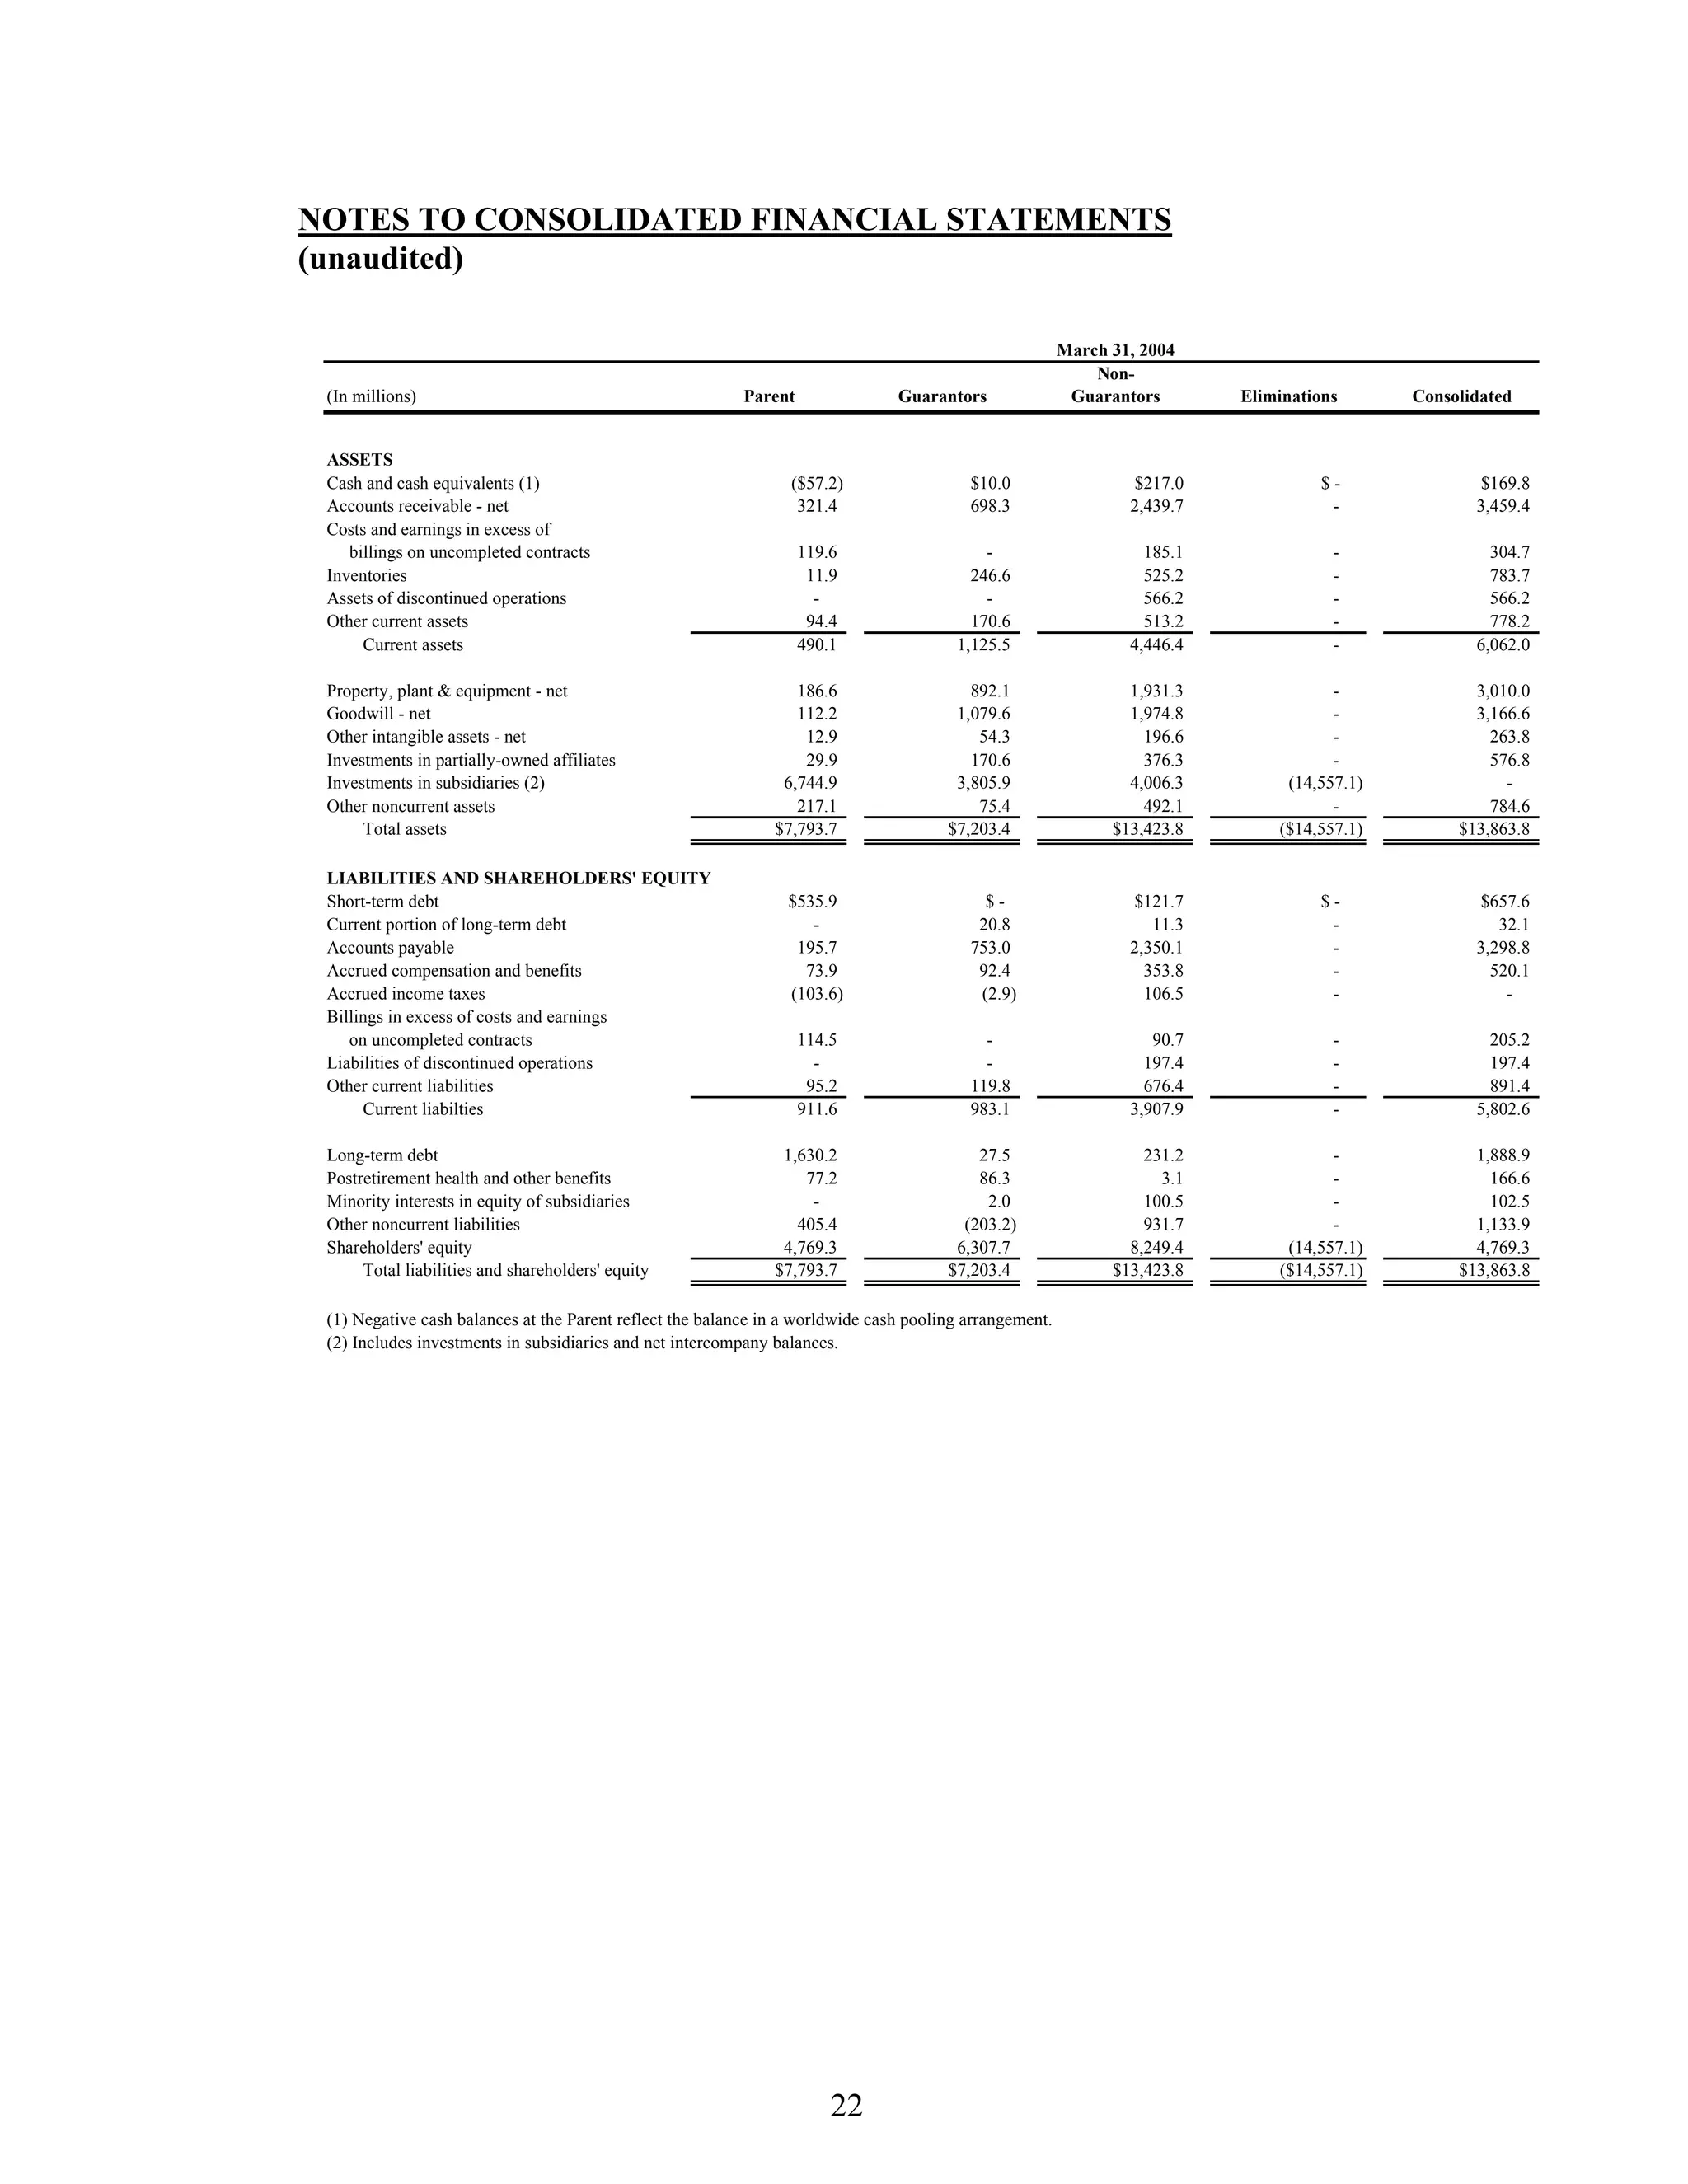
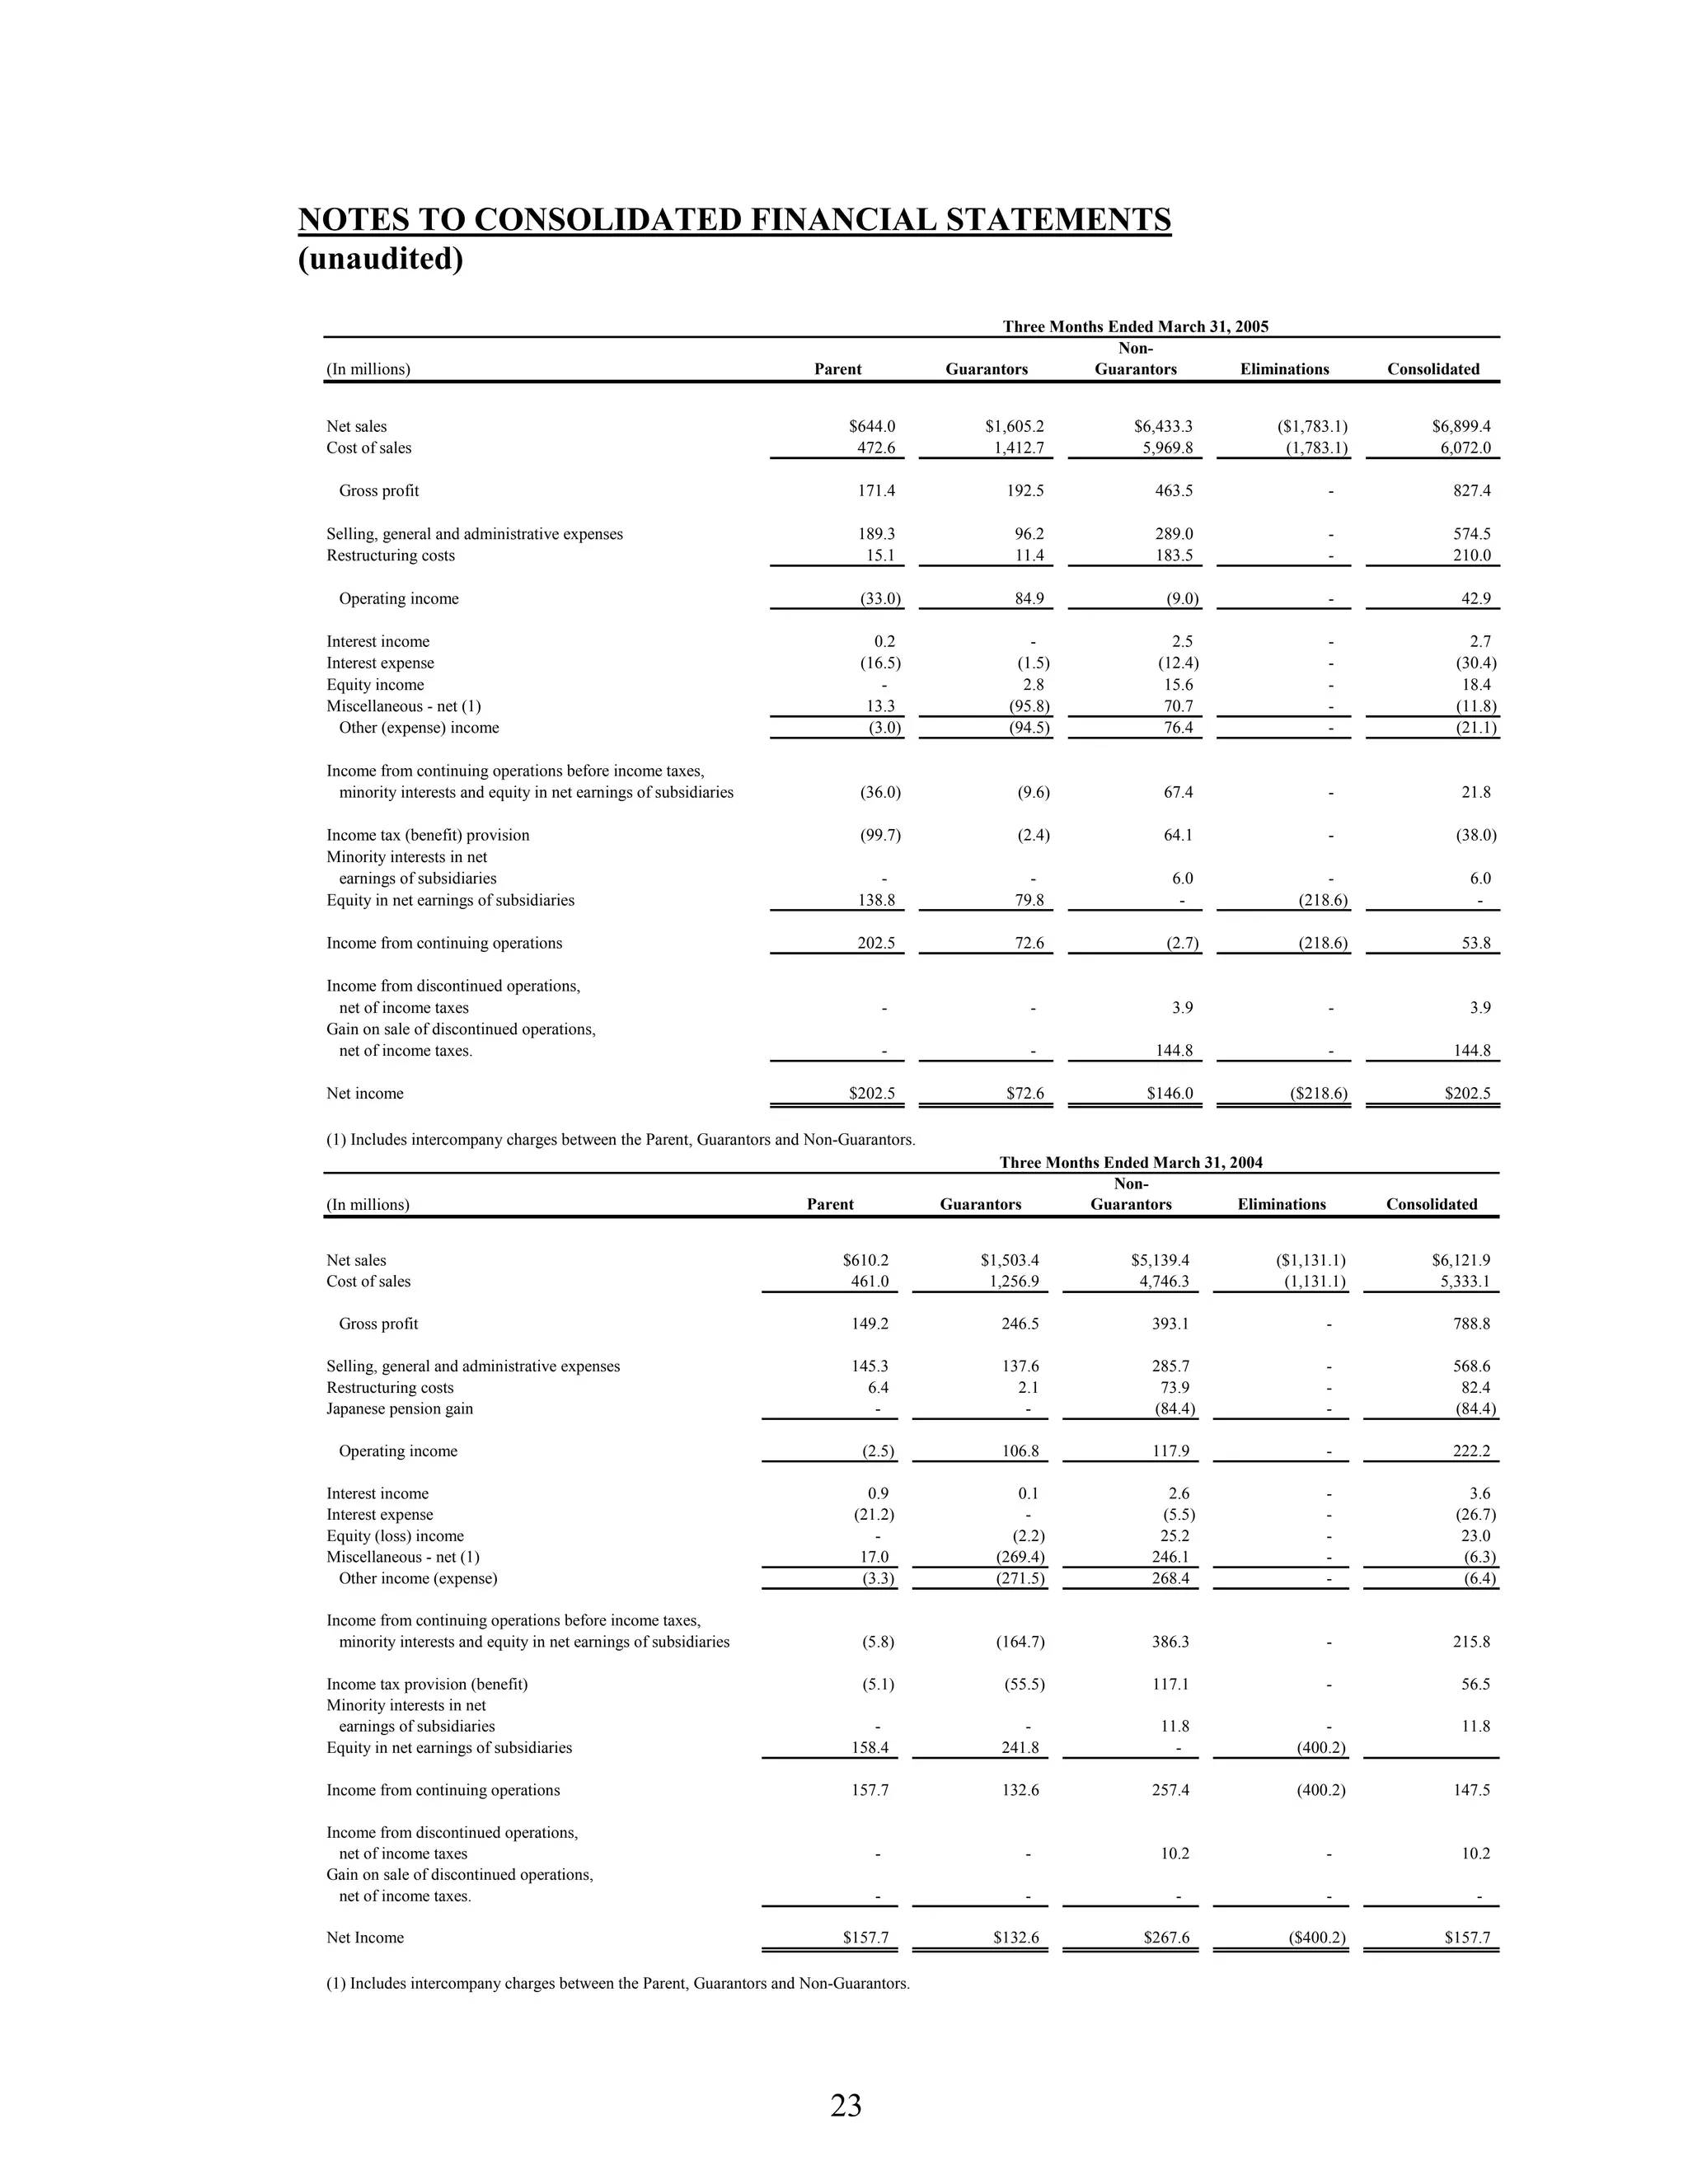
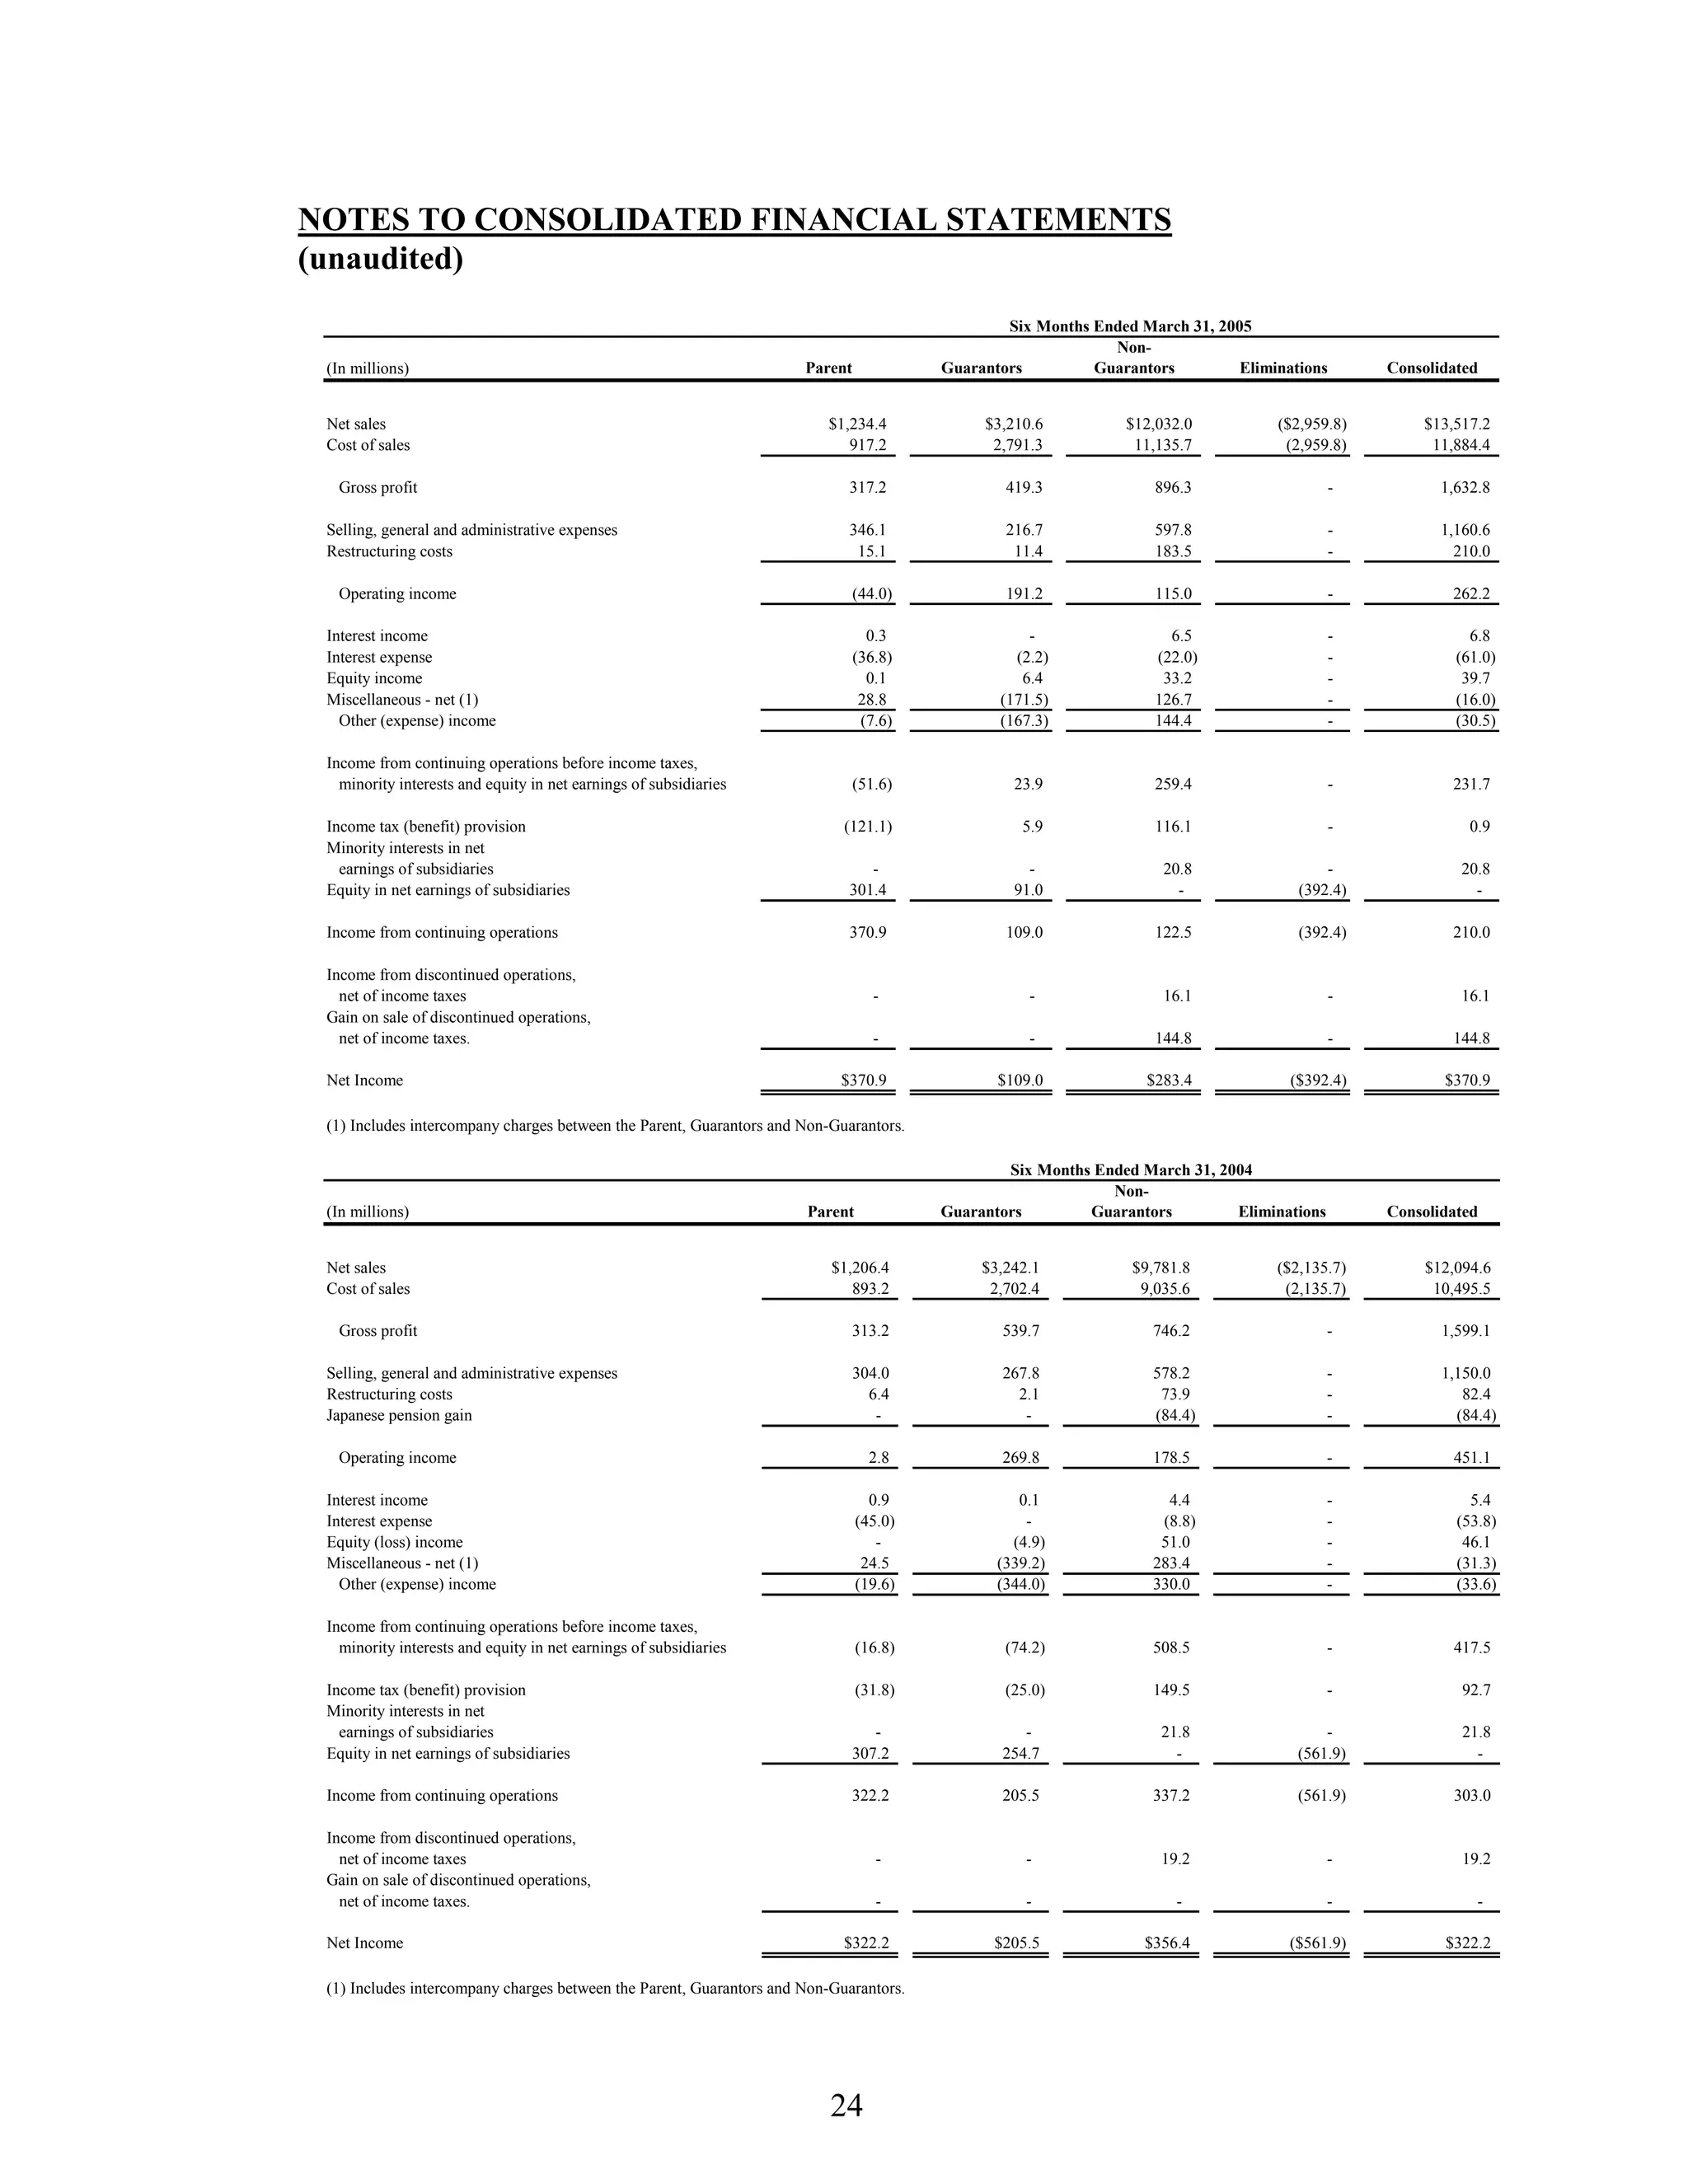
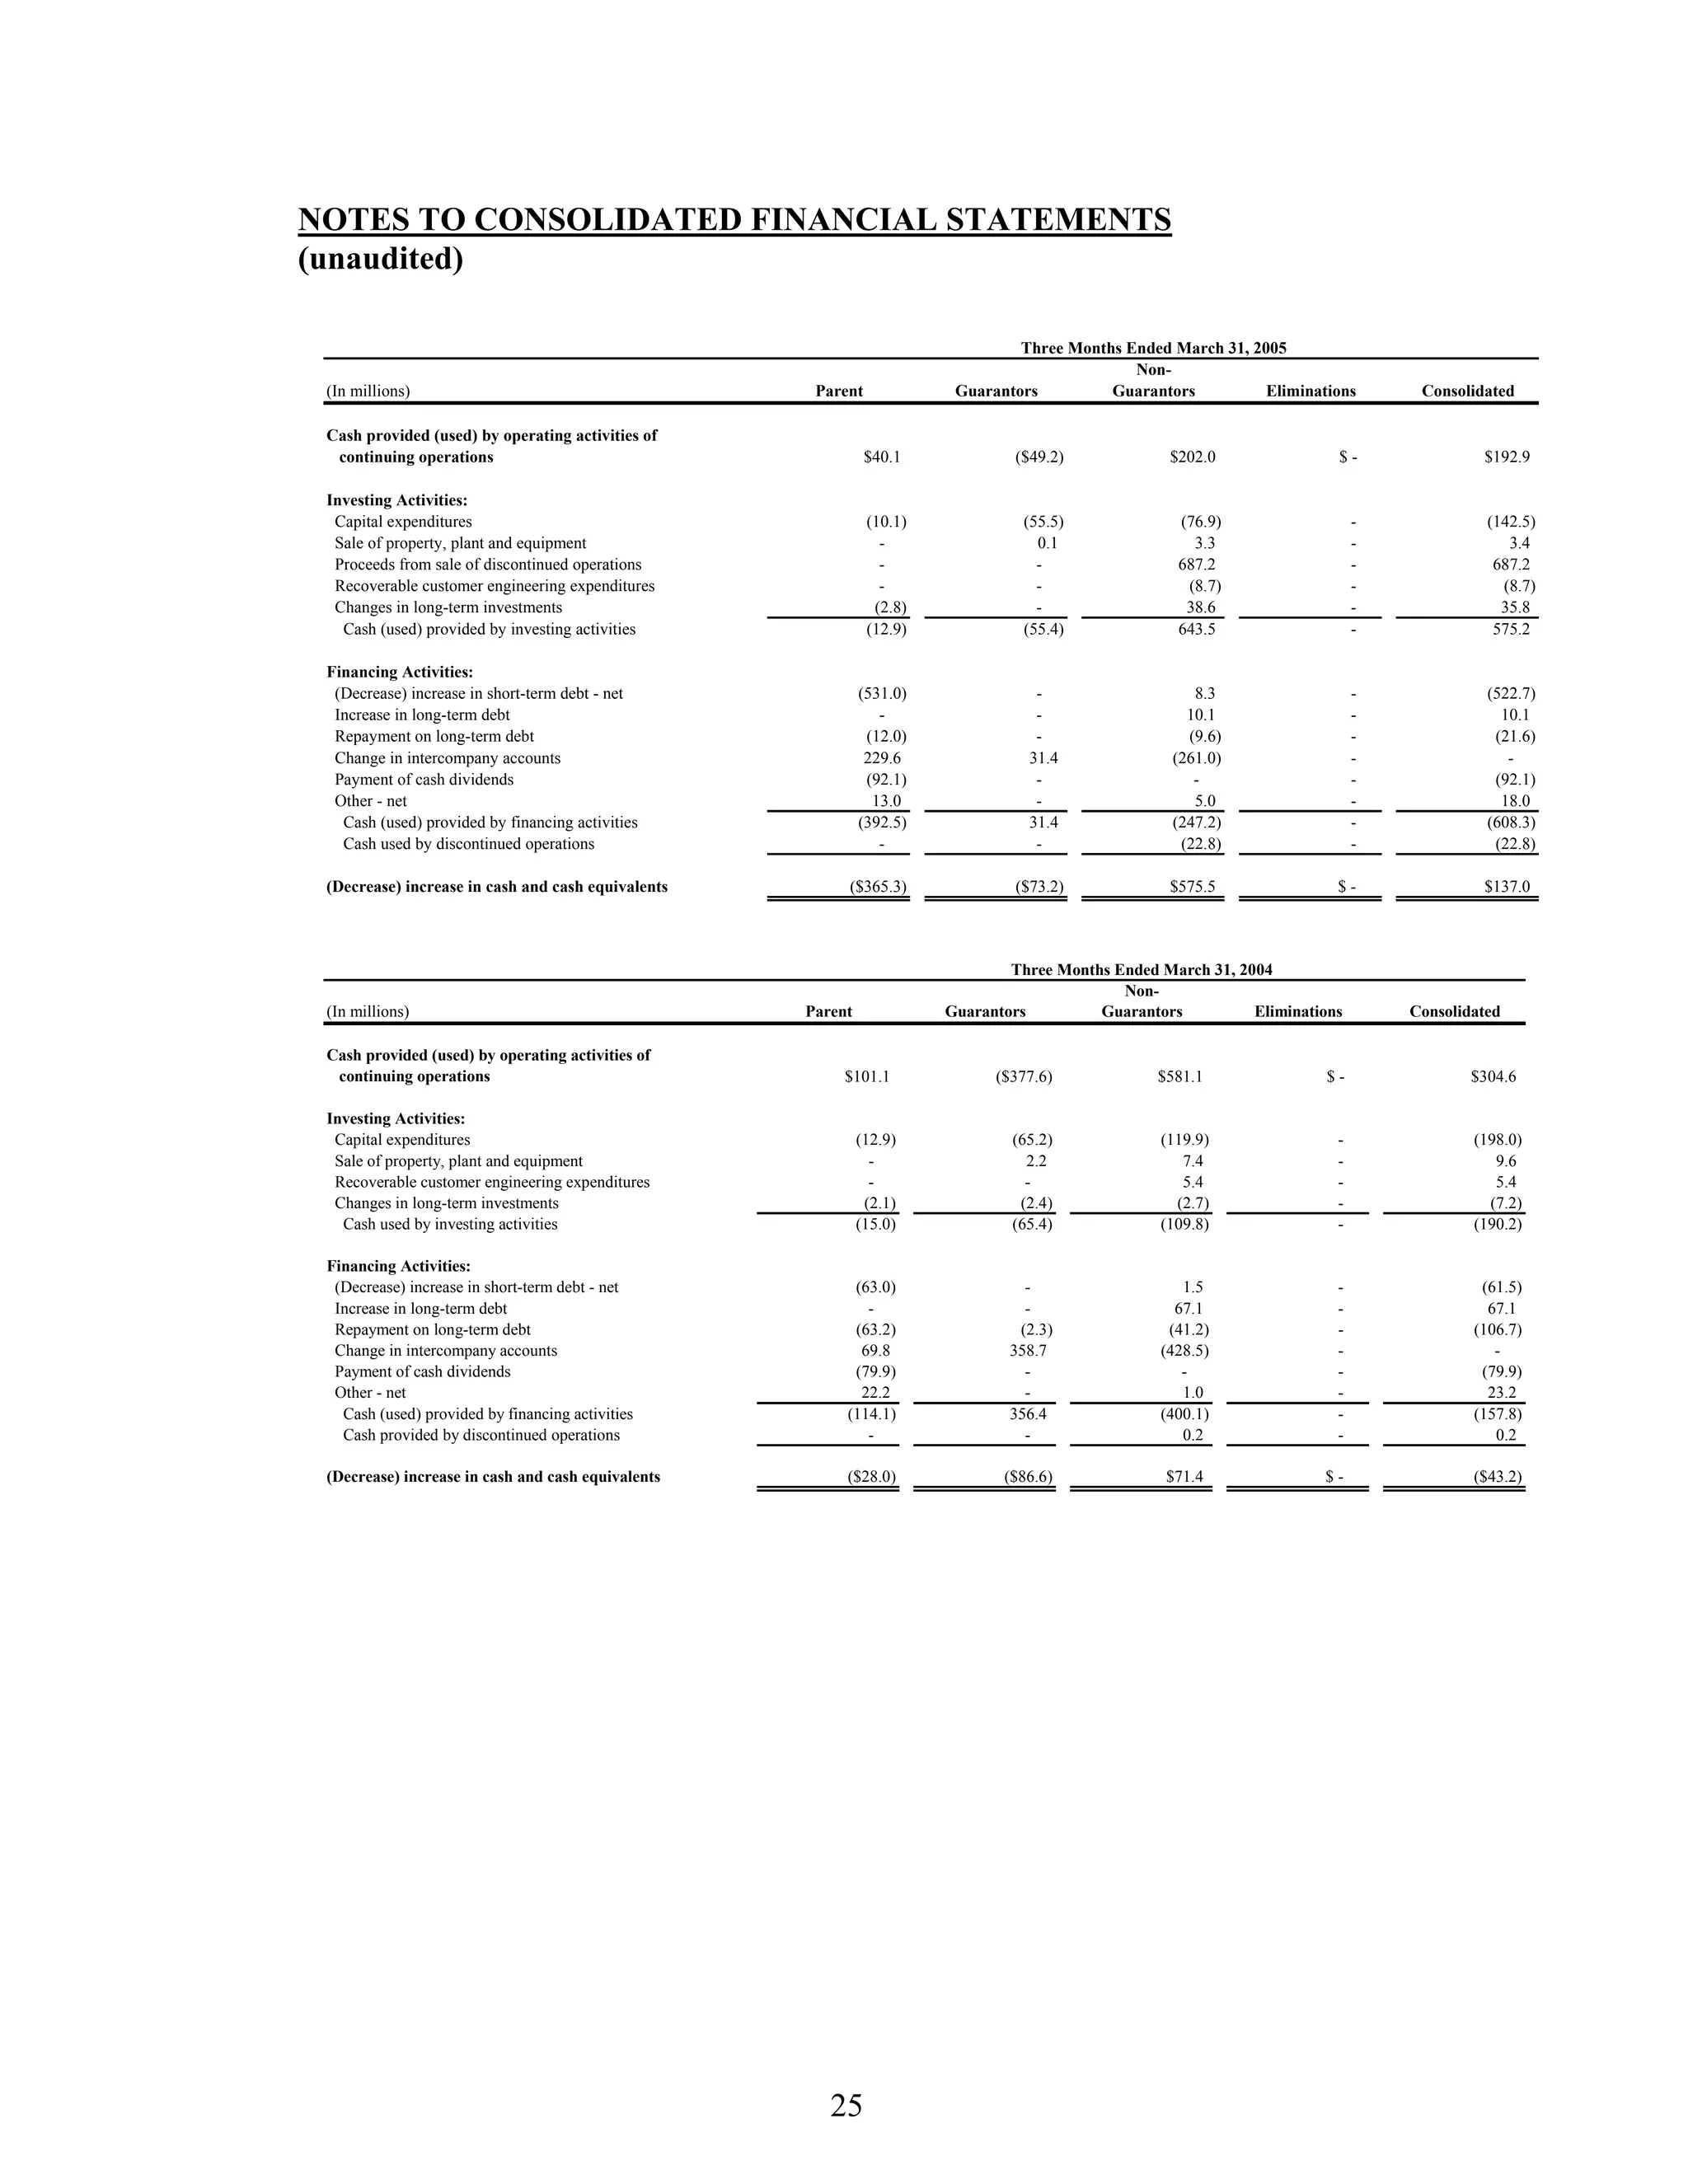
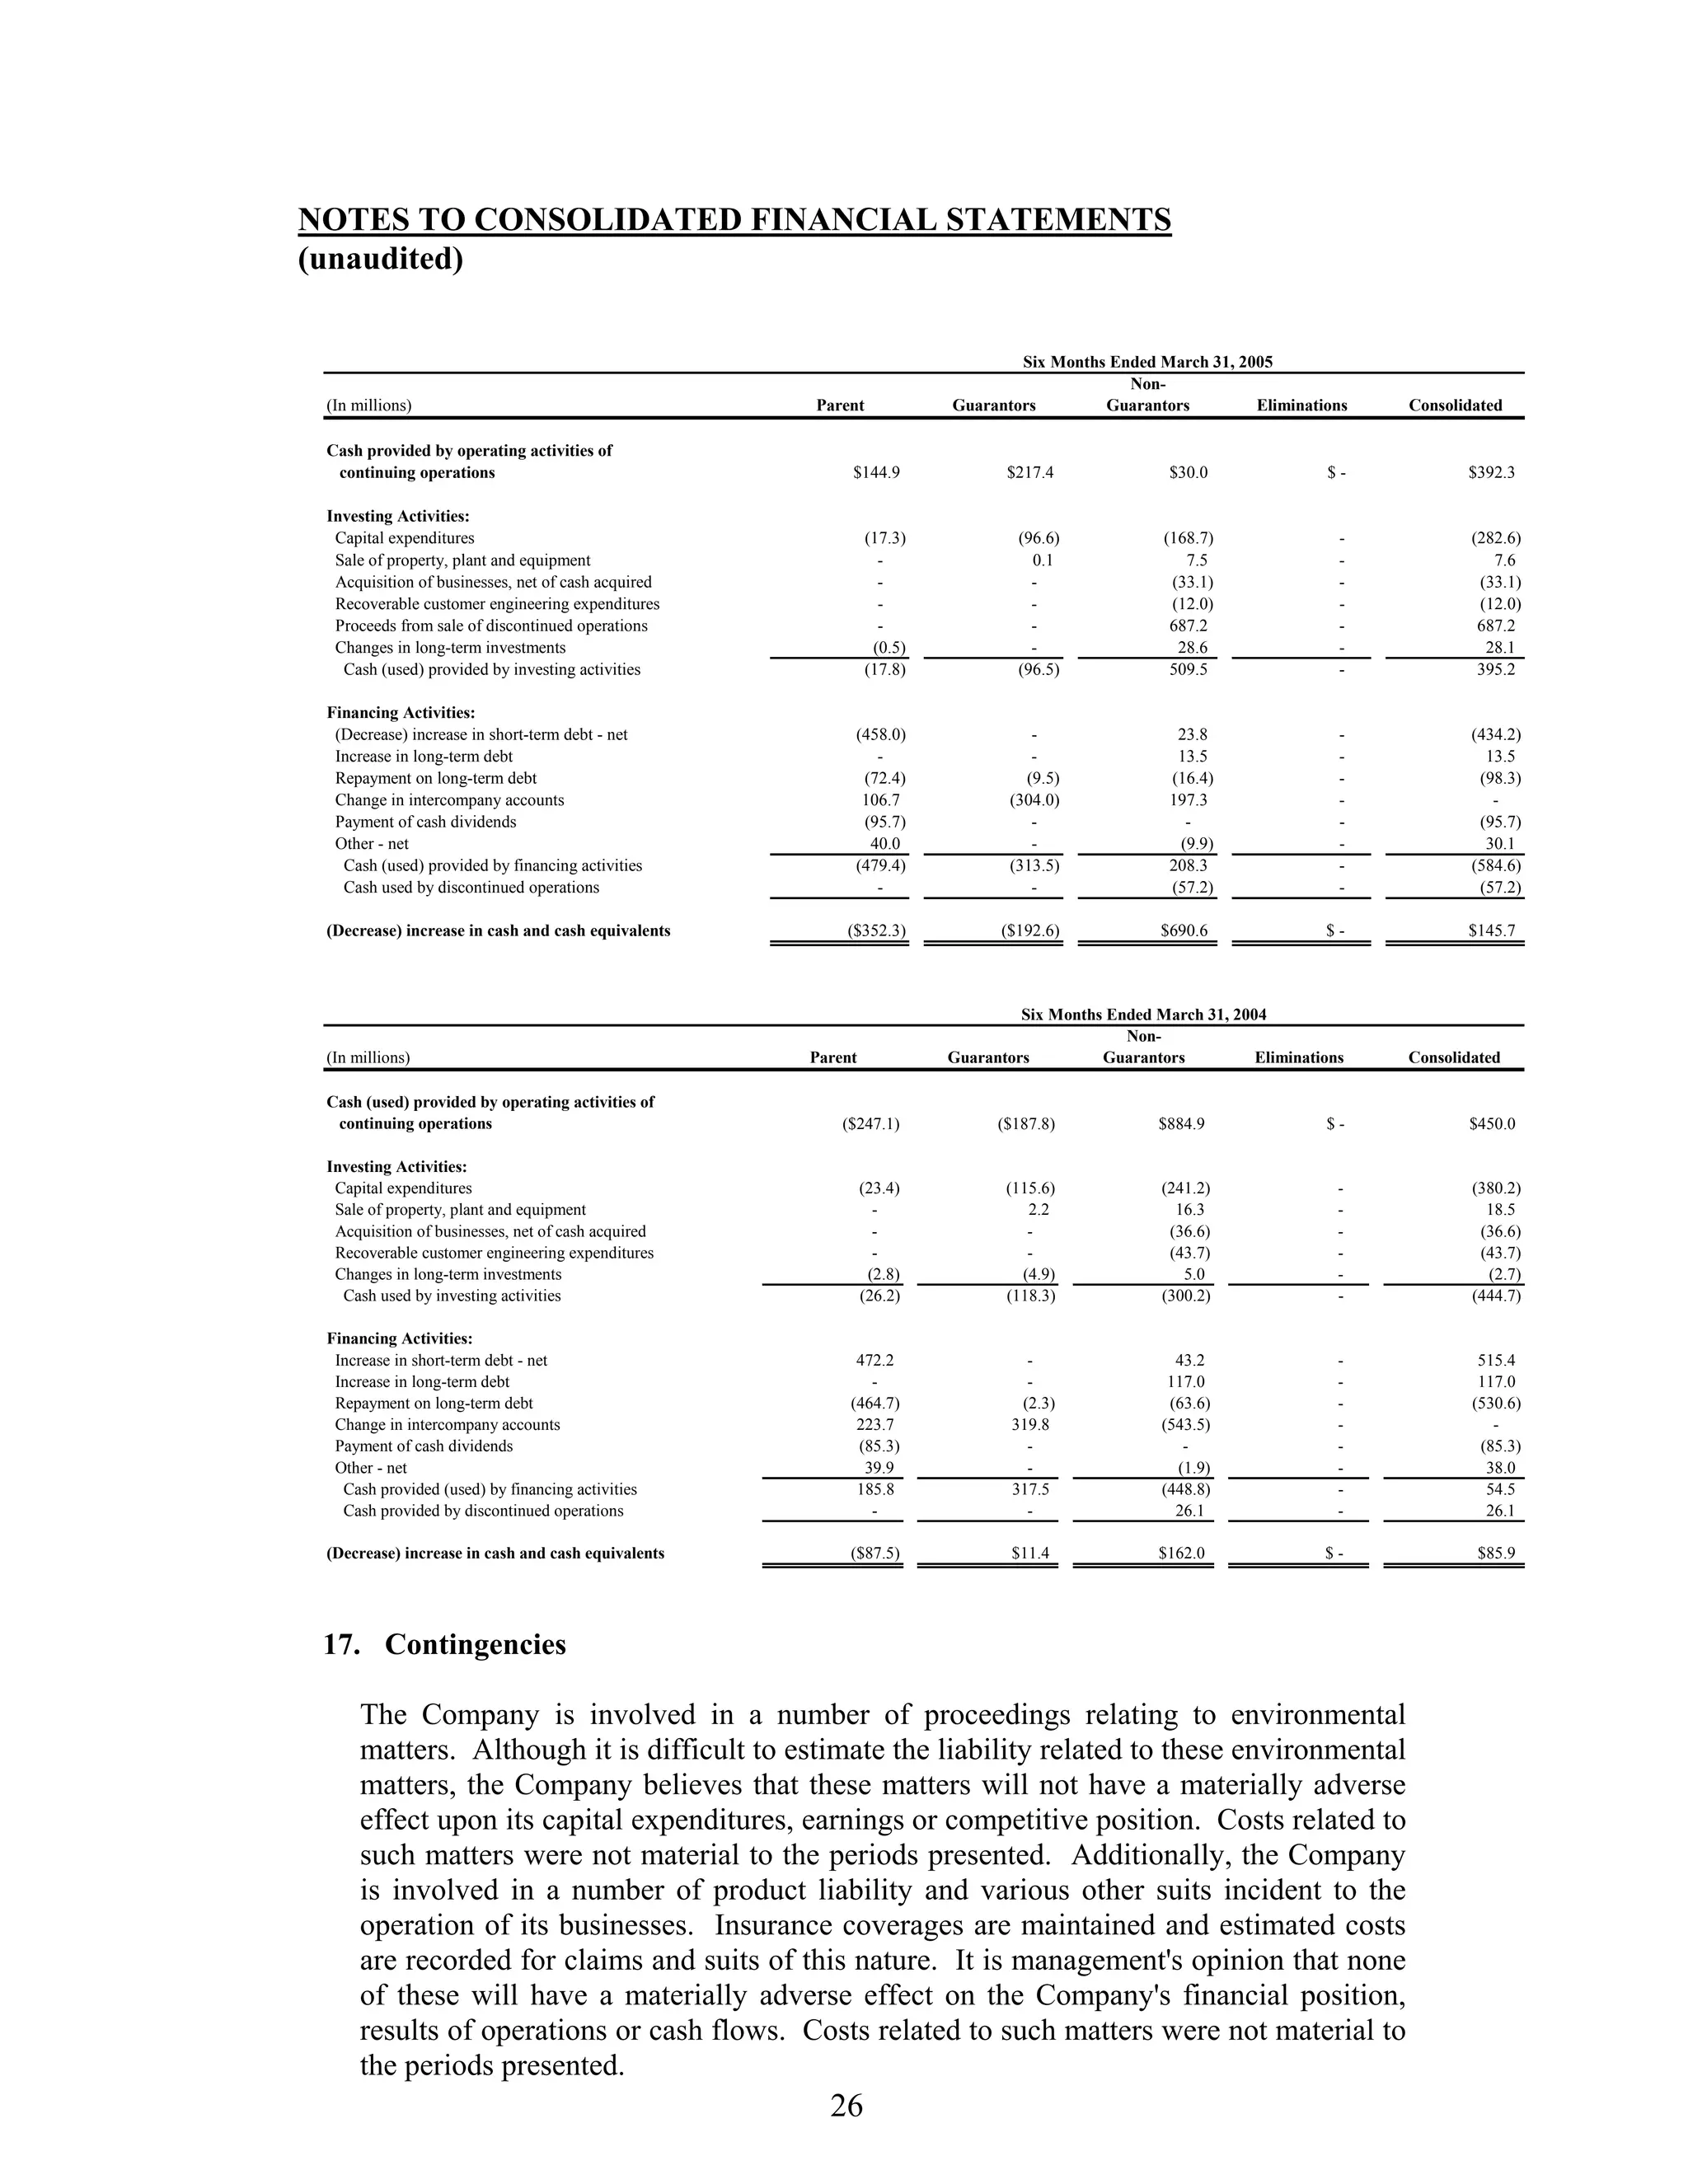
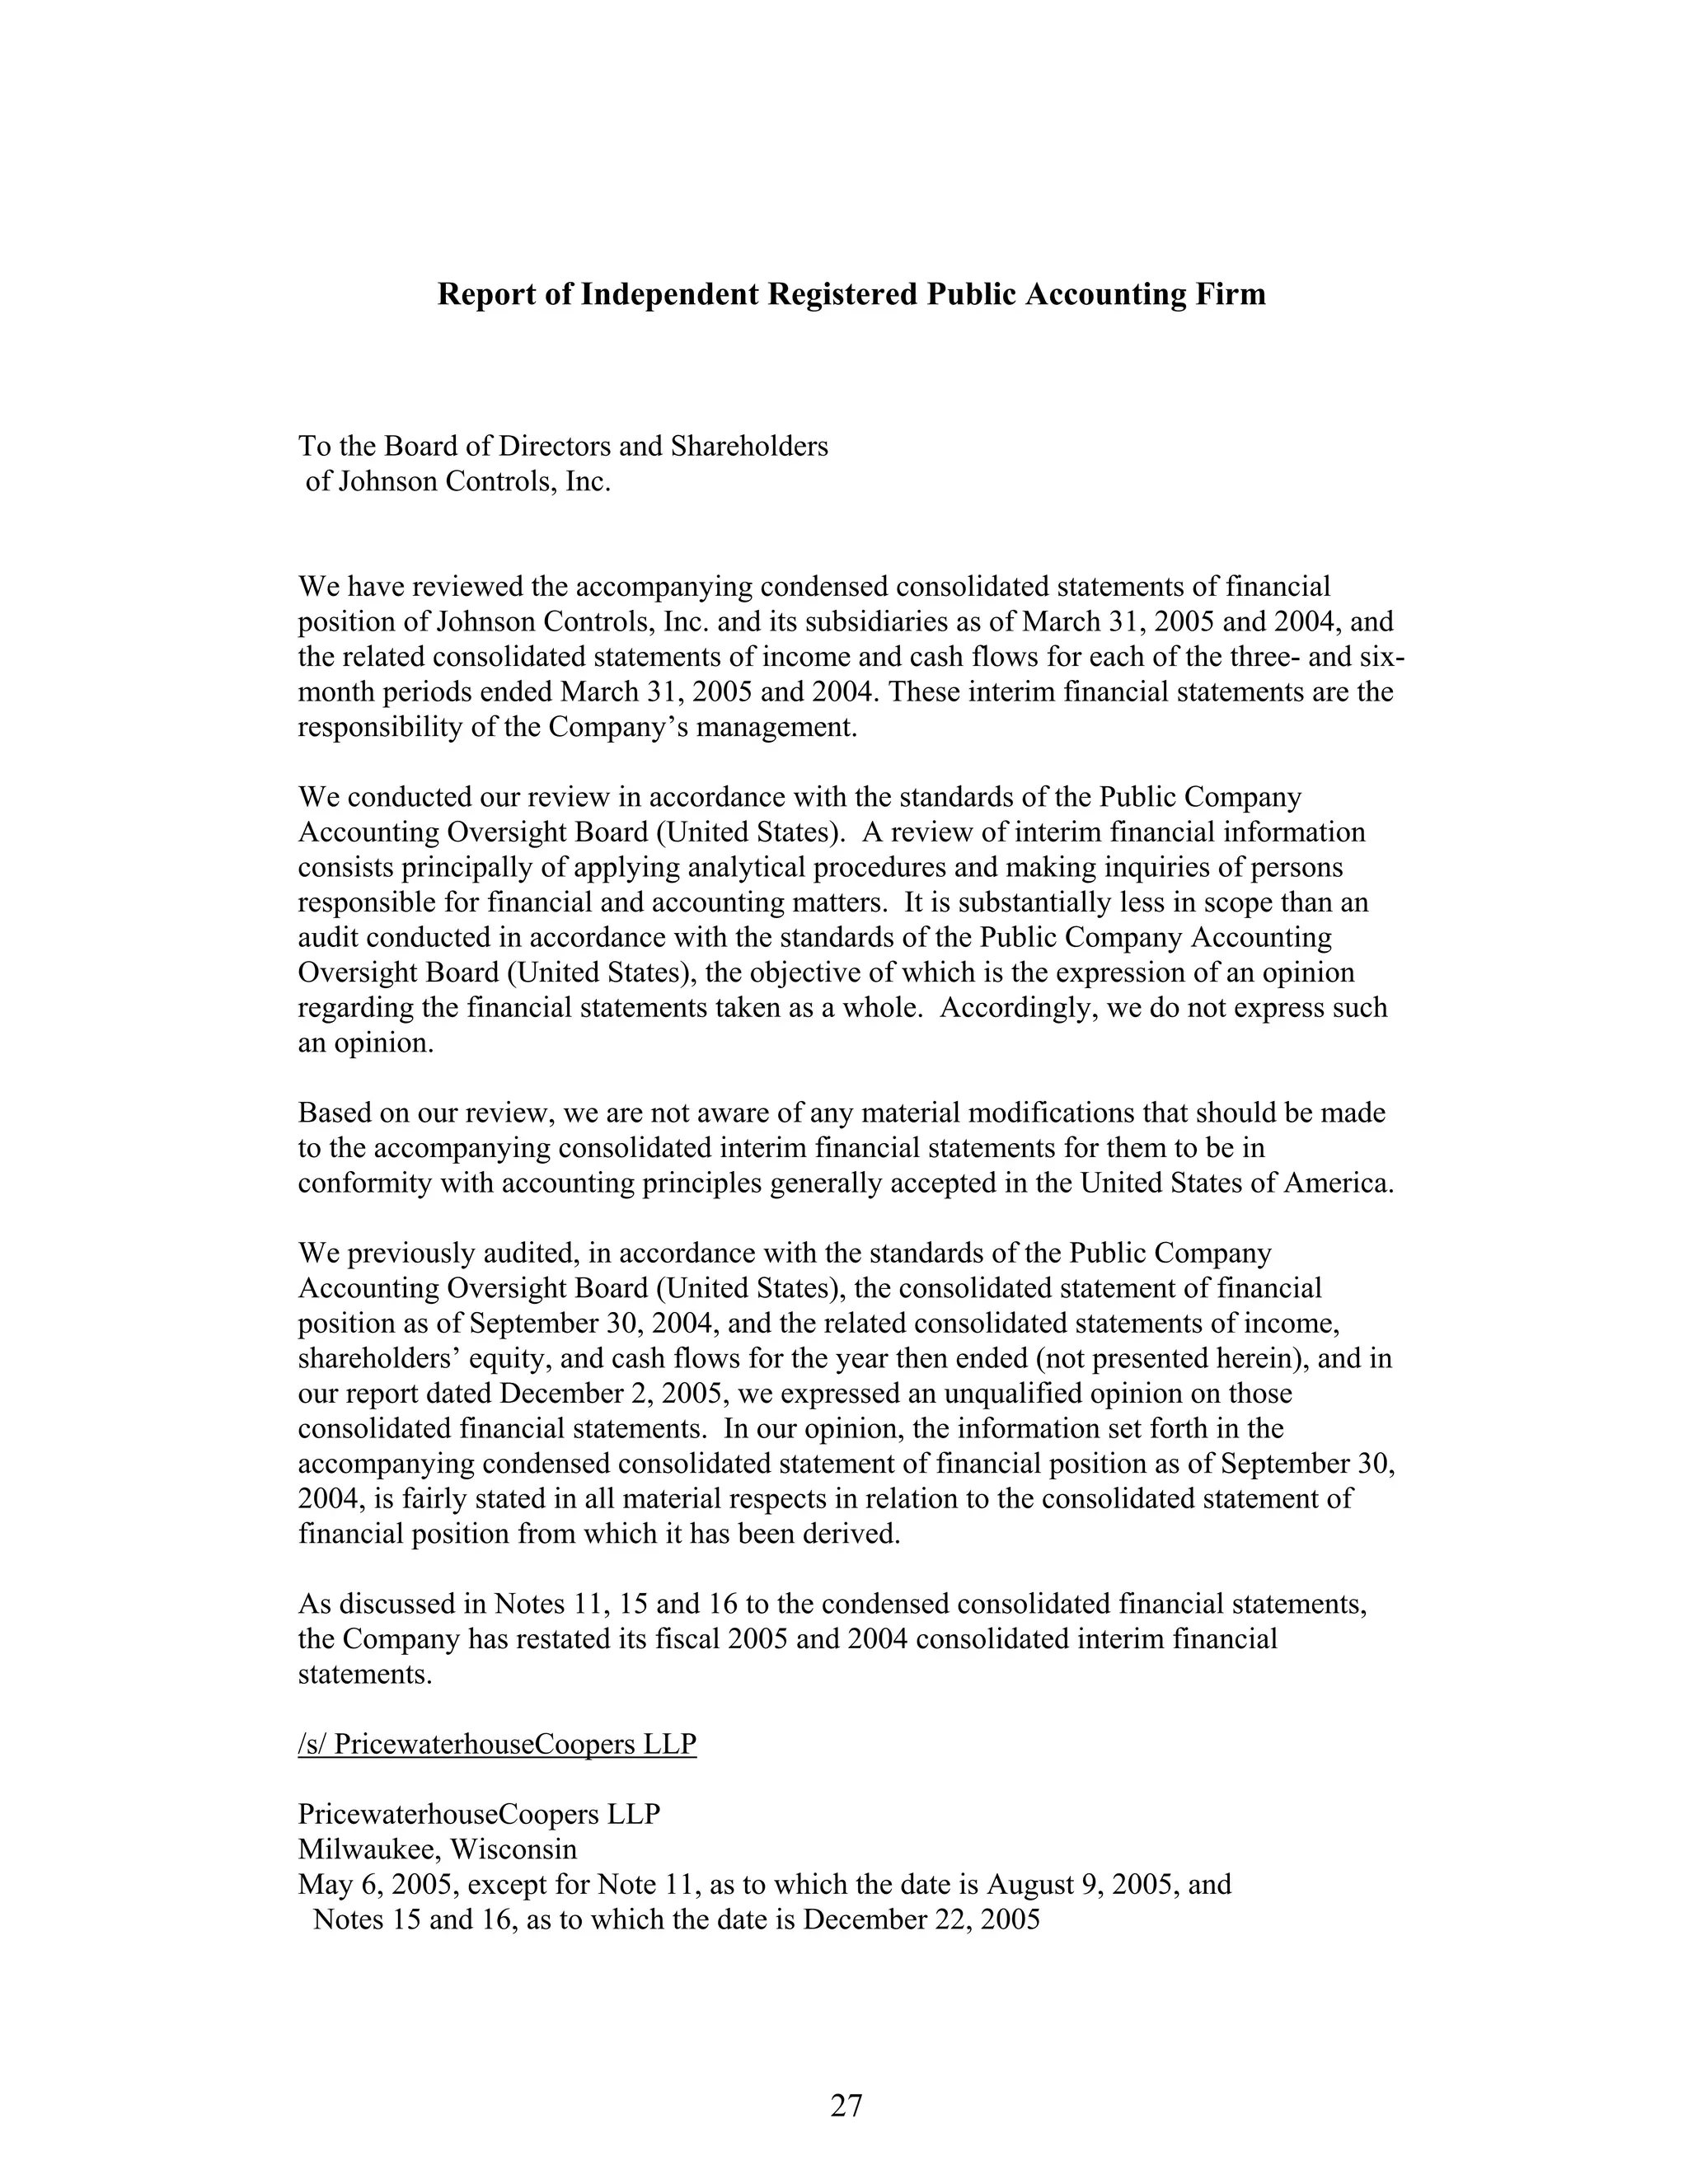
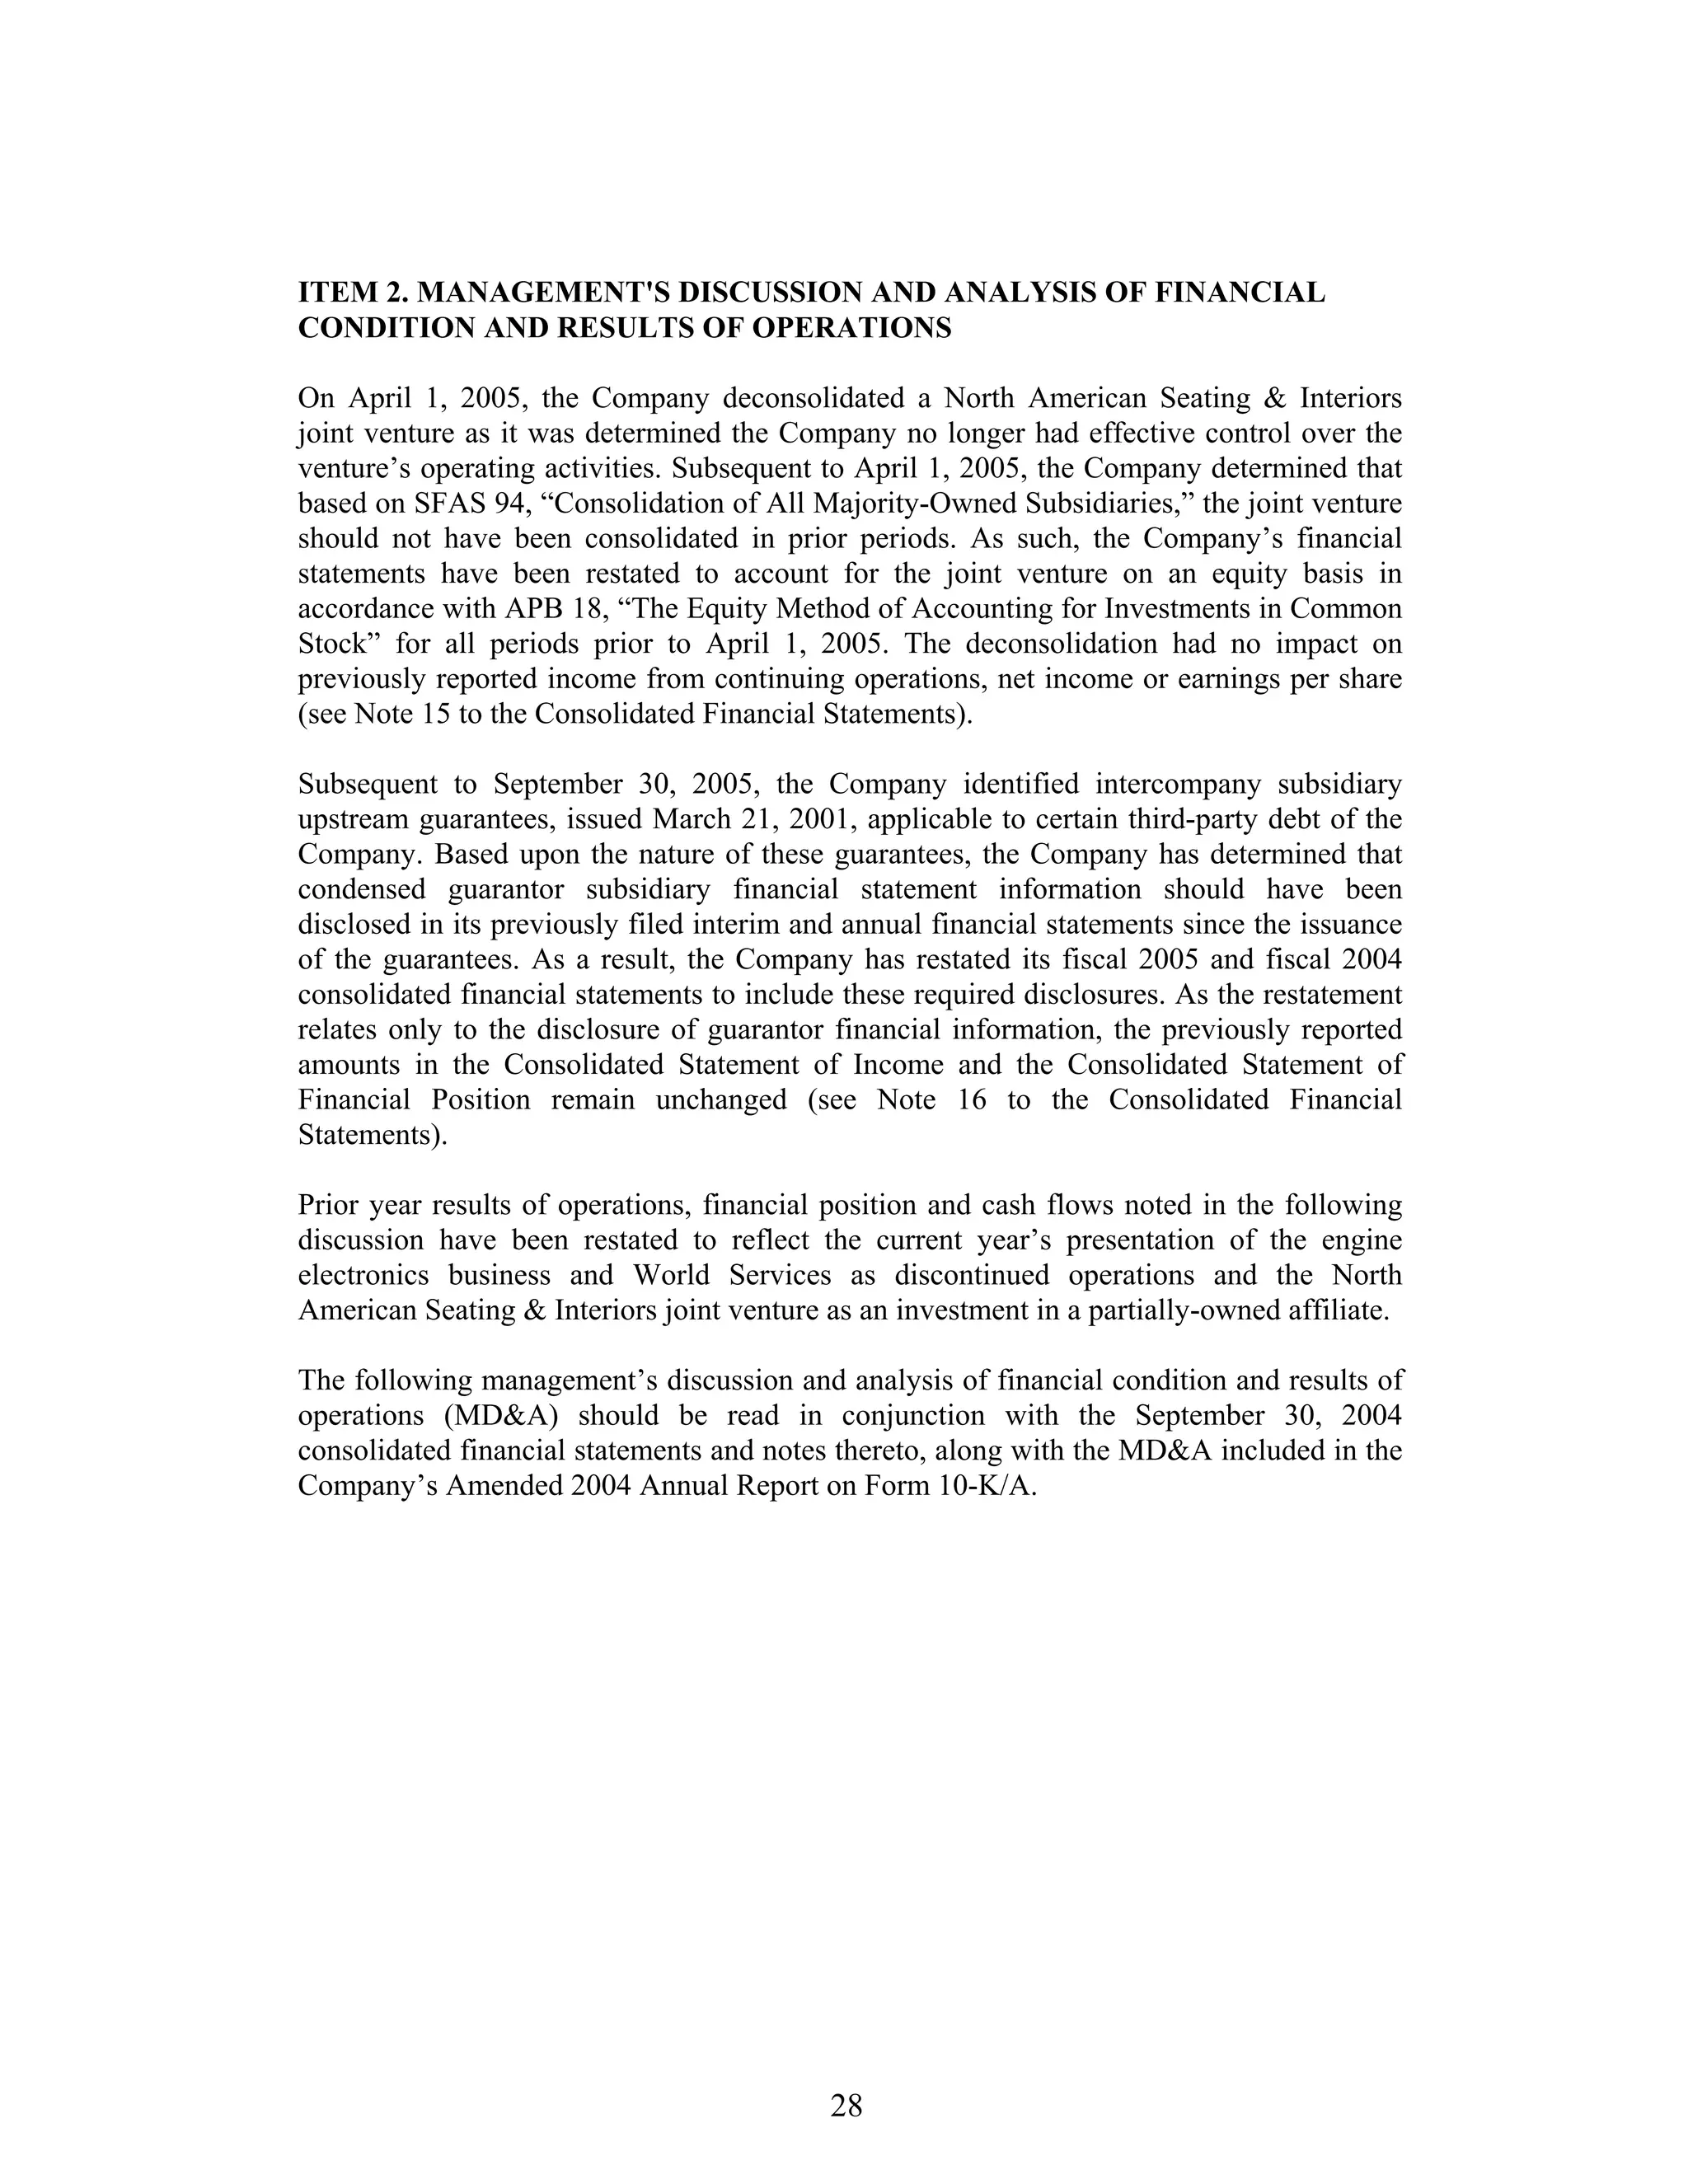
This document is Johnson Controls' Form 10-Q/A for the quarterly period ending March 31, 2005. It provides restated financial statements and notes to correct for the improper consolidation of a North American joint venture. The restatement impacts the presentation of certain financial data but does not change previously reported income, net income, or earnings per share. The document includes unaudited consolidated statements of financial position, income, and cash flows for the periods presented. It also provides notes to the financial statements and management's discussion and analysis of financial condition and results of operations.


![United Health Group [PDF Document] Form 10-Q](https://cdn.slidesharecdn.com/ss_thumbnails/1016632-thumbnail.jpg?width=640&height=640&fit=bounds)


