
Recommended
More Related Content
Similar to J)o aUtuxoa- q,rr{fAsl4 #S-CHAPTER 12 Spending by lndivi.docx
Similar to J)o aUtuxoa- q,rr{fAsl4 #S-CHAPTER 12 Spending by lndivi.docx (20)
More from priestmanmable
More from priestmanmable (20)
Recently uploaded
Recently uploaded (20)
J)o aUtuxoa- q,rr{fAsl4 #S-CHAPTER 12 Spending by lndivi.docx
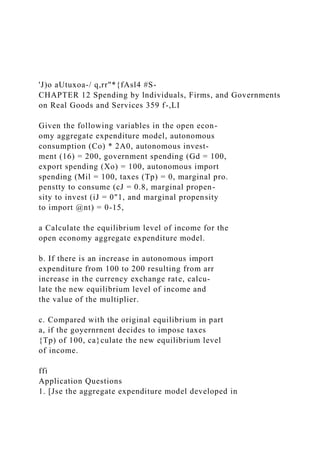
- 1. 'J)o aUtuxoa-/ q,rr"*{fAsl4 #S- CHAPTER 12 Spending by lndividuals, Firms, and Governments on Real Goods and Services 359 f-,LI Given the following variables in the open econ- omy aggregate expenditure model, autonomous consumption (Co) * 2A0, autonomous invest- ment (16) = 200, government spending (Gd = 100, export spending (Xo) = 100, autonomous import spending (Mil = 100, taxes (Tp) = 0, marginal pro. penstty to consume (cJ = 0.8, marginal propen- sity to invest (iJ = 0"1, and marginal propensity to import @nt) = 0-15, a Calculate the equilibrium level of income for the open economy aggregate expenditure model. b. If there is an increase in autonomous import expenditure from 100 to 200 resulting from arr increase in the currency exchange rate, calcu- late the new equilibrium level of income and the value of the multiplier. c. Compared with the original equilibrium in part a, if the goyernrnent decides to impose taxes {Tp) of 100, ca}culate the new equilibrium level of income. ffi Application Questions 1. [Jse the aggregate expenditure model developed in
- 2. this chapter to explain the following statements: a Coming amid continued turmoil in the finan- cial and credit markets, the report sent stocks lower, with the Dow Jones Industrial Average fatling 146.70 points F?idayto close at 11,899.69. b. Administration offlcials said they were confi- dent conditions would improve as tax rebates that are part of the recent $152 billion economic- stimulus package begin to reach consumers. c. The Fed is expected to cut interest rates again to prop up the economy. 2. Redraw Figures l2.11aand 12.11b to illustrate the effects on the resulting equilitrrium level of income trom ea,ch of the following changes: a A greater sensitivity of interest-related con- sumption and investment expenditure to changes in the interest rate. b. A larger multiplier in the aggregate expenditure model. Hint: Remember that consumption has an auton- omous component and is a firnction of dispos- able income, Iz4, where Ya= Y - Tp. the consumption ion is given by C = 800 + 0.8 {Y - T1), that nt (1) equals 200, and that government (G) and taxes (7p) or export spending.
- 3. a. Calculate the equilibrium lncome. b. If government purchases crease by 100 (all else held constant), the new equi- librium level of ue of the multiplier. c. Compared with government nditure (G) and Qp) so that the government budget remalns anced, does the equilibrium level remain unchanged? Explain your "r'';+ 3. Go to the Web site of the Conference Board (www.conference-board.org) and find the latest release of the Consumer Confidence Index. I{ow has the index changed since its last release? What is the expected impact of this change on the economy? 4. A number of articles in the Watl Street Jou,mraL reported that the strong dollar, combined with the recession of 2001, fbrced many U.S. manu- facturers to develop better methods to produce and sell their products. Usc the discussion of the nlacro model in this chaptcr to explain why busi- nesses would have implemented such changes in strategies. 5. What were the key provisions of the American Recovery and Reinvestment Act passed by
- 4. Congress in February 2009? How has the impact of the Act been evaiuated? 6. Compare and contrast current U.S. economic activity with that described in the opening case of this chapter. Economics for Managers, Third Edition, by Paul G. Famham. Published by Prentice Hall. Copyright O 2014 by pearson Education, Inc. each equai 200. l- W 358 PAffi;:iMacroeconomicAnalysis L2.BL2 E . 12.813 fi = 'tDh,sre n_D0- Ct: ;-t,l - wlt: gross private domestic investmenL p.332 induced <onsumption enpenditures, p.332
- 5. injections, p.347 interest-related expenditure (lBE) function, p.352 investment spending function, p. 340 leakages, p.347 marginal propensigr to consume (MPC),p,324 marginal propensity to save (/!lPS) , p.325 Multiplier, p.351 ,r ;, ;r*," ,.. ".."",] .,.'..-;.:.l'; net export expenditure, p.342 nominal interest rate, p. 327 nominal terms, p.323 personal consumption expenditure, p.324 potential GDB p.322 rea! i nterest rate, p. 327 real terms, p.323
- 6. relative prices, p.335 saving (5), p.325 unplanned inventory decrease, p.349 unplanned inventory increase, P.349 Exercises Tbehnical Questions The real interest rate increases. Consumer confi dence decreases. Higher taxes are imposed on business profits. The economies of many countries in the rest of the world go into recessions. .,. e*%q{ffi the following statements as to whether a. The have a than changes confidence. b. Both an increase government spending (G) and an increase taxes (7p) will shift the aggregate function in the same direction. c. The nationr ts show that real lncome always equals expenditure (E), giu the dqfinition of the ci,rcular floro
- 7. af econfimic a,cti,aitg. Thus, the economy must utwayb'be in equilibrium because that is also where I/= E a. b. C. d. af- ,--')-),-s -kahn, L4L @t zzti*-* u-, #3 Ca + Io+ Go + & - Mo + crY + irY - mrY .E6*(c1 *-m1)Y lco+ Io + Go + xo- Mol marginal propenslty to consume marginal propensity to invest marginal propensity to import Key Terms aggregate expenditure, p. 324 aggregate expenditure function, p. 345 autonomous consumption expendltures, p.332 budget surplus/deficit, p. 341 capacity utilization rates (CUBsl, p. 337
- 8. Consumer Confidence lndex (CCD , p.327 Consurner Sentiment lndex (CSA, p. 327 consumptian function, P. 324 currency exchange rate, p.343 equilibrium level of income and outpuL p.347 fiscal pollcy, p.341 government expenditurg p. 341 the difference fand which are no=tRQnlain your answer. the effect of the curreicy exchange rate Economics for Managers, Third Edition, by Paul G. Farnham. Published by Prentice Hall. Copyright O 2014 by Pearson Education, lnc. ing variables: meals that changes in weall.h Qr Application Questions Drawing on current business publications and tying the opening case of the chapter as a guide,
- 9. discuss how the slow economi" ,u"olr"ry in 201I and 2412 has affected the cument straiegies of flrms other than those mentioned in the cas-e. Wl,ealwv *@A/kv # I CHAPTER t 1 Measuring Macroeconomic Activity 3Lg ,Eil a. Howi CPI used? b. How is CPI market basket determined? What and services does the CpI cover? How are prices collected and reviewed? From the tics Web page (wwwbls.gov , find annual averages of the emplo;rment of the civilian noninsti- 1940 to date. Constructtutional population C. d. (ro, a table and chart noninstitutional force, the num ofe 1969, 1982, Discuss time peri the size of the civilian on, the civilian labor
- 10. , the number of 20A7, and ZAtl. these variables di,$ered in thoser). Ftom the Bureau of Econffic Analysis Web page (wwl,r.,.bea.gov), construct"a table showing the/". 7. Ftomanrru{ percentage cydrge ih.real GDi gross pri_ Web sivate domestic inveritfnent @,'ngnresid"ritiui fix"a 11y9.ftn9nt, and pdsidential fixed..inveshnent from re these revisions for your example? Bureau of Lalror Statistics Web page (u.ww.bls.gov/cpi), find the answers to the foilow_ ing questions: years? Are there c among those of trade ning ZC0Z to 2A11. Vnch component of investment had which was the shortest?the greatest impact on the recession of2007 to 200g? 4. md.T arfcte in a current business publication on current business publications, find an 3:r^9"-?4"esrevisiors in the GDp aata How sig_ cle in which either fiscal or monetary policy were describing their goals of maintain_
- 11. (www.nber.org), flnd the official begin- ending dates of the recessions that hive since 1965. Which recession was the lon_ ing stable prices, full emploS.ment, and adequate economic growth over time. Which goal was the most important at the time your u.ii"l" -*written? Do the percentagesr cor spent on (6), investment (I), fuvernment (G) and imports (/fl diffesignifican Economics for Managers' Third Edition, by Paul G. Farnham. Published by prentice Hall. copyright @ 2014 by pearson Education, Inc. 1980, 1990, 2000, and 2010. Show the change in real over each of those unemployed, over the period? Bureau or s"on}ri" Besearch Dy )cdn r-n4l $1 ,"aa&* */ IE 3fB PART2 MacroeconomicAnalysis Exercises Teehnical Questions 1. Do government statisticians
- 12. ply adding up the total sales of in one year? Explain. 2. Evaluate whether oIJ of following are ered to be investment in calculating GDP. a. The purchase new automobile for nonlrusiness 5. 6. Is real GDP defined as "the value of aggregate out- full emplo;rment"? Suppose an economy ces only two goods, cups of coffee Table 11.E1: ons of milk, as_ expenditure good and the and real GDP 10, the base year. this each of the three alter- hrplain the between nominal GDP and real GDP in each ofthese cases. Adding to Thble 11.1, if in 2007 real GDP was $13,206.4 billion and nominal GDP was $14,028.7 billion, calculate the percentage change foom 2006 b 2A07 in nominal GDP, real GDi and the price level. What is the value of the GDP deflator in
- 13. 2407? GDPbysim- firms a. b. b. The c. The ofanew house of corporate 3. Exlplain transfer such as Social compensation, are in calculating t true that of U.S. imports is added exports w calculating U.S. GDP because imports spending by Americans? E:rplain. NominalVersus RealGDP 201 0 (The base year) Expenditure 201 1 (Case 1) Expenditure 201 1 (Case 2)
- 14. Expenditure 201 1 (Case 3) Expenditure COFFEE (CUPS) MILK (GALLONS) GDP (NOMINAL, REAL) Price s1.00 Price 51 .s0 Price si.00 Price $1.s0 Quantity 10 Quantity 10 Quantity 15 Quantity
- 15. 15 Price s2.00 Price 54.00 Price 52.00 Price 54.00 Quantity 20 Quantity 20 Quantity 40 Quantity 4A Economics for Managers, Third Edition, by Paul G. Farnham.
- 16. Published by Prentice Hall. Copyright O 2014 by Pearson Education, lnc. 3).