presentatie voor de campaign 'let your blue jeans talk ... green'. Ecologische en sociale impact van kledij, meer bepaald jeans. Het hele lessenpakket is te downloaden op http://greenjeans.be/index.php?option=com_content&view=article&id=55&Itemid=37
This document discusses key economic concepts through examples related to a student's Saturday activities. It includes:
1. A pie chart showing how a student spends their time on a typical Saturday between 4 activities.
2. A line graph comparing time spent on the student's top 2 activities.
3. Diagrams of production possibility frontiers to illustrate opportunity costs between studying and working with a limited time budget.
4. Questions asking the student to identify ways to increase productivity of Saturday activities, calculate various opportunity costs between activity combinations, and identify an infeasible production point.
A Digital Eurovision for European UnionRene Summer
A Digital Eurovision for the European Union – the next step for European Public Service Broadcasting without frontiers. Why and how we must increase the availability of public service broadcasting to the widest Pan-European use.
This paper aims to initiate a discussion in Europe about the future of mass media in relation to the possibilities that can be achieved through technological development and policy innovation to stimulate the rise of a Pan-European identity across the European Union. By classifying current affairs reporting (news, current affairs and documentaries) produced by/for public service broadcasters (PSB) to fall within the definition of Open Government Data, European policy makers will unlock access to a wealth of European PSB content for European citizens, journalists and new start-ups to access, interact with, aggregate and disseminate. Such policy innovation not only comes with the already acknowledged economic benefits associated with open data and data-driven innovation; it also helps stimulate the creation of a strong Pan-European identity through increased Pan-European access to national stories, news and identity projections.
RSA-Pivotal Security Big Data Reference ArchitectureEMC
This paper talks about how customers can use RSA and Pivotal to get better visibility into their environments, more context to help them prioritize issues, and actionable intelligence from a diverse set of sources
The document proposes simplifying authorization models for file access by classifying files and controlling access based on Active Directory attributes and claims. It suggests stopping the creation of thousands of groups and instead deploying an access model that classifies files and controls access to files based on AD attributes like a user's group memberships, location, and impact level of the file. The document demonstrates this access model and compound IDs that contain a user's group memberships, claims, and device information to determine authorization.
4 Ms of Big Data: Make Me More Money – InfographicEMC
Big data can transform businesses by improving key processes and turning data into business value. The document outlines four strategic business tactics for leveraging big data: 1) Using big data to power business strategy and make better, faster decisions. 2) Defining opportunities to monetize business insights from big data. 3) Enhancing user experiences with insights from big data. 4) Getting the latest insights from big data experts.
The document discusses templates, instances, and services in a cloud computing environment. Templates specify machine and connectivity requirements and deployed services are always linked to their templates. Instances are groups of machines that work together and include machine definitions and applications. Services act as the starting point and source of truth, with a service refresher that identifies missing virtual machines and supports OK and needs attention states.
Slaves were imported into the Caribbean in the 1600s to work on sugar plantations, as the map shows the key Caribbean countries that benefited from the slave trade. Students are tasked with writing a persuasive letter to European Union leaders supporting or disagreeing with the claim that wealthy European countries that benefited from slavery should pay reparations to poorer Caribbean countries, using evidence from an article by Cecily Jones to back their argument.
This document provides economic data for two countries. Country A had a 2007 GDP of $4.38 trillion, population of 127 million, labor force of 66.7 million, and 2.53 million people searching for work. Its GDP per capita was $34,496.06 and unemployment rate was 3.8%. Country B had a 2007 GDP of $1.84 trillion, population of 188 million, labor force of 99.47 million, and 9.74 million people searching for work. Its GDP per capita was $9,776.60 and unemployment rate was 9.8%. The document asks which country would be better to live in without a job, which is rich/poor, how to help the poor country
This document contains a worksheet on supply and demand equilibrium for cotton t-shirts. It includes graphs of the supply and demand curves for t-shirts and questions about how the equilibrium price and quantity would change in response to shifts in supply or demand. For example, it asks how the demand curve would shift if a celebrity was seen wearing one of the t-shirts or if a cotton crop was damaged by insects. It also contains questions about equilibrium price, surplus, shortage and how producers would respond to changes in oil prices and supply/demand.
This document provides an overview of the syllabus and schedule for a US History summer school class from June 2-13 at Mountain View/Marana High School. It outlines the daily schedule, assignments, topics to be covered including what defines an American and early colonial history. Students will analyze primary sources, create maps, discuss bias in images, and write a letter to the NFL commissioner arguing for or against changing the Redskins team name. The class uses interactive group activities and aims to make history relevant through discussion of why students should care about different time periods and events.
This document outlines the agenda and steps for a hands-on session on implementing linear regression using MapReduce on Hadoop. The objective is to use a dataset of fish observations to predict the number of rings on a fish's shell based on other attributes. Attendees will copy sample data to HDFS, generate a larger dataset by replicating and modifying the samples, then use MapReduce to train a linear regression model to predict the number of rings based on the other attributes.
This document provides data on the costs of producing hot dogs per hour for a business. It includes the fixed costs (FC), variable costs (VC), total costs (TC), average fixed costs (AFC), average variable costs (AVC), average total costs (ATC), and marginal costs (MC) for outputs ranging from 0 to 10 hot dogs per hour. It instructs the reader to graph MC in red, ATC in blue, AVC in green, and AFC in black based on this data.
This is the Swipp Plus Quick Start guide. This user guide outlines the steps needed to create a Swipp Plus account, create Swipp widgets and manage your control panel and dashboard. It also shows how to integrate Swipp widgets into Wordpress, Blogger and other common blog and content management systems.
The document appears to be notes from a history class discussing early Spanish exploration of the Americas in the 15th and 16th centuries. It covers several key topics:
- The motivations of the Spanish explorers, which were "God, Glory, Gold" - spreading Catholicism, increasing Spain's prestige, and finding wealth.
- Famous explorers like Christopher Columbus and Ponce de Leon who were searching for things like the Fountain of Youth.
- The advantages the Spanish had over indigenous people, such as guns, disease, steel, and horses.
- The Spanish goal of making native people Catholic and building Catholic missions.
"Wat maakt dat we consumeren op een manier die onverantwoord is, zowel sociaal als ecologisch gezien?
Houdt overconsumptie ons niet weg van de dingen die er echt toe doen? Kunnen we als samenleving kiezen
voor een duurzame manier van samen leven en hoe doen we dit dan?"
Consumenten worden tegenwoordig overspoeld met informatie over nieuwe producten en diensten. Neem
daarbij nog de vele reclame en het wordt quasi onmogelijk om de juiste keuzes te maken. In deze vorming
wordt uitgelegd hoe je door bewust te kiezen het milieu en je portemonnee spaart. Er worden handige tips en
tricks aangereikt om bewuster te leven.
In deze lessenserie over plantenteelt en -veredeling worden drie contexten behandeld. De eerste context gaat over de komkommerkwekerij en centraal staat de vraag welke biologie een komkommerteler gebruikt om zoveel mogelijk komkommers van goede kwaliteit van een komkommerplant te kunnen oogsten. In de tweede context draait het om de bescherming van de komkommerplant. Want zodra de kas bij mooi weer opengaat kunnen plaaginsecten zoals witte vlieg en trips naar binnenkomen. Biologische gewasbescherming met roofmijten om plaaginsecten te bestrijden, vormt de rode draad van dit hoofdstuk. In het derde hoofdstuk is de context groenteveredeling en stoeien leerlingen met de vraag wat er bij komt kijken om tomaten nieuwe eigenschappen mee te geven. Ze moeten op zoek naar een tomaat die niet teveel vocht verliest bij het doorsnijden maar toch smaakvol is. Een dergelijke tomaat zou heel geschikt zijn in kant-en-klaar maaltijden en maaltijdsalades. Belangrijke (deel)concepten die langskomen zijn: fenotype, genotype, prooi- predator, voedselweb, interactie met biotische en abiotische factoren. De module duurt 6-9 lesuren en is geschikt voor bovenbouw havo/vwo.
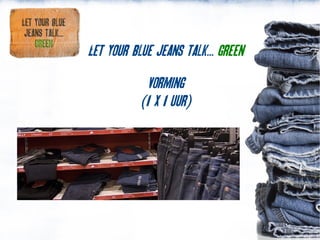
1. Let your blue jeans talk... green
Vorming
(1 x 1 uur)
2. Let your blue jeans talk... green
Campagne gelanceerd op 28 oktober 2009
door
Netwerk Bewust Verbruiken, Schone Kleren
Campagne, Test-Aankoop, Ecolife en VODO
met
Steun van de Vlaamse Overheid
3. De campagne
Consumenten aan de hand van het
voorbeeld jeans bewust maken van de
ecologische en sociale knelpunten die
voorkomen in de productie van kleding
Aanbieden van alternatieven voor
conventionele jeans
9. energie
Bij welke fase in de levensloop van een
jeansbroek wordt het meeste energie
verbruikt?
A. Bij de productie van katoen.
B. Bij het weven van de onverwerkte
katoen.
C. Bij het gebruik van de jeans door de
consument.
10. energie
Bij welke fase in de levensloop van een
jeansbroek wordt het meeste energie
verbruikt?
A. Bij de productie van katoen.
B. Bij het weven van de onverwerkte
katoen.
C. Bij het gebruik van de jeans door de
consument.
12. transport
Hoeveel kilometer legt een jeansbroek –
gemaakt van katoen uit Oezbekistan – af
vooraleer ze in de winkelrekken terecht komt?
Ter referentie: de afstand tussen Brussel en
Peking bedraagt 8.000 km.
13. transport
Hoeveel kilometer legt een jeansbroek –
gemaakt van katoen uit Oezbekistan – af
vooraleer ze in de winkelrekken terecht komt?
Ter referentie: de afstand tussen Brussel en
Peking bedraagt 8.000 km.
23.000 kilometer
15. Chemicaliën & Co
Jeans wordt gemaakt van katoen. Katoen
moet vele malen worden bespoten met
insecticiden om te kunnen 'overleven'.
Hoeveel % van het wereldwijde
insecticidengebruik is voor rekening van de
katoenteelt?
A. 3%
B. 12%
C. 25%
16. Chemicaliën & Co
Jeans wordt gemaakt van katoen. Katoen
moet vele malen worden bespoten met
insecticiden om te kunnen 'overleven'.
Hoeveel % van het wereldwijde
insecticidengebruik is voor rekening van de
katoenteelt?
A. 3%
B. 12%
C. 25%
23. arbeids-omstandigheden
Welke arbeidsrechten worden in dit filmfragment
geschonden? Je vindt deze tevens terug in de conventies van
de Internationale Arbeidsorganisatie (IAO) (een instelling van
de Verenigde Naties)
• Geen kinderarbeid
• Uitbetaling van een leefbaar minimumloon
• Geen buitensporige werkuren
• Uitbetaling van overuren
• Vaste arbeidscontracten
• Veilige en gezonde arbeidsomstandigheden
• Geen discriminatie op basis van geslacht, afkomst,
godsdienst, seksuele voorkeur,...
• Recht op organisatie in een vrije vakbond
• Recht op collectieve onderhandelingen over
werkvoorwaarden
• Geen dwangarbeid of verplichte arbeid
25. Alternatieven
Welke vezel is dé duurzame vezel bij
uitstek? Deze vezel heeft van nature geen
pesticiden nodig, slechts weinig water,
groeit snel, en heeft een hoge opbrengst
per hectare.
26. Alternatieven
Welke vezel is dé duurzame vezel bij
uitstek? Deze vezel heeft van nature geen
pesticiden nodig, slechts weinig water,
groeit snel, en heeft een hoge opbrengst
per hectare.
Hennep
34. een schone broek
Wat kan je het beste doen om de mensen en het
milieu in het Zuiden te respecteren?
A. Een tweedehandsbroek kopen.
B. Een broek kopen van Fairtrade en biologisch katoen,
gemaakt in goede arbeidsomstandigheden.
C. Zelf een broek maken.
35. een schone broek
Wat kan je het beste doen om de mensen en het
milieu in het Zuiden te respecteren?
A. Een tweedehandsbroek kopen.
B. Een broek kopen van Fairtrade en biologisch katoen,
gemaakt in goede arbeidsomstandigheden.
C. Zelf een broek maken.
36. Let your blue jeans talk... green
Kleine wasjes
/
Grote wasjes
37. Kleine wasjes / grote wasjes
Hoeveel liter water gebruikt een
wasmachine gemiddeld bij 1 wasbeurt?
(enkel hoofdwas)
A. 20 liter
B. 35 liter
C. 50 liter
38. Kleine wasjes / grote wasjes
Hoeveel liter water gebruikt een
wasmachine gemiddeld bij 1 wasbeurt?
A. 20 liter
B. 35 liter
C. 50 liter
40. gebruik
Wat kan je doen om de levensduur van je
jeans te verlengen? Geef minstens 3 tips.
41. gebruik
Wat kan je doen om de levensduur van
je jeans te verlengen? Geef minstens 3
tips.
• Langer dragen
• Minder vaak wassen
• Drogen op een droogrek
• Een tweede leven geven
• Herstellen van de broek
• ...
44. Stellingenronde (1)
Het is goed om een jeans te kopen, gemaakt
in een fabriek zoals getoond in de
documentaire. Anders hebben deze meisjes
geen werk en dus ook geen inkomen.
45. Ecologische voetafdruk
Welk gedrag (gebruik) heeft de zwaarste
ecologische impact?
• Een niet ecologische jeans die men
telkens een week draagt alvorens ze te
wassen op 30°C en op een rekje wordt
gedroogd
• Een ecologische jeans die telkens 4 dagen
wordt gedragen, dan wordt gewassen op
60°C, gedroogd in de droogkast en
nadien gestreken
46. Ecologische voetafdruk
Op de site www.greenjeans.be kun je de
ecologische voetafdruk van je jeans
berekenen en deze vergelijken met die van
An en Jan Modaal.
We doen de test!
47. DuurZame alternatieven
Ethische merken: Monkee Genes, Braintree Hemp,
Ideo, Kuyichi, Art 23, Hemp Age,...
Ook merken met één lijn biojeans: C&A, JBC, Nudie,
Jackpot, Carhartt, G-star, Jack&Jones, Levi's,...
of lid FWF: Mexx, Gsus en Filippa K
Maar dé duurzame jeans nog niet gevonden:
gemaakt in respect voor mens én milieu,
onafhankelijk gecontroleerd en aangeboden met
duidelijke informatie op de broek en in de winkel
48. DuurZame alternatieven
Op de site
www.greenjeans.be
Lijst met verkooppunten
en duurzame gebruikstips
dus
'Let your blue jeans talk... green'
49. DuurZame alternatieven
samenstelling: hennep, bamboevezel en/of bio-
katoen
- geen pesticiden en kunstmest; hennep en
bamboeplant hebben veel minder water nodig
en groeien zeer snel
- meestal verwerkt op milieuvriendelijke
manier (behalve bamboe-viscose! Let
daarop!)
50. DuurZame alternatieven
Labels: onafhankelijk gecontroleerd - transparant
* biojeans, milieuvriendelijk geproduceerd in
goede arbeidsomstandigheden
* milieuvriendelijk geproduceerde jeans
* fairtrade jeans geproduceerd in goede omstandigheden
* Lidmaatschap FWF: bedrijf engageert zich om
voldoende inspanningen te leveren om IAO richtlijnen
te respecteren
51. Vragenronde
Zijn er nog vragen?
Meer info vind je in de folders en op de
website www.greenjeans.be en via
info@greenjeans.be
Bedankt voor jullie aandacht!