2. noted that traditional pure economic scheduling no longer meets
the requirements of optimal operation of MGs after passage of the
Clean Air Act Amendments in 1990 and it is required to consider the
issues relating to greenhouse gas emission (Norouzi et al., 2014a;
Ahmadi et al., 2012; Le et al., 1995).
Significant researches have been conducted on operation of
MGs, while they have used Meta heuristic optimization methods to
solve multi-objective environmental/economic operation of MGs.
Due to the population-based search capability, simplicity, and
convergence speed, Meta heuristic optimization methods are
widely used for solving multi-objective optimization problems like
environmental/economic operation of MGs (Moghaddam et al.
(2011). Basak et al. (2012) have scrutinized a techno-economic
factor for Distributed Energy Resources (DERs) on the basis of the
impact of their generation on the network losses, while making an
attempt to decrease the operation cost and emission generation.
Moghaddam et al. (2012) have used a Fuzzy Self-Adaptive Particle
Swarm Optimization (FSAPSO) algorithm for economic/emission
dispatch of the generating units in a typical MG. The optimal
operation scheduling of a typical MG with RESs along with a back-
up MT/FC/battery hybrid power source has been done using an
Adaptive Modified Particle Swarm Optimization (AMPSO) algo-
rithm by Moghaddam et al. (2011), taking into account the cost and
emission as two objective functions. Aghaei and Alizadeh (2013)
have presented an optimal operation of a MG which is based on
Combined Heat and Power (CHP), while the two objectives
considered are cost and emission. This MG includes the energy
storage system, three types of thermal power generating units and
demand response programs. A multi-objective, intelligent energy
management framework has been presented by Chaouachi et al.
(2013) to minimize the operation cost and the emission of a MG
considering its pre-operational variables as future availability of
renewable energies and load demand. Zhao et al. (2014a,b) have
used an approach based on Genetic Algorithm (GA) to deal with the
sizing optimization problem for MGs operating in stand-alone
mode with multiple objectives consisting of life-cycle cost
minimization, maximization of RESs penetration and minimization
of emission. A linear programming technique has been used by
Quiggin et al. (2012) to model a MG system comprising RESs, en-
ergy storage and demand response programs while it is found that
MGs with contemporary technologies are able to remarkably
reduce the CO2 emissions. An energy management model has been
presented by Chen et al. (2013) to determine the optimal operating
strategies associated with the maximum profit for a MG system in
Taiwan. It is found that using an efficient power generation MG
system would decrease the greenhouse gas emissions. The problem
of economic/environmental dispatch of DG-based MGs has been
solved using a chaotic quantum GA by Liao (2012). The problem of
optimal size, design and operation of a hybrid, renewable energy
based MG has been determined by Hafez and Bhattacharya (2012.),
in order to minimize the life cycle cost taking into consideration the
environmental concerns. The performance of a MG has been
assessed by Zhang et al. (2014), using a performance metric with
respect to the electricity price, emission and service quality, while a
weighting factor is assigned to each one. With the weighting factors
set by Zhang et al. (2014), performance metric was further applied
to MGs operating in stand-alone, grid-tied and networked modes.
Alagoz et al. (2012) have investigated the tree-like user-mode
network architecture, which provides flexible, observable, and
controllable network architecture for reliable and efficient energy
delivery under uncertain conditions. A comprehensive model has
been presented by Hemmati et al. (2014) for MG operating in stand-
alone mode, while a multi-cross learning-based chaotic differential
evolution algorithm has been used to solve the economic/envi-
ronmental optimization problem. The optimal operation of WTs
and other DERs operating in an interconnected MG has been pre-
sented by Motevasel and Seifi (2014) through an expert energy
management system. The main aim beyond using the presented
approach is to determine the optimal set points of DERs and storage
devices in order to concurrently minimize the total operation cost
and the net greenhouse gas emission. Motevasel et al. (2013) have
utilized an intelligent energy management system for optimal
Nomenclature
Indices
b battery
f fuel cell
g grid
m micro turbine
p photo voltaic
t time
w wind turbine
Units
BA battery
FC fuel cell
MT micro turbine
PV photo voltaic
WT wind turbine
Constants
ai,bi,and ci cost coefficients of thermal generating unit i for case
1
di, ei, and fi greenhouse gas emission coefficients of thermal
generating unit i for case 1
Bab loss coefficients for case 1
B(*,t) bid at hour t
Ei(*,t) emission coefficient of ith emission type (CO2, SO2 and
NOx) of unit at hour t
PMax(*,t) maximum power output at hour t
PMin(*,t) minimum power output at hour t
PFMax(*,t)maximum forecasted power output at hour t
PFMin(*,t) minimum forecasted power output at hour t
Load(t) load at hour t
SUC* start-up cost
SDC* shut-down cost
Variables
F1 the main objective function (Cost minimization)
F2 the secondary objective function (Emission
minimization)
Fr
i the value of the ith objective function in the rth Pareto
optimal solution
P(*,t) power generation at hour t
V(*,t) binary variable which is equal to one if unit is online at
hour t
mr
i the value of the ith membership function in the rth
Pareto optimal solution
mr
the total membership function of the rth Pareto
optimal solution
A. Rezvani et al. / Journal of Cleaner Production 87 (2015) 216e226 217
3. operation of a MG that was based on CHP generation over a 24-hour
horizon to simultaneously minimize the total operation cost and
the net greenhouse gas emission. A stochastic environmental/
economic multi-objective framework has been proposed by
Niknam et al. (2012) using teaching-learning based optimization to
obtain the Pareto optimal solutions. Mohamed and Koivo (2011)
have proposed a generalized formulation for a MG to determine
the optimal operating strategy and cost minimization scheme,
while minimizing the greenhouse gas emissions using a modified
game theory. It should be noted that the aforementioned papers
have used the weighted sum method to convert multi-objective
problems into single objective problem. Weighted sum method is
the method commonly used for economic/environmental man-
agement problems compared with other previously established
optimization approaches (Moghaddam et al., 2012, 2011). However,
a well-organized method to deal with multi-objective problems is
epsilon-constraint technique having a main objective function
selected among all objective functions. This technique has several
significant merits over the conventional weighted sum method that
merges the objective functions of the multi-objective problem into
one objective function using weighted sum. The main advantages
of the epsilon-constraint technique can be summarized as follows
(Norouzi et al., 2014a; Mavrotas, 2009):
i. Using the weighted sum method, only efficient extreme so-
lutions can be generated, while the epsilon-constraint tech-
nique has the capability to generate non-extreme efficient
solutions.
ii. In the case of multi-objective problems, unlike the weighted
sum method, the epsilon-constraint technique is able to
generate unsupported efficient solutions.
iii. The weighted sum method requires the scaling of the
objective functions, while it is not needed in the epsilon-
constraint method.
Therefore, the epsilon-constraint method seems to be a good
choice to solve multi-objective optimization problems.
The problem of short-term economic/environmental scheduling
of a MG has been solved in this paper. The previously cited papers
used Meta heuristic methods to solve this problem. It is worth to
mention that the present paper employs a Multi-objective Math-
ematical programming (MMP) approach for this end. Moreover, to
the best of authors' knowledge, there is no published paper pro-
posing such framework using lexicographic optimization and
hybrid augmented-weighted epsilon-constraint technique. It is
noted that the results obtained are superior by others showing the
effectiveness of the proposed method.
The main contributions of this paper can be listed as below:
1. Proposing a multi-objective framework for short-term sched-
uling of a MG taking into consideration cost and emission as two
objective functions.
2. Incorporating the lexicographic optimization and hybrid
augmented-weighted epsilon-constraint technique to simulta-
neously minimize cost and emission and generate Pareto
optimal solutions and to determine the best compromise solu-
tion employing a fuzzy satisfying method.
3. Exceptional solutions obtained from the presented method
compared to recently published papers in the case of cost,
emission and solution time.
The remainder of this paper is organized as below:
The problem formulation is proposed in Section 2 and Section 3
includes the description on lexicographic optimization and hybrid
augmented epsilon-constraint method. Section 4 presents the
simulation results with detailed discussion. Finally, Section 5 gives
some relevant conclusions.
2. Mixed integer nonlinear programming (MINLP)
formulation for MG
The two objective functions of the presented multi-objective
framework for MG can be stated as follows:
Multi À objective functions ¼
&
F1 Cost Minimization
F2 Emission Minimization
(1)
where, F1 and F2 denote the objective functions presented in details
in the following.
2.1. Cost minimization
The main objective function of the problem, i.e. cost minimi-
zation can be represented as below:
It is worth-mentioning that F1 indicates the operation cost of
MG in Vct and it is comprised of the fuel costs of DGs, start-up and
shut-down costs and costs due to power exchange between the MG
F1 ¼
X
t2T
8
>>>>>>>>>>>>>>>>>>>>>>><
>>>>>>>>>>>>>>>>>>>>>>>:
P
m2MT
Pðm; tÞ*Bðm; tÞ þ SUCm*Vðm; tÞ*
"
1 À V
À
m; t À 1
Á
#
þ SDCm*V
À
m; t À 1
Á
*
"
1 À V
À
m; t
Á
#
þ
P
f 2FC
P
f ; t
*B
f ; t
þ SUCf *V
f ; t
*
2
41 À V
À
f ; t À 1
Á
3
5 þ SDCf *V
À
f ; t À 1
Á
*
2
41 À V
À
f ; t
Á
3
5þ
P
p2PV
P
À
p; t
Á
*B
À
p; t
Á
þ SUCp*V
À
p; t
Á
*
2
41 À V
À
p; t À 1
Á
3
5 þ SDCp*V
À
p; t À 1
Á
*
2
41 À V
À
p; t
Á
3
5þ
P
w2WT
Pðw; tÞ*Bðw; tÞ þ SUCw*Vðw; tÞ*
1 À V
À
w; t À 1
Á
#
þ SDCw*V
À
w; t À 1
Á
*
1 À V
À
w; t
Á
#
þ
P
b2BA
Pðb; tÞ*Bðb; tÞ þ SUCb*Vðb; tÞ*
1 À V
À
b; t À 1
Á
#
þ SDCb*V
À
b; t À 1
Á
*
1 À V
À
b; t
Á
#
þ
Pðg; tÞ*Bðg; tÞ
9
=
;
(2)
A. Rezvani et al. / Journal of Cleaner Production 87 (2015) 216e226218
4. and the utility grid (macro-grid, Low Voltage (LV) network). For
instance, the first row includes the operation cost of MT, while
P(m,t) denotes the power output of the mth MT at hour t, B(m,t)
stands for the bid of the mth MT at hour t, SUCm and SDCm indicate
the start-up and shut-down costs of the mth MT, respectively.
V(m,t) is a binary variable which is equal to 1 if the mth MT is online
at hour t. The operation cost of FC, PV, WT and battery units are
represented by the second, third, fourth and the fifth rows,
respectively. Furthermore, P(g,t) in the last row denotes the active
power which is bought/sold from/to the utility grid at hour t and
B(g,t) is the bid of utility grid at hour t (Moghaddam et al., 2012,
2011).
2.2. Emission minimization
The second objective function of the proposed multi-objective
framework is emission minimization stated as below:
F2 ¼
X
t2T
X
i2ET
8
:
X
m2MT
Pðm; tÞ*Eiðm; tÞ þ
X
f 2FC
Pðf ; tÞ*Eiðf ; tÞ
þ
X
b2BA
Pðb; tÞ*Eiðb; tÞ þ Pðg; tÞ*Eiðg; tÞ
9
=
;
(3)
Where ET is comprised of the three important pollutants: Carbon
Dioxide (CO2), Sulfur Dioxide (SO2) and Nitrogen Oxides (NOx).
Note that the total emission, F2, is stated in kg/MWh and consists of
the emission generation by MT, FC, and battery units, respectively.
Finally, the last term of Eq. (3) indicates the emission generation
due to power generation by the utility grid (Moghaddam et al.,
2012, 2011). Ei(m,t) denotes the emission coefficient of the ith
emission type (CO2, SO2 and NOx) of the mth MT at hour t.
2.3. Power balance
One of the most significant constraints in MG scheduling
problem is power balance constraint ensuring that the power
generation by DG units meets the total demand in the grid.
X
m2MT
Pðm; tÞ þ
X
f 2FC
P
À
f ; t
Á
þ
X
p2PV
Pðp; tÞ þ
X
w2WT
Pðw; tÞ
þ
X
b2BA
Pðb; tÞ þ Pðg; tÞ ¼ LoadðtÞ
(4)
As a small 3-feeder LV radial system has been used in this paper,
the transmission losses that are numerically low have not been
considered (Moghaddam et al., 2012, 2011).
2.4. Power generation capacity
The power output of each unit must be within its permitted
range for each period of scheduling provided that the unit is on.
These constraints are indicated in eq. (5).
8
:
PMinðm; tÞ*Vðm; tÞ Pðm; tÞ PMaxðm; tÞ*Vðm; tÞ
PMinðf ; tÞ*Vðf ; tÞ Pðf ; tÞ PMaxðf ; tÞ*Vðf ; tÞ
PFMinðp; tÞ*Vðp; tÞ Pðp; tÞ PFMaxðp; tÞ*Vðp; tÞ
PFMinðw; tÞ*Vðw; tÞ Pðw; tÞ PFMaxðw; tÞ*Vðw; tÞ
PMinðb; tÞ*Vðb; tÞ Pðb; tÞ PMaxðb; tÞ*Vðb; tÞ
PMinðg; tÞ Pðg; tÞ PMaxðg; tÞ
(5)
3. Multi-objective mathematical programming (MMP)
Unlike the single optimization, multi-objective optimization
problems deal with more than one objective function that are
competing and conflicting. However, solving such problems result
in a set of non-dominated solutions instead of a single optimal
solution (Ahmadi et al., 2012). Generally, the following form rep-
resents a multi-objective optimization problem:
min F
x
¼ ðF1ðxÞ; …; FmðxÞÞT
s:t : x2Xj
(6)
where m denotes the total number of objective functions, x in-
dicates a n-dimensional vector of decision variables and the deci-
sion space is indicated by X.
3.1. Lexicographic optimization and augmented weighted
ε-constraint technique
A well-established method to solve MMP problems is epsilon-
constraint technique that takes into account one of the objective
function as the main objective function. In general, this main
objective function F1 is optimized by the epsilon-constraint method
and the remaining objective functions are applied as constraints
(Norouzi et al., 2014a; Mavalizadeh and Ahmadi, 2014; Mavrotas,
2009):
MinF1ðxÞ
subject to F2ðxÞ e2 F3ðxÞ e3 … FmðxÞ em
(7)
where, m indicates the number of competing objective functions of
the MMP problem.
However, there are two problems that should be taken into
consideration when using epsilon-constraint technique (Ahmadi
et al., 2014; Aghaei and Alizadeh, 2013):
a) The first problem relates to the range of objective functions over
the efficient sets that are not optimized. Thus, lexicographic
optimization is used in this paper to eliminate this shortfall.
b) The second issue is the possibility of generating dominated or
inefficient solutions using this method. Hence, augmented
epsilon-constraint technique is employed in this paper to
overcome this deficiency.
Ahmadi et al., 2014 (2009) presents further information on the
detailed functionality of both lexicographic optimization and
augmented-weighted epsilon-constraint technique.
3.2. Fuzzy decision maker
After the Pareto optimal solutions are obtained, the decision
making process is done using a fuzzy DM (Norouzi et al., 2014a;
Ahmadi et al., 2014) to choose the best desired solution according
to its application. In this method, a linear membership function is
defined for each of the objective functions of the multi-objective
optimization problem. For the objective functions intended to be
minimized, the following membership function is proposed:
mr
i ¼
8
:
1 Fr
i Fmin
i
Fmax
i À Fr
i
Fmax
i À Fmin
i
Fmin
i Fr
i Fmax
i
0 Fr
i ! Fmax
i
(8)
A. Rezvani et al. / Journal of Cleaner Production 87 (2015) 216e226 219
5. Subsequently, for the objective functions that are maximized,
the following linear membership function is used:
mr
i ¼
8
:
0 Fr
i Fmin
i
Fr
i À Fmin
i
Fmax
i À f min
i
Fmin
i Fr
i Fmax
i
1 Fr
i ! Fmax
i
(9)
where Fmin
i and Fmax
i determine the range of the objective function
Fi and obtained from the payoff table. Fr
i and mr
i denote the value of
the ith objective function in the rth Pareto optimal solution and its
corresponding membership value, respectively. The membership
value specifies the nicety of the solution obtained for the ith
objective function in the rth Pareto optimal solution. Moreover, the
individual membership functions in the rth Pareto optimal solution
are used to calculate the total membership function as follows:
mr
¼
Pm
i¼1 wimr
i
Pm
i¼1 wi
(10)
where the weighting factor of each objective function is indicated
by wi and m is the total number of objective functions. These
weighting factors are determined by DM based on the economic
and environmental considerations. However, the highest value of
the total membership specifies the best preferred solution
(Charwand et al., 2014).
4. Case study and simulation results
Two different cases are used in this paper to implement the pro-
posed method in order to show the efficiency and the effectiveness of
the lexicographic optimization and augmented-weighted epsilon-
constraint method. The system employed to solve the presented
problem is a laptop computer with 2.4 GHz Pentium IV CPU and 3 GB
RAM while SBB solver under GAMS (Brooke et al., 2012), has been
used. The next section presents the results obtained through solving
the proposed problem with two case studies.
4.1. Case 1
This case is the same as the one by Motevasel and Seifi (2014),
Jiejin et al. (2009), Moghaddam et al. (2011), Palanichamy and
Srikrishna (1991), and Palanichamy and Babu (2008). Note that
this system comprises three plants and six thermal generating units
and NOX has been taken into account as the only pollutant and CO2
and SO2 are neglected. The aim is to determine the best dispatch
with the lowest cost and emission (Moghaddam et al., 2011;
Palanichamy and Srikrishna, 1991; Palanichamy and Babu, 2008).
F1 ¼
X
i2G
aip2
i þ bipi þ ci
(11)
F2 ¼
X
i2G
dip2
i þ eipi þ fi
(12)
In this case study, F1 is cost function while F2 is emission func-
tion and both of these objective functions are quadratic functions of
power generated by thermal generation units, while the G stands
for thermal generation unit.
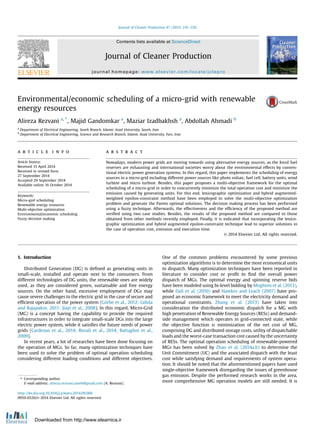
Fig. 1 depicts a typical test system including six generating units
as the first case study (Moghaddam et al., 2011; Palanichamy and
Srikrishna, 1991; Palanichamy and Babu, 2008); this figure shows
a typical 4-bus test system. Besides, the transmission loss has been
considered in this case study. Where the power loss is denoted by
PLoss which is a function of the generating unit's output power and
B-loss coefficients and it can be stated in detail as:
PLoss ¼
XNTP
a¼1
XNTP
b¼1
PaBabPb (13)
where Pa and Pb are power generation of thermal power plants and
equal to the total power generation of each unit of that thermal
power plant. NTP is the number of thermal power plants while this
case study has 3 thermal power plants. It is worth mentioning that,
since this case study considers power losses, the total power gen-
eration must be equal to power demand plus power losses.
Table 1 represents the data on fuel cost coefficients, emission
coefficients, power generation limits while the B loss coefficients
has been illustrated in Table 2. The total real power demand of this
test system is 900 MW. Both cost and emission are intended to be
simultaneously minimized in this example utilizing lexicographic
optimization and augmented-weighted epsilon-constraint method.
The lexicographic optimization and augmented-weighted
epsilon-constraint method have been used to find the Pareto
Fig. 1. A Typical 4-bus test system for case 1.
Table 1
Thermal unit's data for case 1.
Plant Unit Fuel cost coefficients Greenhouse gas emission coefficients PMin MW PMax MW
ai $/hMW2
bi $/hMW ci $/h di kg/hMW2
ei kg/hMW fi kg/h
1 G1 0.152740 38.5397 756.799 0.00419000 0.327670 13.8593 10.0000 125.000
G2 0.105780 46.1592 451.325 0.00419000 0.327670 13.8593 10.0000 150.000
G3 0.028030 40.3965 1049.32 0.00683000 À0.545510 40.2669 40.0000 250.000
2 G4 0.035460 38.3055 1243.53 0.00683000 À0.545510 40.2669 35.0000 210.000
G5 0.021110 36.3278 1658.57 0.00461000 À0.511160 42.8955 130.000 325.000
3 G6 0.017990 38.2704 1356.66 0.00461000 À0.511160 42.8955 125.000 315.000
A. Rezvani et al. / Journal of Cleaner Production 87 (2015) 216e226220
6. optimal solutions of the proposed multi-objective problem. The
main objective of epsilon-constraint technique in this case is cost
minimization, i.e. F1 while the number of grid points is 19 (q2 ¼ 19)
for F2 (emission minimization) to derive the Pareto optimal solu-
tions. Hence, the problem must be solved for 20 times while all
solutions are feasible (Norouzi et al., 2014b). The obtained payoff
table (F1) is illustrated as follows:
F1 ¼
47329:0
50265:3
863:272
701:456
It can be observed from this payoff table that in the case of
considering only the cost function, the cost reduces to 47329.0 $
while the emission in this case is 863.272 kg. On the other hand, if
emission is the only objective function considered, the emission
decreases to 701.456 kg while the cost increases to 50265.3 $ in
such conditions.
Fig. 2 indicates the Pareto optimal front obtained by the pre-
sented approach. The competing nature of both objectives can be
well observed from this figure. It is worth mentioning that each
Pareto solution consists of 14 variables and 9 equations. The total
solution time to find 20 Pareto solutions is 3.488 s; thus, the
average CPU time for one Pareto solution is 0.1744 s.
Fuzzy DM has been employed to select the best desired solution.
Fig. 3 illustrates the values of cost, emission and total membership
while the same weighting factors are assigned to each objective
function. As it can be observed, Pareto solution 7 is the best Pareto
solution due to its highest total membership value (0.886).
The Pareto solution 7 has been presented in Table 4 in details.
Besides, the results obtained from other methods have been rep-
resented in this table.
The results illustrated in Table 3 verify the superiority of the
proposed method over other proposed methods in the case of
quantity. For example, the presented technique results in the cost
equal to 47402.1 $, a value less than the ones reported by other
proposed methods. Moreover, the emission obtained from this
method is less than the ones reported by other methods. The results
attained for this case study are an evidence of the effectiveness of
the proposed approach.
4.2. Case 2
The second test system includes MT, FC, PV, WT and battery. The
aim is to find the best UC with the lowest cost and emission. The
scheduling horizon taken into consideration is a 24-hour period on
the hourly basis. In this case study, all three types of pollutants, i.e.
CO2, SO2 and NOx are considered (Moghaddam et al., 2012, 2011). A
typical LV MG model is depicted in Fig.4 for case 2 (Moghaddam
et al., 2012, 2011). In Fig. 4, MV, LV, AC, DC, PV, and MC, are ab-
breviations for medium voltage, low voltage, alternating current,
direct current, photo voltaic and micro controller, respectively.
It is noted that all DG sources operate at unity power factor
without absorbing or generating reactive power. Furthermore, the
MG is connected to the utility grid via a power exchange link
considered for power transaction during different hours of a day
according to the decision made by the MG Central controller
(MGCC). In a typical MG, DERs generally have different owners
handling the autonomous operation of the grid with the help of
local controllers which are joined with each DER and MGCC.
Moreover, MGCC implements the optimization process to achieve a
robust and optimal plan of action for the smart operation of the MG.
Table 2
B loss coefficients for case 1.
Bij ¼
2
4
0:000091 0:000031 0:000029
0:000031 0:000062 0:000028
0:000029 0:000028 0:000072
3
5
Table 3
Results obtained from different methods for case 1.
Optimization method Moghaddam et al.
(2011)
Palanichamy and
Srikrishna (1991)
Palanichamy and
Babu (2008)
Motevasel and
Seifi (2014)
Jiejin et al.
(2009)
Proposed
P1 MW 51.8200 51.8300 51.8200 51.8200 51.8200 44.5327
P2 MW 32.6500 38.6600 38.6400 32.6500 32.660 30.1535
P3 MW 208.770 248.740 248.730 208.780 209.790 157.021
P4 MW 128.120 122.150 122.140 128.120 128.120 155.788
P5 MW 292.030 252.030 252.020 292.020 291.950 274.558
P6 MW 223.570 223.580 223.570 223.570 223.570 276.369
Total cost $/h 47549.0 47809.0 47804.5 47549.0 47549.9 47402.1
Net emission kg/h 823.350 843.530 843.420 823.350 823.360 812.170
Total loss MW 36.9600 36.9900 36.9200 36.9600 37.9100 38.4250
CPU time s 12.5400 0.814000 0.195000 14.3600 12.0300 0.174000
Fig. 2. Pareto optimal solutions the emission versus cost for case 1.
Fig. 3. Variation of total membership, cost and emission functions versus Pareto-
optimal solutions for case 1.
A. Rezvani et al. / Journal of Cleaner Production 87 (2015) 216e226 221
7. The raw input data to this unit includes the amount of load inside
the grid and the powers generated by the nonscheduled DGs
typically based on RESs and the output information involves the
optimal set points for DGs in terms of suitable ON/OFF states and
the required active and reactive powers for supplying the load
(Moghaddam et al., 2011).
In Table 4, PMin and PMax represent the upper and the lower
bounds of DGs' power output, respectively, while Bid states the bid
coefficients in cents of Euro per kilo-Watt hour Vct/kWh. Also, CO2,
SO2, and NOx represent the emissions coefficients in kilogram per
MWh for DGs. In addition, SUC and SDC represent the start-up cost
and shut-down cost of each generation units. As Table 4 shows, the
PV and WT and utility are supposed to be emission free in this case
study. The capacity of the battery is 1 MWh. By using the charge
and discharge efficiency of the battery, we can consider the cycle
efficiency; in this paper the charge and discharge efficiency of the
battery are equal to one. In this paper, we did not consider DG
placement, therefore we did not determine the nominal capacity of
the units. We have applied lexicographic optimization and hybrid
augmented epsilon-constraint technique for two case studies with
known data like nominal capacity of the units, while in the third
case study we have made some assumptions explained in the third
case study. There are different bidding strategy methods to evaluate
the bid prices (Vahidinasab and Jadid, 2010), but it is beyond the
scope of this paper. So, we have used the existing data like bid
prices for our case studies. Controlling the active power generation
of the wind turbine and the PV unit can be done by micro con-
trollers and electronic power devices.
The maximum power outputs derived from WT and PV are
estimated for a day ahead employing an expert prediction model
and neural networks that are beyond the scope of this paper and
will be presented in future works. One of the powerful tools to
implement time-varying inputeoutput mapping is artificial neural
network (ANN). This approach does not require a mathematical
model of the system, so the modeling error cannot affect the per-
formances. Thus, ANN can be used for forecasting the power gen-
eration of WT and PV (Motevasel and Seifi, 2014).
Table 5 includes such predicted values corresponding to WT's
and PV's power outputs. Moreover, the daily load data in a typical
MG and the real-time market energy prices for the considered
horizon are represented in Table 5 (Moghaddam et al., 2012, 2011).
Table 5 shows the electrical energy price. Multiplying this price by
the amount of power exchange between the micro-grid and the
utility grid results in the costs of power exchange between the
micro-grid and the utility grid. Calculating of market price is
beyond the scope of this paper. So, we have used the existing data
(Moghaddam et al., 2012, 2011) like electrical energy prices for our
case studies.
It is worth to mention that 20 Pareto optimal solutions are
generated using the presented method that all of them are feasible
(Norouzi et al., 2014b). The obtained payoff table (F2) for case 2 is
represented as follows:
F2 ¼
177:550
1269:49
552:672
108:105
It can be observed from this payoff table (F2) that in the case of
considering only the cost function, the cost reduces to 177.550 Vct
while the emission in this case is 552.672 kg. On the other hand, if
emission is the only objective function considered, the emission
decreases to 108.105 kg while the cost increases to 1269.49 Vct in
such conditions. Therefore, if we compare the emission obtained
Fig. 4. A typical LV MG model for case 2.
Table 5
Forecasted output of WT, PV, load and market price.
Hour Forecasting output kW Load kW Electrical energy
price Vct/kWh
PV WT
1 0.000 1.785 52.00 0.2300
2 0.000 1.785 50.00 0.1900
3 0.000 1.785 50.00 0.1400
4 0.000 1.785 51.00 0.1200
5 0.000 1.785 56.00 0.1200
6 0.000 0.9140 63.00 0.2000
7 0.000 1.785 70.00 0.2300
8 0.1940 1.308 75.00 0.3800
9 3.754 1.785 76.00 2.500
10 7.528 3.085 80.00 4.000
11 10.44 8.772 78.00 4.000
12 11.96 10.413 74.00 4.000
13 23.89 3.923 72.00 1.500
14 21.05 2.377 72.00 4.000
15 7.865 1.785 76.00 2.000
16 4.221 1.302 80.00 1.950
17 0.5390 1.785 85.00 0.6000
18 0.000 1.785 88.00 0.4100
19 0.000 1.302 90.00 0.3500
20 0.000 1.785 87.00 0.4300
21 0.000 1.302 78.00 1.170
22 0.000 1.302 71.00 0.5400
23 0.000 0.9140 65.00 0.3000
24 0.000 0.6120 56.00 0.2600
Table 4
DG unit's data for case 2.
Type PMin kW PMax kW Bid Vct/kWh SUC/SDC Vct CO2 kg/MWh SO2 kg/MWh NOx kg/MWh
MT 6.000 30.00 0.4570 0.9600 720.0 0.003600 0.1000
FC 3.000 30.00 0.2940 1.650 460.0 0.003000 0.007500
PV 0.000 25.00 2.5840 0.000 0.000 0.000 0.000
WT 0.000 15.00 1.0730 0.000 0.000 0.000 0.000
Bat À30.00 30.00 0.3800 0.000 10.00 0.0002000 0.001000
Utility À30.00 30.00 Table 5 0.000 0.000 0.000 0.000
A. Rezvani et al. / Journal of Cleaner Production 87 (2015) 216e226222
8. from the optimization of cost function that is 552.672 kg, with the
emission obtained from the optimization of emission function that
is 108.105 kg, we can say that emission reduces.
Fig. 5 illustrates the Pareto optimal front obtained using the
proposed technique. The conflicting behavior of these two objective
functions can be observed from this figure. Also, each Pareto so-
lution includes 268 variables and 364 equations. Total solution time
for 20 Pareto optimal solutions is 678.1 s; hence, the average CPU
time for one Pareto solution is 33.91 s, while all of the solutions are
feasible.
The best desired solution among all Pareto Solutions has been
selected using fuzzy DM (Norouzi et al., 2014a). The purpose
beyond defining membership functions for objective functions is to
determine the nicety of the solutions. For example, if the decision
maker tends towards cost minimization rather than minimizing
emission, the weighting factor of cost would be higher than the one
assigned to emission, e.g. 15.00 for cost and 1.000 for emission.
Fig. 6 shows that with such weighting factors, the highest value
obtained for the total membership is 0.9383 for 20 Pareto optimal
solutions while the best preferred solution is Pareto solution 2. The
membership value of cost for this Pareto solution is 0.9974 and the
emission membership is 0.0526 as indicated in Table 6.
Table 7 represents the best solution in details chosen using the
proposed method associated with the results reported by FSAPSO
(Moghaddam et al., 2012) to indicate the efficiency of the presented
method. It is impossible to compare the results with the ones ob-
tained by Moghaddam et al. (2011), since the best Pareto solution is
not tabulated by this reference.
Table 7 shows that the presented method results in better so-
lutions in comparison with the ones proposed by Moghaddam et al.
(2012) in the case of quantity, e.g. the cost obtained from the
proposed method is less than FSAPSO by 10.60 Vct, which is much
less than the value reported by Moghaddam et al. (2012). In addi-
tion, the emission generated using this method is 529.3 kg, which is
less than the one reported by Moghaddam et al. (2012), at the same
time. The solution time has not been reported by Moghaddam et al.
(2012).
It can be observed from Table 7 that the utility grid supplies the
major part of the system load through the Point of Common
Coupling (PCC) between hours 1 to 8, since the bids of corre-
sponding unit are lower compared to others during this period of
scheduling. Over hours 9 to 17, the power outputs of DG sources
increase according to priority in lower cost and emission corre-
spondingly as the system load rises. During this period of sched-
uling, the energy is exported to the utility grid instead of importing
it in order to get more revenue and lower net emission. During the
other hours of scheduling except hour 21, due to the decreasing
price of energy supplied through the utility grid, energy is imported
from the macro grid. It is also noted that using RESs, such as wind
and solar leads to reduction in pollution, as their emission co-
efficients are zero while it causes more operation cost because the
bids by such units are high, i.e. from the economic point of view,
employing such energy resources must be limited according to
economic considerations. However, the results reported in Table 7
would be another evidence of the efficiency of the presented
method.
It is worth mentioning that DM can easily find the best solution
by changing the weighting factor of each objective function. In the
previous example, the DM intended to find a Pareto optimal solu-
tion with a very low cost while for this reason the emission will be
very high. In this case, the DM selects a very high weighting factor
for cost and very low for emission, e.g. 15.00 for cost and 1.000 for
emission.
For another example, if the decision maker wants to find the
Pareto optimal solution with fair cost and emission, DM can assign
equal weights to both objective functions. The values of cost,
emission and total membership are expressed in Fig. 7, where the
same weighting factors are set by the DM. As it can be observed in
this case, Pareto optimal solution 14 will be selected as the best
compromise solution among all due to its highest total member-
ship value obtained as 0.7098. The membership value of cost for
this Pareto solution is 0.7354 and the emission membership is
0.6842 as indicated in Table 8.
For another instance, if the DM decides to find a Pareto optimal
solution with lower emission and higher cost, the DM can use
higher weighting factor for emission and lower weighting factor for
cost, e.g. 1.000 for cost and 2.000 for emission. Fig. 8 illustrates that
with such weighting factors, the highest value obtained for the total
membership is 0.7095 for 20 Pareto optimal solutions, while the
best preferred solution is Pareto solution 18. The membership value
of the cost for this Pareto solution is 0.3391 and the emission
membership is 0.8947 as indicated in Table 9.
Tables 6, 8 and 9 and Figs. 6e8 show that the DM can select the
best Pareto solution by choosing the weighting factor for each
objective function. If the DM wants to select a Pareto solution with a
lower cost and higher emission, the DM can use higher weighting
factor for cost and lower weighting factor for emission like Table 6
and Fig. 6. If the DM wants to select a Pareto solution with a fair cost
Fig. 6. Variation of total membership, cost and emission functions versus Pareto-
optimal solutions for test case 2 with weighting factors (15.00, 1.000).
Table 6
Optimum solution for test case 2 with weighting (15.00, 1.000).
Objective
function
Weighting
factor
Objective
function value
Membership
value
Cost $ 15.00 180.4 0.9974
Emission kg 1.000 529.3 0.0526
Fig. 5. Pareto optimal solutions the emission versus cost for case 2.
A. Rezvani et al. / Journal of Cleaner Production 87 (2015) 216e226 223
9. and emission, the DM can use equal weighting factors for cost and
emission like Table 8 and Fig. 7. On the other hand, if the DM wants
to select a Pareto solution with a lower emission and higher cost,
the DM can use a higher weighting factor for emission and a lower
weighting factor for cost like Table 9 and Fig. 8. Assigning these
weighting factors are arbitrary and DM can use this method to find
the desired Pareto solution.
Table 10 shows the results obtained from different methods for
case 2 with weighting factors (1.000, 1.000) and weighting factors
(1.000, 2.000).. Comparison of the MT generation for weighting
factors (1.000, 1.000) and weighting factors (1.000, 2.000) show
that in case with weighting factors (1.000, 2.000), MT generation is
equal to zero for the entire scheduling period, while MT generates
power in case with weighting factors (1.000, 1.000) in hours 10e12
and 14. In the case with weighting factors (1.000, 2.000), the
emission has bigger weighting factor, therefore the emission
reduction is more important than cost reduction and also Table 4
shows that the MT has the biggest CO2, SO2 and NOx coefficients.
Therefore, MT generates power in the case with weighting factors
(1.000, 1.000), but MT does not generate in the case with weighting
factors (1.000, 2.000). In addition, Table 4 shows that the PV does
not generate emission, but it has the most expensive bidding price.
For this reason, in Table 10 PV generates more power in the case
with weighting factors (1.000, 2.000) compared to the case with
weighting factors (1.000, 1.000).
Table 7
Results obtained from different methods for case 2.
Hour Moghaddam et al. (2012) Proposed method
MT kW FC kW PV kW WT kW Battery kW Utility kW MT kW FC kW PV kW WT kW Battery kW Utility kW
1 0.000 29.98 0.000 0.000 À7.983 30.00 0.000 22.00 0.000 0.000 0.000 30.00
2 0.000 28.85 0.000 0.000 À8.851 30.00 0.000 20.00 0.000 0.000 0.000 30.00
3 0.000 28.15 0.000 0.000 À8.154 30.00 0.000 20.00 0.000 0.000 0.000 30.00
4 0.000 29.63 0.000 0.000 À8.630 30.00 0.000 21.00 0.000 0.000 0.000 30.00
5 6.000 29.78 0.000 0.000 9.776 30.00 0.000 26.00 0.000 0.000 0.000 30.00
6 6.000 27.39 0.000 0.000 À0.395 30.00 0.000 30.00 0.000 0.000 3.000 30.00
7 6.000 19.43 0.000 0.000 14.57 30.00 0.000 30.00 0.000 0.000 10.00 30.00
8 6.000 30.00. 0.000 0.000 29.57 9.428 0.000 30.00 0.000 0.000 15.00 30.00
9 30.00 30.00 0.000 1.785 30.00 À15.79 30.00 30.00 0.000 1.786 30.00 À15.79
10 30.00 30.00 7.528 3.085 30.00 À20.61 30.00 30.00 7.528 3.085 30.00 À20.61
11 30.00 30.00 9.227 8.772 30.00 À30.00 30.00 30.00 9.228 8.772 30.00 À30.00
12 30.00 30.00 3.587 10.41 30.00 À30.00 30.00 30.00 0.000 10.41 30.00 À26.41
13 30.00 30.00 0.000 3.922 30.00 À21.92 30.00 30.00 0.000 3.923 30.00 À21.92
14 30.00 30.00 9.623 2.376 30.00 À30.00 30.00 30.00 0.000 2.377 30.00 À20.38
15 30.00 30.00 0.000 1.785 30.00 15.79 30.00 30.00 0.000 1.786 30.00 À15.79
16 30.00 30.00 0.000 1.302 30.00 À11.30 30.00 30.00 0.000 1.302 30.00 À11.30
17 30.00 30.00 0.000 0.000 30.00 À4.999 30.00 30.00 0.000 0.000 30.00 À5.000
18 0.000 30.00 0.000 0.000 30.00 28.00 0.000 30.00 0.000 0.000 30.00 28.00
19 6.000 30.00 0.000 0.000 30.00 24.00 0.000 30.00 0.000 0.000 30.00 30.00
20 6.001 30.00 0.000 0.000 30.00 21.00 0.000 30.00 0.000 0.000 30.00 27.00
21 30.00 30.00 0.000 1.297 30.00 À13.30 30.00 30.00 0.000 1.302 30.00 À13.302
22 30.00 30.00 0.000 0.000 30.00 À8.997 0.000 30.00 0.000 0.000 30.00 11.00
23 0.000 30.00 0.000 0.000 18.01 16.99 0.000 26.01 0.000 0.000 8.989 30.00
24 0.000 19.19 0.000 0.000 6.813 30.00 0.000 26.00 0.000 0.000 30.00
Total cost Vct 191.0 Total emission kg 721.1 Total cost Vct 180.4 Total emission kg 529.3
Fig. 7. Variation of total membership, cost and emission functions versus Pareto-
optimal solutions for test case 2 with weighting factors (1.000, 1.000).
Table 8
Optimum solution for test case 2 with weighting factor (1.000, 1.000).
Objective
function
Weighting
factor
Objective function
value
Membership
value
Cost $ 1.000 466.4 0.7354
Emission kg 1.000 248.5 0.6842
Fig. 8. Variation of total membership, cost and emission functions versus Pareto-
optimal solutions for test case 2 with weighting factors (1.000, 2.000).
Table 9
Optimum solution for test case 2 with weighting factor (1.000, 2.000).
Objective
function
Weighting
factor
Objective function
value
Membership
value
Cost $ 1.000 899.1 0.3390
Emission kg 2.000 154.9 0.8950
A. Rezvani et al. / Journal of Cleaner Production 87 (2015) 216e226224
10. 4.3. Case 3
This case is the same as case 2, but with three differences. First,
in the case 2 the utility's emission was set to zero. But case three
considers that the power plants, feeding into the grid are not
emission-free and supposes that the emission coefficient for the
power plants, feeding into the grid are equal to emission co-
efficients of MT in Table 4. Second, this case study supposes that a
daily net zero energy balance should be kept for the battery unit.
Final difference is that in this case supposed that limitation for
power exchange between MG and utility is 100.0 kW instead of
30.00 kW in Table 4. Table 11 shows the result of best Pareto so-
lution with high priority to cost function. Table 11 shows that in
hours 1e8,17e20 and 22e24 the utility grid supplies the major part
of the system load since the bids of corresponding unit are lower
compared to others during this period of scheduling. Also, Table 4
shows that the PV unit has the highest bids compared to others.
Since in this case study there is less limitation for exchange be-
tween MG and utility, the PV unit does not generate any power.
Fig. 9 shows the battery charges when the energy price is low and
then sells its energy in the hours with the high energy prices.
5. Conclusion
This paper proposed a MINLP model for optimal scheduling of a
MG over a 24-hour horizon. The optimal scheduling of a MG has
been modeled in the form of multi-objective framework. The pre-
sented multi-objective problem has been solved by an analytic
method using lexicographic optimization and hybrid augmented-
weighted epsilon-constraint technique. The proposed method re-
quires less solution time while results in better solutions in
Table 10
Results obtained from different methods for case 2 with weighting factor (1.000, 1.000) and weighting factor (1.000, 2.000).
Hour Weighting factor (1.000, 1.000) Weighting factor (1.000, 2.000)
MT kW FC kW PV kW WT kW Battery kW Utility kW MT kW FC kW PV kW WT kW Battery kW Utility kW
1 0.000 0.000 0.000 0.000 22.00 30.00 0.000 0.000 0.000 0.000 22.00 30.00
2 0.000 0.000 0.000 0.000 20.00 30.00 0.000 0.000 0.000 0.000 20.00 30.00
3 0.000 0.000 0.000 0.000 20.00 30.00 0.000 0.000 0.000 0.000 20.00 30.00
4 0.000 0.000 0.000 0.000 21.00 30.00 0.000 0.000 0.000 0.000 21.00 30.00
5 0.000 0.000 0.000 0.000 26.00 30.00 0.000 0.000 0.000 0.000 26.00 30.00
6 0.000 3.000 0.000 0.000 30.00 30.00 0.000 3.000 0.000 0.000 30.00 30.00
7 0.000 8.215 0.000 1.786 30.00 30.00 0.000 8.215 0.000 1.786 30.00 30.00
8 0.000 13.70 0.000 1.302 30.00 30.00 0.000 13.70 0.000 1.302 30.00 30.00
9 0.000 14.21 0.000 1.786 30.00 30.00 0.000 10.46 3.754 1.786 30.00 30.00
10 30.00 30.00 7.528 3.085 30.00 À20.61 0.000 30.00 7.528 3.085 30.00 9.387
11 28.79 30.00 10.44 8.772 30.00 À30.00 0.000 30.00 10.44 8.772 30.00 À1.214
12 21.62 30.00 11.96 10.41 30.00 À30.00 0.000 30.00 11.96 10.41 30.00 À8.377
13 0.000 8.077 0.000 3.923 30.00 30.00 0.000 8.077 0.000 3.923 30.00 30.00
14 24.66 30.00 14.96 2.377 30.00 À30.00 0.000 30.00 21.05 2.377 30.00 À11.43
15 0.000 30.00 0.000 1.786 30.00 14.21 0.000 10.84 3.372 1.786 30.00 30.00
16 0.000 30.00 0.000 1.302 30.00 18.70 0.000 14.48 4.221 1.302 30.00 30.00
17 0.000 23.21 0.000 1.786 30.00 30.00 0.000 22.68 0.539 1.786 30.00 30.00
18 0.000 26.21 0.000 1.786 30.00 30.00 0.000 26.21 0.000 1.786 30.00 30.00
19 0.000 28.70 0.000 1.302 30.00 30.00 0.000 28.70 0.000 1.302 30.00 30.00
20 0.000 25.21 0.000 1.786 30.00 30.00 0.000 25.21 0.000 1.786 30.00 30.00
21 0.000 16.70 0.000 1.302 30.00 30.00 0.000 16.70 0.000 1.302 30.00 30.00
22 0.000 9.698 0.000 1.302 30.00 30.00 0.000 9.698 0.000 1.302 30.00 30.00
23 0.000 4.086 0.000 0.914 30.00 30.00 0.000 4.086 0.000 0.914 30.00 30.00
24 0.000 0.000 0.000 0.000 26.00 30.00 0.000 0.000 0.000 0.000 26.00 30.00
Total cost Vct 466.4 Total emission kg 248.5 Total cost Vct 899.1 Total emission kg 154.9
Table 11
Detailed results for case 3.
Hour MT kW FC kW PV kW WT kW Battery kW Utility Kw
1 0.000 0.000 0.000 0.000 À30.00 82.00
2 0.000 0.000 0.000 0.000 À30.00 80.00
3 0.000 0.000 0.000 0.000 À30.00 80.00
4 0.000 0.000 0.000 0.000 À30.00 81.00
5 0.000 0.000 0.000 0.000 À30.00 86.00
6 0.000 0.000 0.000 0.000 À30.00 93.00
7 0.000 0.000 0.000 0.000 À30.00 100.0
8 6.000 30.00 0.000 0.000 0.000 39.00
9 30.00 30.00 0.000 1.786 30.00 À15.79
10 30.00 30.00 0.000 3.085 30.00 À13.08
11 30.00 30.00 0.000 8.772 30.00 À20.77
12 30.00 30.00 0.000 10.41 30.00 À26.41
13 30.00 30.00 0.000 3.923 30.00 À21.92
14 30.00 30.00 0.000 2.377 30.00 À20.38
15 30.00 30.00 0.000 1.786 30.00 À15.79
16 30.00 30.00 0.000 0.000 30.00 À10.00
17 30.00 30.00 0.000 0.000 0.000 25.00
18 6.000 0.000 0.000 0.000 0.000 82.00
19 0.000 30.00 0.000 0.000 À30.00 90.00
20 6.000 30.00 0.000 0.000 30.00 21.00
21 30.00 30.00 0.000 1.302 30.00 À13.30
22 30.00 30.00 0.000 0.000 0.000 11.00
23 0.000 0.000 0.000 0.000 À30.00 95.00
24 0.000 0.000 0.000 0.000 À30.00 86.00
Total cost Vct 150.7 Total emission kg 1087
0
0.5
1
1.5
2
2.5
3
3.5
4
4.5
-40
-30
-20
-10
0
10
20
30
40
1 2 3 4 5 6 7 8 9 101112131415161718192021222324
Electricityprice€ct/kWh
BatterygenerationkW
Time h
Battery generation Elecricity market price
Fig. 9. Battery generation and electricity market price.
A. Rezvani et al. / Journal of Cleaner Production 87 (2015) 216e226 225
11. comparison with other methods from both economic and envi-
ronmental viewpoints. The ongoing research work is to take into
consideration the uncertainty caused by WT, PV, load and the
market price in the optimal scheduling of a MG present a stochastic
model to consider renewable energy resources with hydrothermal
units and investigating their impacts on pollutant emissions and
deals with tariff structures and determines the market prices.
References
Aghaei, J., Alizadeh, M.I., 2013. Multi-objective self-scheduling of CHP (combined
heat and power)-based microgrids considering demand response programs and
ESSs (energy storage systems). Energy 55, 1044e1054.
Ahmadi, A., Ahmadi, M.R., Esmaeel Nezhad, A., 2014. A lexicographic optimization
and augmented ε-constraint technique for short-term environmental/economic
combined heat and power scheduling. Electr. Power Components Syst. 42 (9),
945e958.
Ahmadi, A., Aghaei, J., Shayanfar, H.A., Rabiee, A., 2012. Mixed integer programming
of multi-objective hydro-thermal self-scheduling. Appl. Soft Comp. 12 (8),
2137e2146.
Alagoz, B.B., Kaygusuz, A., Karabiber, A., 2012. A user-mode distributed energy
management architecture for smart grid applications. Energy 44 (1), 167e177.
Basak, P., Chowdhury, S., Dey, S.H., Chowdhury, S.P., 2012. A literature review on
integration of distributed energy resources in the perspective of control, pro-
tection and stability of microgrid. Renew. Sust. Energy Rev. 16, 5545e5556.
Battaglini, A., Lilliestam, J., Haas, A., Patt, A., 2009. Development of SuperSmart
Grids for a more efficient utilisation of electricity from renewable sources.
J. Clean. Prod. 17 (10), 911e918.
Brooke, A., Kendrick, D., Meeraus, A., 2012. GAMS User's Guide. Scientific Press.
Cardenas, J.A., Gemoets, L., Rosas, J.H.A., Sarfi, R., 2014. A literature survey on Smart
Grid distribution: an analytical approach. J. Clean. Prod. 15, 202e216.
Charwand, M., Ahmadi, A., Heidari, A., Esmaeel-Nezhad, A., 2014. Benders decom-
position and normal boundary intersection method for multi-objective decision
making framework for an electricity retailer in energy markets. IEEE Syst. J. 99,
1e10.
Chaouachi, A., Kamel, R.M., Andoulsi, R., Nagasaka, K., 2013. Multiobjective intelli-
gent energy management for a microgrid. IEEE Trans. Ind. Elect. 60 (4),
1688e1699.
Chen, Y.H., Lu, S.Y., Chang, Y.R., Lee, T.T., Hu, M.C., 2013. Economic analysis and
optimal energy management models for microgrid systems: a case study in
Taiwan. Appl. Energy 103, 145e154.
Dali, M., Belhadj, J., Roboam, X., 2010. Hybrid solar wind system with battery
storage operating in grid-connected and standalone mode: control and energy
management e experimental investigation. Energy 35 (6), 2587e2595.
G€orbe, P., Magyar, A., Hangos, K.M., 2012. Reduction of power losses with smart
grids fueled with renewable sources and applying EV batteries. J. Clean. Prod.
34, 125e137.
Hafez, O., Bhattacharya, K., 2012. Optimal planning and design of a renewable en-
ergy based supply system for microgrids. Renew. Energy 45, 7e15.
Hawkes, A.D., Leach, M.A., 2007. Cost-effective operating strategy for residential
micro combined heat and power. Energy 32 (5), 711e723.
Hemmati, M., Amjady, N., Ehsan, M., 2014. System modeling and optimization for
islanded micro-grid using multi-cross learning-based chaotic differential evo-
lution algorithm. Int. J. Electr. Power Energy Syst. 56, 349e360.
Jiayi, H., Chuanwen, J., Rong, X., 2008. A review on distributed energy resources and
microgrid. J. Renew. Sust. Energy Rev. 12, 2472e2483.
Jiejin, C., Xiaoqian, M., Qiong, L., Lixiang, L., Haipeng, P., 2009. A multi-objective
chaotic particle swarm optimization for environmental/economic dispatch.
Energy Conv. Manage. 50 (5), 1318e1325.
Le, K.D., Golden, J.L., Stansberry, C.J., Vice, R.L., Wood, J.T., Ballance, J., Brown, G.,
Kamya, J.Y., Nielsen, E.K., Nakajima, H., Ookubo, M., Iyoda, I., Cauley, G.W., 1995.
Potential impacts of clean air regulations on system operations. IEEE Trans.
Power Syst. 10 (2), 647e656.
Liao, G.C., 2012. Solve environmental economic dispatch of smart microgrid con-
taining distributed generation system e using chaotic quantum genetic algo-
rithm. Int. J. Elect. Power Energy Syst. 43 (1), 779e787.
Lidula, N.W.A., Rajapakse, A.D., 2011. Microgrids research: a review of experimental
microgrids and test systems. J. Renew. Sust. Energy Rev. 15, 186e202.
Mavalizadeh, H., Ahmadi, A., 2014. Hybrid expansion planning considering security
and emission by augmented epsilon-constraint method. Int. J. Elect. Power
Energy Syst. 61, 90e100.
Mavrotas, G., 2009. Effective implementation of the ε-constraint method in mul-
tiobjective mathematical programming problems modified augmented. Appl.
Math. Comp. 213 (2), 455e465.
Moghaddam, A.A., Seifia, A., Niknam, T., 2012. Multi-operation management of a
typical micro-grids using particle swarm optimization: a comparative study.
Renew. Sust. Energy Rev. 16 (2), 1268e1281.
Moghaddam, A.A., Seifi, A., Niknam, T., Pahlavani, M.R.A., 2011. Multi-objective
operation management of a renewable MG (micro-grid) with back-up micro-
turbine/fuel cell/battery hybrid power source. Energy 36 (11), 6490e6507.
Moghimi, H., Ahmadi, A., Aghaei, J., Rabiee, A., 2013. Stochastic techno-economic
operation of power systems in the presence of distributed energy resources.
Elect. Power Energy Syst. 45, 477e488.
Mohamed, F.A., Koivo, H.N., 2011. Multiobjective optimization using modified game
theory for online management of microgrid. Euro. Trans. Electr. Power 21,
839e854.
Motevasel, M., Seifi, A.R., 2014. Expert energy management of a micro-grid
considering wind energy uncertainty. Energy Conv. Manag. 83, 58e72.
Motevasel, M., Seifi, A.R., Niknam, T., 2013. Multi-objective energy management of
CHP (combined heat and power)-based micro-grid. Energy 51, 123e136.
Niknam, T., Abarghooee, R.A., Narimani, M.R., 2012. An efficient scenario-based
stochastic programming framework for multi-objective optimal micro-grid
operation. Appl. Energy 99, 455e470.
Norouzi, M.R., Ahmadi, A., Esmaeel Nezhad, A., Ghaedi, A., 2014a. Mixed integer
programming of multi-objective security-constrained hydro/thermal unit
commitment. Renew. Sust. Energy Rev. 29, 911e923.
Norouzi, M.R., Ahmadi, A., Sharaf, A.M., Esmaeel Nezhad, A., 2014b. Short-term
environmental/economic hydrothermal scheduling. Electr. Power Syst. Res. 116,
117e127.
Palanichamy, C., Babu, N.S., 2008. Analytical solution for combined economic and
emissions dispatch. Elect. Power Syst. Res. 78 (7), 1129e1139.
Palanichamy, C., Srikrishna, K., 1991. Economic thermal power dispatch with
emission constraint. J. Indian Inst. Eng. 72 (11).
Quiggin, D., Cornell, S., Tierney, M., Buswell, R., 2012. A simulation and optimisation
study: towards a decentralised microgrid, using real world fluctuation data.
Energy 41 (1), 549e559.
Rozali, N.E.M., Alwi, S.R.W., Manan, Z.A., Klemes, J.J., Hassan, M.Y., 2014. Optimal
sizing of hybrid power systems using power pinch analysis. J. Clean. Prod. 71,
158e167.
Vahidinasab, V., Jadid, S., 2010. Normal boundary intersection method for suppliers'
strategic bidding in electricity markets: an environmental/economic approach.
Energy Conv. Manag. 51, 1111e1119.
Zhang, L., Gari, N., Hmurcik, L.V., 2014. Energy management in a microgrid with
distributed energy resources. Energy Conv. Manag. 78, 297e305.
Zhang, Y., Gatsis, N., Giannakis, G.B., 2013. Robust energy management for micro-
grids with high-penetration. IEEE Trans. Renew. Sust. Energy 4 (4), 944e953.
Zhao, B., Shi, Y., Dong, X., Luan, W., Bornemann, J., 2014a. Short-term operation
scheduling in renewable-powered microgrids: a duality-based approach. IEEE
Trans. Sust. Energy 5 (1), 209e217.
Zhao, B., Zhang, X., Li, P., Wang, K., Xue, M., Wang, C., 2014b. Optimal sizing,
operating strategy and operational experience of a stand-alone microgrid on
Dongfushan Island. Appl. Energy 113, 1656e1666.
A. Rezvani et al. / Journal of Cleaner Production 87 (2015) 216e226226