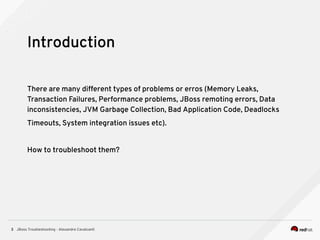
Red Hat JBoss EAP 6
Troubleshooting
Alexandre Cavalcanti
Middleware Technical Account Manager
acavalcanti@redhat.com
JBoss Troubleshooting - Alexandre Cavalcanti2
AGENDA
Introduction
Dumps
Logs
Byteman
JBoss Troubleshooting - Alexandre Cavalcanti3
There are many different types of problems or erros (Memory Leaks,
Transaction Failures, Performance problems, JBoss remoting errors, Data
inconsistencies, JVM Garbage Collection, Bad Application Code, Deadlocks
Timeouts, System integration issues etc).
How to troubleshoot them?
Introduction
JBoss Troubleshooting - Alexandre Cavalcanti4
Thread Dump
The thread dump is a snapshot of exactly what's executing at a moment in
time.
Useful if your Java application sometimes seems to hang when running under
load, as an analysis of the dump will show where the threads are stuck.
JSTACK
• Check PID and user of Java process by executing ps command:
• ps aux | grep java
• Execute jstack command as JBoss user:
• $su - <JAVA_USER>
• $jstack -l <JAVA_PID>
https://access.redhat.com/solutions/18178
Dumps
JBoss Troubleshooting - Alexandre Cavalcanti5
Heap Dump
A heap dump is a snapshot of memory at a given point in time. It contains
information on the Java objects and classes in memory at the time the
snapshot was taken.
A heap dump can also help you understand the memory footprint of your app
• -XX:+HeapDumpOnOutOfMemoryError
• <server-groups>
• <server-group name="main-server-group" profile="ha">
• <jvm name="default">
• …
• <jvm-options>
• <option value="-XX:+HeapDumpOnOutOfMemoryError"/>
• </jvm-options>
• https://access.redhat.com/solutions/21109
Dumps
JBoss Troubleshooting - Alexandre Cavalcanti6
Jitter and Log files
The JBoss Diagnostic Reporter (JDR pronounced jitter) is an EAP6 subsystem
built to collect information to aid in troubleshooting.
• [domain@localhost:9999 /] /host=$host/server=$server/subsystem=jdr/:generate-jar-
report
Add a log level do the log subsystem
• /profile=full-ha/subsystem=logging/logger=org.jboss.jca:add(level=TRACE)
Garbage Collection (GC) logging
• /host=master/jvm=default/:write-attribute(name=jvm-options,value=["-server","-
verbose:gc “,”-Xloggc:gc.log"])
https://access.redhat.com/solutions/221103
https://access.redhat.com/solutions/459903
https://access.redhat.com/solutions/269023
Logs
JBoss Troubleshooting - Alexandre Cavalcanti7
Byteman allows you to insert extra Java code into your application, either as it
is loaded during JVM startup or even after it has already started running. The
injected code is allowed to access any of your data and call any application
methods, including where they are private.
• JAVA_OPTS="$JAVA_OPTS -javaagent:<mypath>/lib/byteman.jar=script:<mypath>/
examplescript.btm,sys:<mypath>/lib/byteman.jar”Bullet
https://access.redhat.com/solutions/31283
http://byteman.jboss.org/
Byteman
Questions?

JBoss Enterprise Application Platform 6 Troubleshooting

  • 1.
    Red Hat JBossEAP 6 Troubleshooting Alexandre Cavalcanti Middleware Technical Account Manager acavalcanti@redhat.com
  • 2.
    JBoss Troubleshooting -Alexandre Cavalcanti2 AGENDA Introduction Dumps Logs Byteman
  • 3.
    JBoss Troubleshooting -Alexandre Cavalcanti3 There are many different types of problems or erros (Memory Leaks, Transaction Failures, Performance problems, JBoss remoting errors, Data inconsistencies, JVM Garbage Collection, Bad Application Code, Deadlocks Timeouts, System integration issues etc). How to troubleshoot them? Introduction
  • 4.
    JBoss Troubleshooting -Alexandre Cavalcanti4 Thread Dump The thread dump is a snapshot of exactly what's executing at a moment in time. Useful if your Java application sometimes seems to hang when running under load, as an analysis of the dump will show where the threads are stuck. JSTACK • Check PID and user of Java process by executing ps command: • ps aux | grep java • Execute jstack command as JBoss user: • $su - <JAVA_USER> • $jstack -l <JAVA_PID> https://access.redhat.com/solutions/18178 Dumps
  • 5.
    JBoss Troubleshooting -Alexandre Cavalcanti5 Heap Dump A heap dump is a snapshot of memory at a given point in time. It contains information on the Java objects and classes in memory at the time the snapshot was taken. A heap dump can also help you understand the memory footprint of your app • -XX:+HeapDumpOnOutOfMemoryError • <server-groups> • <server-group name="main-server-group" profile="ha"> • <jvm name="default"> • … • <jvm-options> • <option value="-XX:+HeapDumpOnOutOfMemoryError"/> • </jvm-options> • https://access.redhat.com/solutions/21109 Dumps
  • 6.
    JBoss Troubleshooting -Alexandre Cavalcanti6 Jitter and Log files The JBoss Diagnostic Reporter (JDR pronounced jitter) is an EAP6 subsystem built to collect information to aid in troubleshooting. • [domain@localhost:9999 /] /host=$host/server=$server/subsystem=jdr/:generate-jar- report Add a log level do the log subsystem • /profile=full-ha/subsystem=logging/logger=org.jboss.jca:add(level=TRACE) Garbage Collection (GC) logging • /host=master/jvm=default/:write-attribute(name=jvm-options,value=["-server","- verbose:gc “,”-Xloggc:gc.log"]) https://access.redhat.com/solutions/221103 https://access.redhat.com/solutions/459903 https://access.redhat.com/solutions/269023 Logs
  • 7.
    JBoss Troubleshooting -Alexandre Cavalcanti7 Byteman allows you to insert extra Java code into your application, either as it is loaded during JVM startup or even after it has already started running. The injected code is allowed to access any of your data and call any application methods, including where they are private. • JAVA_OPTS="$JAVA_OPTS -javaagent:<mypath>/lib/byteman.jar=script:<mypath>/ examplescript.btm,sys:<mypath>/lib/byteman.jar”Bullet https://access.redhat.com/solutions/31283 http://byteman.jboss.org/ Byteman
  • 8.