Javier Garcia - Verdugo Sanchez - Six Sigma Training - W1 Cause and Effect Analysis
•
0 likes•433 views

Javier Garcia - Verdugo Sanchez Six Sigma Training. Week 1. Cause and Effect Analysis

Recommended
Recommended
More Related Content
What's hot
What's hot (20)
Viewers also liked
Viewers also liked (13)
Similar to Javier Garcia - Verdugo Sanchez - Six Sigma Training - W1 Cause and Effect Analysis
Similar to Javier Garcia - Verdugo Sanchez - Six Sigma Training - W1 Cause and Effect Analysis (20)
More from J. García - Verdugo
More from J. García - Verdugo (12)
Recently uploaded
Recently uploaded (20)
Javier Garcia - Verdugo Sanchez - Six Sigma Training - W1 Cause and Effect Analysis
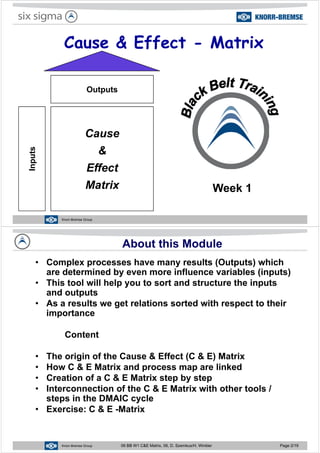
- 1. Cause & Effect - Matrix Outputs Cause & s & Effect Inputs Matrix Week 1 06 BB W1 C&E matrix 06, D. Szemkus/H. WinklerKnorr-Bremse Group About this Module • Complex processes have many results (Outputs) which are determined by even more influence variables (inputs) • This tool will help you to sort and structure the inputs and outputs • As a results we get relations sorted with respect to their• As a results we get relations sorted with respect to their importance Content • The origin of the Cause & Effect (C & E) Matrix • How C & E Matrix and process map are linked Creation of a C & E Matrix step by step• Creation of a C & E Matrix step by step • Interconnection of the C & E Matrix with other tools / steps in the DMAIC cyclesteps in the DMAIC cycle • Exercise: C & E -Matrix 06 BB W1 C&E matrix 06, D. Szemkus/H. WinklerKnorr-Bremse Group 06 BB W1 C&E Matrix, 06, D. Szemkus/H. Winkler Page 2/19
- 2. The DMAIC Cycle Control Maintain DefineMaintain Improvements SPC Control Plans Project charter (SMART) Business Score Card QFD + VOC S i G l D Documentation Strategic Goals Project strategyC M Measure B li A l iImprove AI Baseline Analysis Process Map C + E MatrixAnalyze Improve Adjustment to the Optimum FMEA Measurement System Process Capability Definition of critical Inputs FMEA S FMEA Statistical Tests Simulation Tolerancing Statistical Tests Multi-Vari Studies Regression Tolerancing 06 BB W1 C&E matrix 06, D. Szemkus/H. WinklerKnorr-Bremse Group 06 BB W1 C&E Matrix, 06, D. Szemkus/H. Winkler Page 3/19 Cause & Effect Matrix • The C&E Matrix is a simple QFD (Quality Function Deployment) Matrix. It highlights how important it i t d t d th t i tis to understand the customer requirements. QFD i i t t d d t d• QFD is orientated on new products and processes. One starts with customer needs proceeds to the product design and the processp p g p and finishes with the process control. • The C & E Matrix helps us to apply this technique to existing processes. • We look at the process under investigation with the eye of our customer or our partner (internalthe eye of our customer or our partner (internal customer). 06 BB W1 C&E matrix 06, D. Szemkus/H. WinklerKnorr-Bremse Group 06 BB W1 C&E Matrix, 06, D. Szemkus/H. Winkler Page 4/19
- 3. Cause & Effect Matrix The cause & effect matrix as part of the QFD Customer Requirements House of Functional Requirements mer s Product Design Specifications s Process SpecificationsHouse of Quality 1 Custom Need House of Quality 2 Functional Requirements House of Quality 3 p uctDesign cifications House of Process Control ss ations Product Design Quality 3 Prod Spec House of Quality 4 Proce Specifica Requirements Process Requirements Process Control Requirements ManufacturingProcess Engineering • Performance • Reliability DevelopmentMarketing • Quality Monitoring• Performance • Reliability • Manufacturability • Cost Six SigmaDesign for Six Sigma y g • On Line Control • Statistical Process Control • Quality • System Cost 06 BB W1 C&E matrix 06, D. Szemkus/H. WinklerKnorr-Bremse Group 06 BB W1 C&E Matrix, 06, D. Szemkus/H. Winkler Page 5/19 Six Sigmag g Cause & Effect Matrix Customer The last HoQ connects the Inputs and Outputs of the process Requirements House of Functional Requirements mer s Product Design Specifications s Process SpecificationsHouse of Quality 1 Custom Need House of Quality 2 Functional Requirements House of Quality 3 p uctDesign cifications House of Process Control ss ations Product Design Quality 3 Prod Spec House of Quality 4 Proce Specifica Requirements Process Requirements Process Control Requirements Outputs Cause & uts Effect Matrix Inpu 06 BB W1 C&E matrix 06, D. Szemkus/H. WinklerKnorr-Bremse Group 06 BB W1 C&E Matrix, 06, D. Szemkus/H. Winkler Page 6/19 Matrix
- 4. Cause & Effect Matrix • Relating the inputs to the outputs (customer requirements) using the process map as therequirements) using the process map as the major source of information. • The outputs will be rated in accordance to• The outputs will be rated in accordance to their importance for the customer. Th i t ill b t d i d t• The inputs will be rated in accordance to their relation to the outputs. • Result 1: A ranking for the inputs (Pareto). The key inputs will be further investigated at first (FMEA and validation). • Result 2: Input for measurement system and process capability studies. 06 BB W1 C&E matrix 06, D. Szemkus/H. WinklerKnorr-Bremse Group 06 BB W1 C&E Matrix, 06, D. Szemkus/H. Winkler Page 7/19 The Template CEM t i lCEMatrix.xls R ti f Cause and Effect Matrix Rating of Importance to Customer 1 2 3 4 5 6 7 8 9 10 11 12 13 14 15 Process Step Process Inputs Total 1 0 2 0 3 0 4 0 5 0 6 06 0 7 0 8 0 9 0 10 0 11 011 0 12 0 13 0 14 0 15 0 16 0 17 0 18 0 19 0 20 0 0 06 BB W1 C&E matrix 06, D. Szemkus/H. WinklerKnorr-Bremse Group 06 BB W1 C&E Matrix, 06, D. Szemkus/H. Winkler Page 8/19 Total 0 0 0 0 0 0 0 0 0 0 0 0 0 0 0
- 5. Cause & Effect Matrix, how to Proceed 1. Identify key customer requirements (outputs) from the process map 2 Assign priority factor to each output Use a scale from 1 to 10 (Standard)2. Assign priority factor to each output. Use a scale from 1 to 10 (Standard). (10 = high importance, 1 = low importance) Involve internal customer. For external customer, try to get support from Marketing and Development.y g pp g p 3. Regard all process steps and materials (inputs) from the process map. 4. Evaluate correlation of each input to each output (use 4 levels )4. Evaluate correlation of each input to each output (use 4 levels ) – low score: changes in the input variable (amount, quality, etc.) have small effect on output variable – high score: changes in the input variable can greatly affect the output variable – See next page for more details. 5. Multiply correlation values with priority factors and afterwards add the values of each input row(Excel will do it for you). 6. Dependent of the complexity, you can sort the table descending. The last t i th l ifi ti i b t 3 l 06 BB W1 C&E matrix 06, D. Szemkus/H. WinklerKnorr-Bremse Group 06 BB W1 C&E Matrix, 06, D. Szemkus/H. Winkler Page 9/19 step is the classification in about 3 classes. Correlation between Input and Output • Evaluating the correlation takes the most time I d t id l di i th l f• In order to avoid long discussions use the rule for correlation values, not more than 4 discriminations • If you can not reach an agreement you have the possibility to choose for a compromise in between. 0 = No Correlation 1 = Low probability that the input variable has an effect of the output. 3 = Medium probability that the input variable has an effect on the output. 9 = High probability that the input variable has an effect on the output. 06 BB W1 C&E matrix 06, D. Szemkus/H. WinklerKnorr-Bremse Group 06 BB W1 C&E Matrix, 06, D. Szemkus/H. Winkler Page 10/19
- 6. The Process Map for the Example Take parts from engine cart and Sort parts steel parts versus Put sorted parts into appropriate basket to Step 4 Process Map Cleaning: Classified process key inputs remove caps and covers “light alloy” parts match part and cleaning solution Airworthiness regulations Operator training Operator experience Discipline / Attitude Operator experience Documentation Attitude / Discipline Brightness Re-Clean *.* Run parts placed in Take parts out of basket Check cleanliness NO p p different baskets through the cleaning equipment p and place back onto engine cart and install caps and covers Airworthiness Part Clean? YES Associate trainingAirworthiness Regulations parts still matching to Repair Order / Traceability Critical Parameter Noise Associate training Associate experience Documentation Attitude / Discipline See separate listing at next page y Instructions / SOP Process Parameter *.* Various techniques to “re-clean” Brightness 06 BB W1 C&E matrix 06, D. Szemkus/H. WinklerKnorr-Bremse Group 06 BB W1 C&E Matrix, 06, D. Szemkus/H. Winkler Page 11/19 . Various techniques to re clean using manual operations Example: Cleaning Process Rating of Importance to Customer 10 9 8 7 7 Output rating 2 1 2 3 4 5 6 ean any s ot ed ot rated entin ance tored rtation List Inputs, process steps 3 List Outputs, customer 1 Process Step Process Inputs Partscl without residues Partsno damage Partsno discolo Parts consiste appeara Partsst in transpo Total p p 3 requirements1 2 Sort Steel versus Light alloy parts Training, Documentation 9 9 9 9 1 313 3 Put parts into appropriate basket Discipline, Attitude 9 9 9 9 1 313Input/Output 4 6appropriate basket 6 Check cleanliness Training, Experience 9 3 3 3 3 183 4 Run through Process Parameters (Chemicals and 9 3 3 3 1 169 Input/Output correlation Sort regarding 6 4 g cleaning equipment (Chemicals and Equipment) 9 3 3 3 1 169 1 Remove Caps and Cover Airworthiness Regulations 1 1 3 1 1 57 P t C d Ai thi g g sum 5 5 Put Caps and Covers to the parts Airworthiness Regulations 3 3 3 3 3 123 T l 00 52 40 96 70 0 Calculation 313 = 10*9+9*9+8*9 … 06 BB W1 C&E matrix 06, D. Szemkus/H. WinklerKnorr-Bremse Group 06 BB W1 C&E Matrix, 06, D. Szemkus/H. Winkler Page 12/19 Total 40 25 24 19 7 0
- 7. Example: Cleaning Process Rating of Importance to Customer 10 9 8 7 7 1 2 3 4 5 6 lean tany es ot ed ot rated entin ance tored ortation Process Step Process Inputs Partscl without residue Partsno damage Partsno discolo Parts consiste appeara Partsst in transpo Total 2 Sort Steel versus Light alloy parts Training, Documentation 9 9 9 9 1 313 3 Put parts into appropriate basket Discipline, Attitude 9 9 9 9 1 313 appropriate basket 6 Check cleanliness Training, Experience 9 3 3 3 3 183 4 Run through Process Parameters (Chemicals and 9 3 3 3 1 1694 cleaning equipment (Chemicals and Equipment) 9 3 3 3 1 169 1 Remove Caps and Cover Airworthiness Regulations 1 1 3 1 1 57 P t C d Ai thi 5 Put Caps and Covers to the parts Airworthiness Regulations 3 3 3 3 3 123 T t l 00 52 40 96 70 0 06 BB W1 C&E matrix 06, D. Szemkus/H. WinklerKnorr-Bremse Group 06 BB W1 C&E Matrix, 06, D. Szemkus/H. Winkler Page 13/19 Total 40 25 24 19 7 0 Two Approaches for the C & E Matrix Rating based on a detailed process map• Rating based on a detailed process map – The rating can be done for the inputs and also for the tprocess steps. • At complex processes the matrix is in the same way helpful to determine the importance of singleway helpful to determine the importance of single process steps. – As a result you will get an information which of all the step shall be further investigated. – In this way you can reduce the work time of your project. 06 BB W1 C&E matrix 06, D. Szemkus/H. WinklerKnorr-Bremse Group 06 BB W1 C&E Matrix, 06, D. Szemkus/H. Winkler Page 14/19
- 8. Another Example Steps of a sub-assembly manufacturing, Example: Printed Circuit Board Screen printing (Reflow paste) SMD placement Reflow soldering Screen printing (SMD glue) SMD placement Process Map Product Assembly: p (Reflow paste) placement soldering (SMD glue) placement Glue drying inThrough hole Waiting timeTransport on Wave soldering Reflow ovenassemblyconveyor Touch up Rework (if Assembly ofCutting of In circuit testTouch up, optical inspect. Rework (if necessary) Assembly of housing, labels Cutting of board array In circuit test Packing of single device Transport to packing area Functional testRework (if necessary) Only for double sided PCBs (value adding)Quality costValue add activities Only 9 steps out of 14 are adding value at single sided PCB 06 BB W1 C&E matrix 06, D. Szemkus/H. WinklerKnorr-Bremse Group 06 BB W1 C&E Matrix, 06, D. Szemkus/H. Winkler Page 15/19 Only 9 steps out of 14 are adding value… at single sided PCB The PCB Example RatingofImportanceto Customer 10 10 4 7 7 7 1 6 5 8 Customer 1 2 3 4 5 6 7 8 9 10 ance y nce work ness ort evice andling ng ons ProcessInputs RF perform Switch reliability Enduran Visiblew quality Robustn Transpo safetyd Internal activity Easyha Easy operatin instructi Price Total 1 Cleanlinessofthescreen printmodel 5 5 3 1 1 1 1 1 1 1 153 2 SMTplacementaccuracy 5 5 1 1 1 1 1 1 1 1 145 3 Temp.profilereflowoven 5 5 5 1 1 1 3 1 1 1 163 We see here an additional row! 4 AdjustmentSMTequipment 9 7 1 1 1 1 1 1 1 1 205 5 Printedpartscompleteand correct 5 9 3 1 1 1 3 1 1 1 195 6 Wavesolderingparameter 5 5 5 1 3 1 1 1 1 1 175 What information we can gather?7 Assemblycomplete& correct 1 9 3 9 7 5 1 7 1 1 315 8 Functiontest& programmingcorrect 9 9 1 1 1 1 1 3 1 5 269 9 P k i 1 1 1 7 1 9 1 1 1 3 179 we can gather? 9 Packaging 1 1 1 7 1 9 1 1 1 3 179 Total 450 550 92 161 119 147 13 102 45 120 06 BB W1 C&E matrix 06, D. Szemkus/H. WinklerKnorr-Bremse Group 06 BB W1 C&E Matrix, 06, D. Szemkus/H. Winkler Page 16/19
- 9. The Composition in the DMAIC Cycle Rating of Importance to 9 9 7 10 10 9 3 2 6 C & E Matrix Importance to Customer 9 9 7 10 10 9 3 2 6 1 2 3 4 5 6 7 8 9 10 11 12 13 14 15 Process Inputs GelTime Viscosity Cleanliness Color Homogeneity Consistency DigetsTime Temperature Solids Total 1 Scales Accuracy 9 8 2 1 1 9 1 1 8 321 Preheating FMEACapability of Process and M t S t 2 Preheating DICY TK 1 1 1 1 1 1 1 1 1 65 3 DMF Load Accuracy 3 8 1 1 1 8 1 3 8 255 4 DMF Cleanliness 1 1 4 2 1 2 1 1 1 105 5 DMF Raw Materials 1 1 1 1 1 2 1 1 1 74 6 DICY Load Accuracy 9 7 1 1 1 9 1 1 2 269 7 DICY Envir. Factors 8 5 3 1 1 8 1 1 2 247 DICY Raw Process or Product Name: Prepared by: Process/Product Failure Modes and Effects Analysis (FMEA) USLLSL Measurement System 8 DICY Raw Materials 8 5 1 1 1 9 1 1 2 242 9 DICY Mixer Speecd 1 1 1 1 7 1 1 1 1 125 Responsible: FMEA Date (Orig) ______________ (Rev) ___ Process Step/Part Number Potential Failure Mode Potential Failure Effects S E V Potential Causes O C C Current Controls D E T R P N Spin Draw Process Fiber Breakouts Undersized package, High SD panel-hours lost 2 Dirty Spinneret 8 Visual Detection of Wraps and broken Filaments 9 144 5 Filament motion 2 Visual Sight-glass 8 80 8 Polymer defects 2 Fuzzball Light 9 1448 2 9 144 0 33323130292827 Prozeßschritt Control strategy Ergebnis ( Output) Spezifikation OSG Ziel USG Fahigkeit Cp Faktor ( Input) Spezifikation OSG Ziel USG Maßnahmen Was Cp Cpk Muster Anzahl Häüfigkeit Messmittel % R & R % P/T USG Fahigkeit Cp Cpk Muster Anzahl Häüfigkeit Messmittel % R & R Verantwrtlich Abgeschlossen Wirksamkeit 06 BB W1 C&E matrix 06, D. Szemkus/H. WinklerKnorr-Bremse Group 06 BB W1 C&E Matrix, 06, D. Szemkus/H. Winkler Page 17/19 % P/T Datum Bewertet durch Team Exercise: U th lt f th i• Use the results of the exercise process map to develop a C & E matrix with input / output correlationcorrelation • Duration: 30 minutes,, ... followed by a team presentation 06 BB W1 C&E matrix 06, D. Szemkus/H. WinklerKnorr-Bremse Group 06 BB W1 C&E Matrix, 06, D. Szemkus/H. Winkler Page 18/19
- 10. Summary • The origin of the Cause & Effect (C & E) Matrix • How C & E Matrix and process map are linked• How C & E Matrix and process map are linked • Creation of a C & E Matrix step by step • Interconnection of the C & E Matrix with other tools / steps in the DMAIC cycle • Exercise: C & E -Matrix 06 BB W1 C&E matrix 06, D. Szemkus/H. WinklerKnorr-Bremse Group 06 BB W1 C&E Matrix, 06, D. Szemkus/H. Winkler Page 19/19