Sr. No. Description
1.Measurement and evaluation: concept, need, scope; difference and relevance.
Educational testing and assessment: concept, context, issues and current trends.
Scales of measurement: ordinal, nominal, interval, ratio.
2. Characteristics of a good test. Planning for different types of test. Validity--
types and methods and usability. Reliability-- types and methods and usability.
3. Test construction. Test standardization. Item analysis: Item difficulty,
discrimination index. Effectiveness of distracters. Development of Norms of a
test.
4. Conversion of raw scores into standard scores, T-scores, C-scores, Z-
scores, Stanine scores, percentiles. Interpretation of test scores: qualitative
and quantitative.
5. Criterion referenced test, Norm reference test, Factors influencing test scores:
nature of test, psychological factors and environmental factors.
6. Integrated approach of evaluation. Marking system: need, problems and
components. Grading—need, problems, components and methods. Methods of
feedback for students
7. Semester system vs annual system, Continuous assessment, Portfolio assessment
Question bank, Use of computer in evaluation.
8. Achievement test: concept, types and construction. Diagnostic test: concept and
construction, remedial teaching. Objective type test: advantages and limitations
9. Short answer type test: advantages and limitations. Essay type test: advantages
and limitations
10. Formative and Summative Evaluation. Measurement of Attitude,
Aptitude, personality and intelligence
SYLLABUS
Educational Measurement and Evaluation
Objectives :
To enable the learners to
(1) familiarise with the utility of measurement evaluation
(2) familiarise with different kinds of psychological tests
(3) understand the steps for the construction of an achievement test and the characteristics of good test and type of test i.e.
standardized and non-standardised tests
5.
CONTENTS
Unit 1: EducationalTesting and Assessment : Concept, Context, Issues and Current Trends 1
Unit 2: Measurement and Evaluation : Concept, Need, Scope, Difference and Relevance 16
Unit 3: Scales of Measurement : Ordinal, Nominal, Interval, Ratio 31
Unit 4: Characteristics of a Good Test 37
Unit 5: Planning for Different Types of Test 46
Unit 6: Validity – Types , Methods and Usability 63
Unit 7: Reliability – Types , Methods and Usability 78
Unit 8: Test Construction 90
Unit 9: Test Standardization 111
Unit 10: Item Analysis : Item Difficulty, Discrimination Index, Effectiveness of Distractors 125
Unit 11: Development of Norms of a Test 149
Unit 12: Conversion of Raw Scores into Standard Scores, T-scores, C-scores, Z-scores, Stanine Scores,Percentiles 158
Unit 13: Interpretation of Test Scores : Qualitative and Quantitative 169
Unit 14: Criterion Referenced Test 181
Unit 15: Norm Referenced Test 187
Unit 16: Factors Influencing Test Scores : Nature of Test, Psychological Factors and Environmental Factors 194
Unit 17: Integrated Approach of Evaluation 200
Unit 18: Marking System : Need, Problems, Components 209
Kulwinder Pal, Lovely Professional University
Dinesh Kumar, Lovely Professional University
Kulwinder Pal, Lovely Professional University
Kulwinder Pal, Lovely Professional University
Kulwinder Pal, Lovely Professional University
Kulwinder Pal, Lovely Professional University
Kulwinder Pal, Lovely Professional University
Kulwinder Pal, Lovely Professional University
Kulwinder Pal, Lovely Professional University
Kulwinder Pal, Lovely Professional University
Dinesh Kumar, Lovely Professional University
Dinesh Kumar, Lovely Professional University
Dinesh Kumar, Lovely Professional University
Dinesh Kumar, Lovely Professional University
Dinesh Kumar, Lovely Professional University
Dinesh Kumar, Lovely Professional University
Dinesh Kumar, Lovely Professional University
Dinesh Kumar, Lovely Professional University
6.
Unit 19: Grading- Need, Problems, Components and Methods 221
Unit 20: Methods of Feedback for Students 235
Unit 21: Semester System vs Annual System 244
Unit 22: Continuous Assessment 250
Unit 23: Portfolio Assessment 261
Unit 24: Question Bank 274
Unit 25: Use of Computer in Evaluation 282
Unit 26: Achievement Test: Concept, Types and Construction 290
Unit 27: Diagnostic Test : Concept and Construction, Remedial Teaching 312
Unit 28: Objective Type Test : Advantages and Limitations 323
Unit 29: Short Answer Type Test : Advantages and Limitations 333
Unit 30: Essay Type Test : Advantages and Limitations 344
Unit 31: Formative and Summative Evaluation 352
Unit 32: Measurement of Attitude, Aptitude, Personality and Intelligence 363
Dinesh Kumar, Lovely Professional University
Kulwinder Pal, Lovely Professional University
Kulwinder Pal, Lovely Professional University
Kulwinder Pal, Lovely Professional University
Kulwinder Pal, Lovely Professional University
Kulwinder Pal, Lovely Professional University
Kulwinder Pal, Lovely Professional University
Kulwinder Pal, Lovely Professional University
Dinesh Kumar, Lovely Professional University
Dinesh Kumar, Lovely Professional University
Dinesh Kumar, Lovely Professional University
Dinesh Kumar, Lovely Professional University
Dinesh Kumar, Lovely Professional University
Dinesh Kumar, Lovely Professional University
7.
Unit 10 :Item Analysis : Item Difficulty, Discrimination index, Effectiveness of Distractors
125
LOVELY PROFESSIONAL UNIVERSITY
Notes
Unit 10 : Item Analysis : Item Difficulty,
Discrimination index, Effectiveness of Distractors
CONTENTS
Objectives
Introduction
10.1 Meaning of Item Analysis
10.2 Need of Item Analysis
10.3 Process of Item Analysis
10.4 The Difficulty Index
10.5 Calculation of Difficulty Value of Items
10.6 Correcting Difficulty Indices for Chance Errors
10.7 Discrimination Index
10.8 Calculating Discriminating Value by Formula
10.9 Relationship between Difficulty Index and Discrimination Index
10.10 Effectiveness of Distractors
10.11 A Practical approach in Item Analysis
10.12 Summary
10.13 Keywords
10.14 Review Questions
10.15 Further Readings
Objectives
The objectives of this unit can be summarized as below :
• To discuss about the meaning of item analysis
• To describe about the need of item analysis
• To explain about the process of item analysis
• To describe about the Difficulty index and Calculation of difficulty value of items
• To explain about correcting difficulty indices for chance errors.
• To describe about the discrimination index and calculating discrimination value by formula
• To explain about the relationship between difficulty index and discrimination Index
• To discuss about the effectiveness of distractors
Introduction
After having administered a test and marked it, most teachers would discuss the answers with
students. Discussion would usually focus on the right answers and the common errors made by
students. Some teachers may focus on the questions most students performed poorly and the
questions students did very well. However, there is much more information available about a
test that is often ignored by teachers. This information will only be available if the Item Analysis
Dinesh Kumar, LPU
8.
Educational Measurement andEvaluation
126
Notes
LOVELY PROFESSIONAL UNIVERSITY
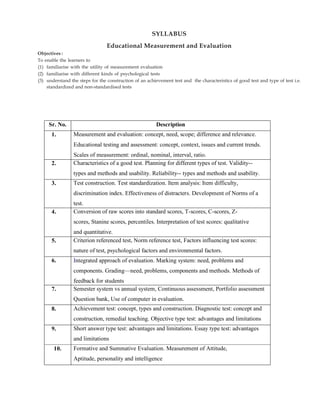
is done. What is item analysis ? Item analysis is a process which examines the responses to
individual test items or question in order to assess the quality of those items and the test as a
whole. Item analysis is especially valuable in improving items or questions that will be used
again in later tests, but it can also be used to eliminate ambigous or misleading items in a single
test administration. Specifically, item analysis is the process of finding out the difficulty index,
discrimination index and the effectiveness of distractors. [We will discuss each of these components of item
analysis in detail later].
The quality of a test is determined by the quality of each item or question in the test. The teacher
who constructs a test can only roughly estimate the quality of a test. This estimate is based on the
fact that the teacher has followed all the rules and conditions of test construction. However, it is
possible that this estimation may not be accurate and certain important aspects have been ignored.
Hence, it is suggested that to obtain a more comprehensive understanding of the test, item
analysis should be conducted on the responses of students. Item analysis is conducted to obtain
information about individual items or questions in a test and how the test can be improved. It
also facilitates the development of an item or question bank which can be used in the construction
of a test (Anastasi, 2001).
10.1 Meaning of Item Analysis
The success of a test depends on two factors. First, how successfully a test measures our prescribed
objectives, and second, can each item in the test discriminate between bright and dull students or
not. If a test is not capable of measuring the given objectives meaningfully and discriminating
students, then it cannot be called a successful test.
When a test is constructed, it is begun by noting down the desirable behavioural or personality
trait, and the statements or problems relating to them. As a common rule, the number of these
statements or test items is far larger than the desirable number in the test. It is done so that the
tests found not fit for final inclusion can be deleted. Therefore, an important task of a test-maker
is to verify the test items and select only those which are good enough, reliable, valid and which
fulfil the objectives. This whole process is called item-analysis.
As far as item-analysis is concerned, Freeman has opined that two aspects should be chiefly
considered while undertaking item-analysis : first, the difficulty level of items and second,
discriminating value of test items. According to Guilford, before the final form of the test is
constructed, the method of item-analysis must be applied. The different attributes of the whole
test are dependent on the items included in a test, such as mean variance, form of score distribution,
reliability and validity.
According to Lamark, “The procedure used to judge the quality of an item is called item-analysis.”
10.2 Need of Item-Analysis
The chief objective of item-analysis of a test is to select those items which are suitable, reliable
and valid for that class of students or individuals for whom the test has been constructed. A good
test requires good test items. If the test items of a test are objective-oriented, and are also reliable
and valid, then the test becomes useful. Selecting such items is the purpose of item-analysis.
In brief, item-analysis is needed for the following purposes :
1. Rejecting the items which are weak and have double meaning.
2. Each selected item should represent the whole test.
3. Determining the number of items to be included in the test.
4. Expressing the defects in the responses of the students.
9.
Unit 10 :Item Analysis : Item Difficulty, Discrimination index, Effectiveness of Distractors
127
LOVELY PROFESSIONAL UNIVERSITY
Notes
According to Harper and Chauhan, “ Test analysis is a general term which covers a wide range
of statistical and analytical techniques which may be applied for the purpose of improving tests,
examinations, quizzes and other mental measurement devices.”
— Harper, Proceedings of the 62nd Indian Science Congress, Part 2nd Presidential Address (1974)
Criteria for Item-analysis : The purpose of item-analysis is to select suitable and good test items
from the many items the test-maker has made. For this, each item is evaluated. Besides, it is
determined on the basis of a certain criterion which item is good and should be selected, and
which item is not good and should not be selected. This decision is taken on two bases :
1. Difficulty index, and
2. Discrimination index or validity index.
If the difficulty index and discrimination index of an item are of the desired level, then that item
is selected. There is no definite formula or principle to determine what should be the difficulty
and discrimination indices of an item. This depends on the objective of the test and the insight
and vision of the test-maker. If a test is survey-type, then the questions with difficulty index
between 20-80 and with discrimination index. 3 or more, are considered suitable. If a test has
been made with a view of selection, then its difficulty index should be between 10-50 and
discrimination index should be about .4 or .5. To calculate difficulty index of a question, it is
found how many people in the sample have solved the item correctly, and then this is simplified,
and if it is lower, then it is made more difficult, Besides, each item’s discrimination index is
correlated with the entire test. It is assumed that the whole test measures that trait for which it
has been constructed. Therefore, if the correlation of an item is more than the whole test, then it
is understood that item measures that trait, that is, the item is valid.
Item-analysis is also called ‘evaluation of the test’ or ‘try-out stage of test construction’.
This is an extremely important step of the test, and no test can be completed without this
process.
10.3 Process of Item-Analysis
To undertake item-analysis, at first the test is administered to a sample of those individuals or
students for whom it has been constructed. After that, all test papers are marked and the following
processes are sequentially followed :
1. Test-papers or answer-sheets are arranged in the ascending order of scores.
2. To prepare item-analysis chart. In this chart, at first, the serial number of items is written in
the columns. On the left, the names or serial number of students are written in rows. Thus,
the chart is divided into many rows and columns, and when lined, they make several cells.
3. After this, the answer-sheet of each student is taken and it is seen whether he has solved it
correctly or not, and a right tick mark is given for the right response and a cross mark is
given for the wrong response. Thus, all test items are marked on the chart. At the end of the
chart, two rows are made where the difficulty index and discrimination index are written.
4. In each column of the chart from top to bottom, the right tick marks are counted and are
changed into percentage in order to write them in the form of difficulty index. Thus, difficulty
index is calculated in respect of all test items.
5. To calculate discrimination index, we divide the analysis chat into almost three equal parts
from top to bottom.
10.
Educational Measurement andEvaluation
128
Notes
LOVELY PROFESSIONAL UNIVERSITY
For example, if one hundred students were administered the test, then the first and third
part will have 33 students and the second part will have 34 students. The second part will be
covered with a white sheet and stapled. Now, the total of the right responses in the first part
and third part will be written in the white sheet. Now, the number of students in the third
part who have attempted a particular item correctly will be deducted from the number of
students in the first part who have attempted that particular item correctly. The difference
thus obtained will be divided by N/3. The coefficient thus obtained will be called its
discrimination index. Thus, discrimination index will be calculated for each item, and it will
be written in the last row of the chart.
Following is the formula for calculating discrimination index :
V. I. =
T B
N/3
−
Where, T = Top group
B = Bottom group
N = sample size
6. Now, each item of the test in the chart is studied to see whether its difficulty index is
between 20-80 or 10-50 as per the objective of the test and whether its discrimination index
is above .3 or not. The items which pass these two criteria are selected. As many items are
selected and written separately as are needed for the test. Thus, the final form of the test is
readied, which is further verified for its reliability, validity and norms in order to make it
standardized.
Some scholars do not take one-third of the samples as above, but they take only top 27%
and bottom 27% of the sample. It is tabulated which tells the above requirements easily.
According to the opinion of Kelly, the formula of top-bottom 27% is considered valid and
suitable because on its basis it can be decisively said whether the top group is superior and
the bottom group is inferior. If a smaller top-bottom group is taken, then these groups are
too small to decide something. Still, there is no definite rule in this regard. The higher is the
number of candidates in the top-bottom group, higher will be the discrimination index.
External Criterion for Item-analysis : In the above discussion, the basis for validity of each
item was internal, that is, it was accepted as the criterion measure of the whole test, and its
correlation was calculated in respect of the whole test. This type of assumption and logic is
rational. On this basis, we can say that each item evaluates that trait which is evaluated by
the test as a whole, but we cannot say how far it evaluates that trait which it ought to.
Generally we take an external criterion in order to ascertain that each item in the test is
evaluating the trait for which it has been included in the test, and thus each item is validated
on the basis of that external criterion. In the view of Ryens, no specific assistance is offered
by the external criterion.
Steps In Item Analysis
Let us take an example of teacher who has administered a 30 item multiple-choice objective
test in geography to 45 students in a secondary school classroom.
Step 1 : Obviously, upon receiving the answer sheet, the first step would to mark each of
the answer sheets.
Step 2 : Arrange the 45 answer sheets from the highest score obtained until the lowest
score obtained. The paper with the highest score is on top and the paper with the
lowest score is at the bottom.
Educational Measurement andEvaluation
130
Notes
LOVELY PROFESSIONAL UNIVERSITY
the two groups who answered incorrectly. In other words, 54% of students selected the correct
answer. Although our computation is based on the high and low scoring groups only, it provides
a close approximation to the estimate that would be obtained with the total group. Thus, it is
proper to say that the index of difficulty for this item is 54% (for this particular group). Note that,
since difficulty refers to the percentage getting the item right, the smaller the percentage figure
the more difficult the item. Lein (1980) provides these guidelines on the meaning of the difficulty
index as follows :
> 0.70 = Easy
0.30 – 0.69 = Moderate
< 0.29 = Difficult
Table. 8.4 Interpretation of the Difficulty Index (p)
If a teacher believes that the achievement 0.54 on the item is too low, he or she can change the
way he or she teaches to better meet the objective represented by the item. Another interpretation
might be that the item was too difficult or confusing or invalid, in which case the teacher can
replace or modify the item, perhaps using information from the item’s discrimination index or
distractor analysis.
Activity
A teacher gave a 20 item science test to a group of 35 students. The correct answer for
Question # 25 is ‘C’ and the results are as follows :
Options A B C D Blank
High Marks Group (n = 10) 0 2 8 2 0
Low Marks Group (n – 10) 2 4 3 2 1
(a) Compute the difficulty index (p) for Questions # 25.
(b) Is Question # 25 an easy or difficult question ?
(c) Do you think you need to improve Question # 25 ?
10.5 Calculation of Difficulty Value of Items
The ratio of students’ group that solves a question correctly or knows it actually is called its
difficulty index. Difficulty index assists to arrange items in sequence, and indicates what item
will be placed first and what item will follow it or will come in the end. There is no definite
suitable method to ascertain difficulty index, still following are the chief methods used to calculate
difficulty index :
1. By right response of the 27% top group and 27% bottom group.
2. 35% Harper’s facility index method.
3. By right response of the 50% top group and 50% bottom group.
4. By right response of the 33% top group and 33% bottom group.
5. By formula method.
Generally, 27% top and 27% bottom group method is used, but 50% top and 50% bottom group
is taken in case of a smaller group (N < 100) Here we shall discuss only the first four methods
only :
13.
Unit 10 :Item Analysis : Item Difficulty, Discrimination index, Effectiveness of Distractors
131
LOVELY PROFESSIONAL UNIVERSITY
Notes
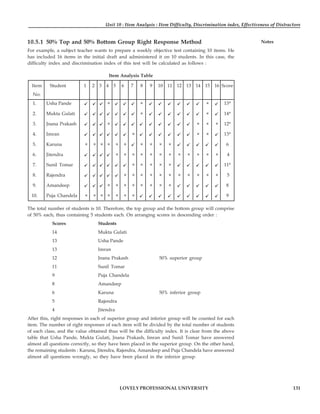
10.5.1 50% Top and 50% Bottom Group Right Response Method
For example, a subject teacher wants to prepare a weekly objective test containing 10 items. He
has included 16 items in the initial draft and administered it on 10 students. In this case, the
difficulty index and discrimination index of this test will be calculated as follows :
Item Analysis Table
Item Student 1 2 3 4 5 6 7 8 9 10 11 12 13 14 15 16 Score
No.
1. Usha Pande 9 9 9 × 9 9 9 × 9 9 9 9 9 9 × 9 13*
2. Mukta Gulati 9 9 9 9 9 9 9 × 9 9 9 9 9 9 × 9 14*
3. Jnana Prakash 9 9 9 × 9 9 9 9 9 9 9 9 9 × × × 12*
4. Imran 9 9 9 9 9 9 × 9 9 9 9 9 9 × × 9 13*
5. Karuna × × × × × × 9 × × × × 9 9 9 9 9 6
6. Jitendra 9 9 9 9 × × × × × × × × × × × × 4
7. Sunil Tomar 9 9 9 9 9 9 × × × × × 9 9 9 9 9 11*
8. Rajendra 9 9 9 9 9 × × × × × × × × × × × 5
9. Amandeep 9 9 9 × × × × × × × × 9 9 9 9 9 8
10. Puja Chandela × × × × × × × 9 9 9 9 9 9 9 9 9 9
The total number of students is 10. Therefore, the top group and the bottom group will comprise
of 50% each, thus containing 5 students each. On arranging scores in descending order :
Scores Students
14 Mukta Gulati
13 Usha Pande
13 Imran
12 Jnana Prakash 50% superior group
11 Sunil Tomar
9 Puja Chandela
8 Amandeep
6 Karuna 50% inferior group
5 Rajendra
4 Jitendra
After this, right responses in each of superior group and inferior group will be counted for each
item. The number of right responses of each item will be divided by the total number of students
of each class, and the value obtained thus will be the difficulty index. It is clear from the above
table that Usha Pande, Mukta Gulati, Jnana Prakash, Imran and Sunil Tomar have answered
almost all questions correctly, so they have been placed in the superior group. On the other hand,
the remaining students : Karuna, Jitendra, Rajendra, Amandeep and Puja Chandela have answered
almost all questions wrongly, so they have been placed in the inferior group.
14.
Educational Measurement andEvaluation
132
Notes
LOVELY PROFESSIONAL UNIVERSITY
Difficulty Level Index
Higher Group Inferior Group Joint Difficulty Index
Item Number of Difficulty Number of Difficulty (RH
= RL
)
No. right responses index (RH
) right responses index (RL
)
1. 5 5/5 1.00 3 3/5 .60 1.60 .80
2. 5 5/5 1.00 3 3/5 .60 1.60 .80
3. 5 5/5 1.00 3 3/5 .60 1.60 .80
4. 3 3/5 .60 2 2/5 .40 1.00 .50
5. 5 5/5 1.00 1 1/5 .20 1.20 .60
6. 5 5/5 1.00 0 0/5 .00 1.00 .50
7. 2 2/5 .40 1 1/5 .20 0.60 .30
8. 3 3/5 .60 1 1/5 .20 0.80 .40
9. 4 4/5 .80 1 1/5 .20 1.00 .50
10. 4 4/5 .80 1 1/5 .20 1.00 .50
11. 4 4/5 .80 1 1/5 .20 1.00 .50
12. 5 5/5 1.00 3 3/5 .60 1.60 .80
13. 5 5/5 1.00 3 3/5 .60 1.60 .80
14. 3 3/5 .60 3 3/5 .60 1.20 .60
15. 1 1/5 .20 3 3/5 .60 0.80 .40
16. 4 4/5 .80 3 3/5 .60 1.40 .70
Difficulty Index (D.I.) =
H L
R R
2
+
Where, D. I. = Difficulty Index
RH
= Right responses in Higher Group
RL
= Right responses in Lower Group
In the above table, the items with .80 difficulty index is the easiest and with .30 is the most
difficult.
In order to calculate discriminating value, the difference between the number of right responses
in the two groups is found out. This is called the discrimination index or validity index (V.I.).
This is,
V.I. = RH
– RL
(N being the same for both groups)
The following table displays the discriminating value or validity index :
15.
Unit 10 :Item Analysis : Item Difficulty, Discrimination index, Effectiveness of Distractors
133
LOVELY PROFESSIONAL UNIVERSITY
Notes
Validity Index Table
Item No. Number of right Number of right Degree of
responses in responses in inferior (V.I. = RH
–RL
) Value Validity
superior group (RH
) group(RL
)
1. 5 3 +2 Ordinary
2. 5 3 +2 Ordinary
3. 5 3 +2 Ordinary
4. 3 2 +1 Bad
5. 5 1 +4 Very good
6. 5 0 +5 Best
7. 2 1 +1 Bad
8. 3 1 +2 Ordinary
9. 4 1 +3 Good
10. 4 1 +3 Good
11. 4 1 +3 Good
12. 5 3 +2 Ordinary
13. 5 3 +2 Ordinary
14. 3 3 0 Very bad
15. 1 3 – 2 Negative
16. 4 3 +1 Bad
It is clear from the above table that the V.I. of the 15th item is negative. It means that the number
of right responses in the inferior group is more than the number of right responses in the
superior group. Therefore, this item is not suitable and it should not be included in the final draft
of the test. In the same way, the discriminating value of 14th item is zero, which means that this
question cannot discriminate between good and bad students, because both types of students can
attempt it correctly, and from this viewpoint, this is not suitable for inclusion in the final test.
Besides, the discriminating value of 4th, 7th and 16th questions is not satisfactory, so they will
have to be excluded from the final draft. The remaining questions can be selected in the final
draft with regard to their difficulty index and discriminating value.
Selection of Items for Final Form of the Test
Item No. Difficulty Index Discriminating Value Result
1. .80 + 2 Selected
2. .80 + 2 Selected
3. .80 + 2 Selected
4. .50 + 1 Excluded
5. .60 + 4 Selected
6. .50 + 5 Selected
7. .30 + 1 Excluded
8. .40 + 2 Selected
9. .50 + 3 Selected
16.
Educational Measurement andEvaluation
134
Notes
LOVELY PROFESSIONAL UNIVERSITY
10. .50 + 3 Selected
11. .50 + 3 Selected
12. .80 + 2 Selected
13. .80 + 2 Selected
14. .60 0 Excluded
15. .40 – 2 Excluded
16. .70 + 1 Excluded
Thus, items 1, 2, 3, 5, 6, 8, 9, 10, 11, 13 and 13 have been selected for the final form of the test.
10.5.2 Calculating Difficulty Index By Formula
According to the formula method, the following formula is used to calculate difficulty level of
items :
D.I. =
i
t
N
100
N
×
Where, D.I. = Item difficulty Index
Ni
= Number of students attempting it correctly
Nt
= Total number of students.
For example, in a test, 120 out 150 students have correctly attempted an item, and 30 students
have attempted it incorrectly, then the difficulty index of that item will be :
D.I. =
120
100
150
×
= 80% or .80
10.6 Correcting Difficulty Indices for Chance Errors
10.6.1 Guilford’s Formula
There is every possibility while administering a multiple items that students will guess answers
without actually knowing the right responses. In order to curb this tendency, the correction
formula is applied, which is are as follows :
Pc
=
W 1
R
K 1 N
⎛ ⎞
−
⎜ ⎟
−
⎝ ⎠
Where, Pc
= The percentage of those who know the right responses.
R = The percentage of those who give right response.
W = The percentage of those who give wrong response.
N = The number of candidates in the sample.
K = The number of alternatives.
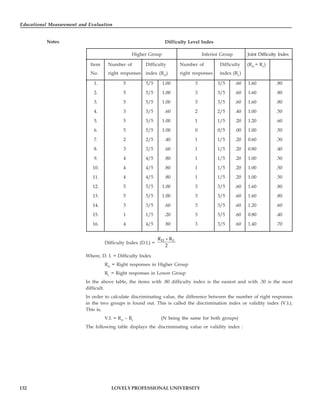
Example : Supposing out of a total of 300 students, only 240 students have given the right
response for an item, and this item had four alternatives. Now, the difficulty level of this item
will be :
17.
Unit 10 :Item Analysis : Item Difficulty, Discrimination index, Effectiveness of Distractors
135
LOVELY PROFESSIONAL UNIVERSITY
Notes
Pc
=
60
240
4 1 300
1
⎛ ⎞
−
⎜ ⎟
−
⎝ ⎠
[W = N – R]
=
60
240
3 300
1
⎛ ⎞
−
⎜ ⎟
⎝ ⎠
= ( )
240 20
300
1
−
=
220
300
= .733
= .733 × 100 = 73.3% (Difficulty Index in Percent)
Sometimes it is seen in multiple choice items that a student is not able to attempt some items of
the test. It could be due to lack of time or the items being very difficult, or some other cause. Such
items are called unattempted or unreached items. For explanation, supposing in a 50-item test, a
candidate has attempted all questions from 1 to 25, he has not attempted items 26 and 27, and
then he has solved all items from 28 to 40, and has not solved any item after that. In such a
situation, items 41 to 50 will be called unattempted or unreached items, but not items 26 and 27.
besides, there will be three groups of candidates : who have given right responses, who have
given wrong responses and who have not responded.
In solving this type of questions, the formula is amended to the following form :
Pc
=
W 1
R
K 1 N NR
⎛ ⎞
−
⎜ ⎟
− −
⎝ ⎠
Here, NR is the number of candidates who have not been able to solve an item or have not
attempted it. The remaining all symbols have been used as in the previous formula.
Example : Supposing, a 100-item test was administered to 300 candidates. Each item contained 4
alternatives. This is also assumed that 150 were right responses, 120 were wrong responses and
30 were unattempted. In such a situation, the difficulty index of that particular item will be as
follows:
Pc
=
120 1
150
4 1 300 30
⎛ ⎞
−
⎜ ⎟
− −
⎝ ⎠
=
120 1
150
3 270
⎛ ⎞
−
⎜ ⎟
⎝ ⎠
= ( )
1
150 40
270
−
=
1
110
270
×
=
11
27
= 0.4 ×100
= 40%
18.
Educational Measurement andEvaluation
136
Notes
LOVELY PROFESSIONAL UNIVERSITY
10.6.2 Kelley’s Formula
When the number of students is very large, in such a situation, Kelley’s top 27% and bottom 27%
formula proves convenient, which is as follows :
Pc
=
H L
H L
H H L L
1 W 1 W 1
R R
2 K 1 N NR K 1 N NR
⎧ ⎫
⎛ ⎞ ⎛ ⎞
− + −
⎨ ⎬
⎜ ⎟ ⎜ ⎟
− − − −
⎝ ⎠ ⎝ ⎠
⎩ ⎭
Where, RH = Number of candidates in top group giving right response
WH
= Number of candidates in top group giving wrong response.
NH
= Number of total candidates in top group.
NRH
= Number of candidates in top group who have not attempted the item.
RL
= Number of candidates in bottom group giving right response.
WL
= Number of candidates in bottom group giving wrong response.
NL
= Number of total candidates in bottom group.
NRL
= Number of candidates in bottom group who have not attempted the item.
Example : An achievement test was administered upon a group of 380 students approximately.
The Test-administrator is interested in calculating Difficulty-Index of Item No. 75 by Kelleys, T-
B 27% method for which the different values are as under :
NH
= 100, RH
= 70, WH
= 20 and NRH
= 10
NL
= 100, RL
= 20, WL
= 60 and NRL
= 20
Solution :
∴ c
P =
20 60
70 20
1 5 1 5 1
2 100 10 100 20
⎧ ⎫
− −
⎪ ⎪
− −
+
⎨ ⎬
− −
⎪ ⎪
⎩ ⎭
=
20 60
70 20
1 4 4
2 90 80
⎧ ⎫
− −
⎪ ⎪
+
⎨ ⎬
⎪ ⎪
⎩ ⎭
= { }
1 70 5 20 15
2 90 80
− −
+
= { }
1 65 5
2 90 80
+
= { }
1 5200 450
2 7200
+
=
1 5650
2 7200
×
=
1 113
2 114
×
=
113
228
= .39
= .39 × 100
= .39% (Difficulty-Index)
19.
Unit 10 :Item Analysis : Item Difficulty, Discrimination index, Effectiveness of Distractors
137
LOVELY PROFESSIONAL UNIVERSITY
Notes
10.6.3 Calculation of D.P. Using Chi-square Test Formula
When the values calculated by the above formulae are different, it presents difficulty in their
comparative study; therefore, another formula is applied which is called Chi-square test formula.
this formula has two forms. The first form is applied in the situation when the value of RH
is
more than RL
, and the second form is applied when the value of RL
is more than RH
.
D.P. =
− −
−
−
H L
L
T
T L
R R 1
R
R 1
N NR
(First form, when RH
> RL
);
and
D.P. =
H L
T
T
T T
R R 1
R
R 1
N NR
− +
⎛ ⎞
−
⎜ ⎟
−
⎝ ⎠
(Second form when RL
> RH
)
Example : 340 class-10 students were administered a test. All related values of the test are given
below. Find out discriminating value using any square formula.
NH
= 100, RH
= 65, and NRH
= 15
NL
=100, RL
=25 and NRL
= 35
Solution : ∴ Discriminating Value :
=
H L
T
T
T T
R R 1
R
R 1
N NR
− −
⎛ ⎞
−
⎜ ⎟
−
⎝ ⎠
=
65 26
90
90 1
200 50
−
⎛ ⎞
− −
⎜ ⎟
−
⎝ ⎠
T H L
T H L
T H L
N =N N
R =R R
NR =NR NR
+
⎧ ⎫
⎪ ⎪
+
⎨ ⎬
⎪ ⎪
+
⎩ ⎭
=
65 26
90
90 1
200 50
−
⎛ ⎞
− −
⎜ ⎟
−
⎝ ⎠
=
39
3
90 1
5
⎛ ⎞
−
⎜ ⎟
⎝ ⎠
=
39
2
90
5
⎛ ⎞
⎜ ⎟
⎝ ⎠
=
39
36
=
39
6
= 6.5
Therefore, D.P. = 6.5
20.
Educational Measurement andEvaluation
138
Notes
LOVELY PROFESSIONAL UNIVERSITY
10.6.4 Horst’s Formula
Supposing the students’ responses in a multiple choice item has been noted down as below :
Item Analysis :
(a) Determining the number of actual items 12
(b) Excluding weak and ambiguous items 8
(c) Ensuring that selected items represent the entire test 20
(d) All of the above 10
Here, the alternative (c) is the greatest obstacle because it has attracted most of the students. This
is stronger than even alternative (d). So, Horst has determined some basic assumptions for his
formula S = Dp
, which are as follows :
(a) All obstacles do not attract all students equally, though there is an arrangement in their
attraction.
(b) Here importance is given to the most potent obstacle, which is very important from the
viewpoint of multiple choice items.
(c) The most potent obstacle should not be more attractive than the right alternative. If it is so,
then another obstacle should replace it.
In the above formula, placing values in the formula :
S = R – Dp
= 10 – 20
= – 10
Where, S = The number of students knowing the right response in fact.
R = The number of students giving right response to the item.
Dp
= The most potent obstacle.
The negative (minus) mark indicates that nobody known the right alternative. Therefore,
the alternatives should be reformed, which can be as follows :
Self Assessment
1. Multiple Choice Questions :
Choose the correct option :
(i) According to _____ “The procedure used to judge the quality of an item is called item
analysis.
(a) Lamarck (b) Freeman (iii) Guilford (iv) Ryen
(ii) If a test is survey type, then questions with difficulty index between ______ and with
discrimination index .3 or more are considered suitable.
(a) 40–80, .5 (b) 30–80, .2 (c) 20–80, .3 (d) 10–80, .1
(iii) The C
P =
W 1
R
K 1 N
⎛ ⎞
−
⎜ ⎟
−
⎝ ⎠
formula is known as ________.
(a) Kelly’s formula (b) Guilford’s formula
(c) Chi-square formula (d) Host’s formula
21.
Unit 10 :Item Analysis : Item Difficulty, Discrimination index, Effectiveness of Distractors
139
LOVELY PROFESSIONAL UNIVERSITY
Notes
(iv) In C
P =
1
2
H
H
H H
W 1
R
K 1 N – NR
⎧⎛ ⎞
− +
⎨⎜ ⎟
−
⎝ ⎠
⎩
⎫
⎛ ⎞
− ⎬
⎜ ⎟
−
⎝ ⎠ ⎭
L
L
L L
W 1
R
K 1 N – NR the H
R denotes ______
(a) Number of candidates in top group giving right response
(b) Number of candidates in top group giving wrong response
(c) Number of total candidates in top group
(d) Number of total candidates in bottom group
(v) Difficulty percentage =
H L
L
T
T T
R – R – 1
R
R 1
N NR
−
−
is called
(a) Guilford formula
(b) Chi-square test formula
(c) Kelly’s formula
(d) 27% Top and 27% bottom right response method
10.7 The Discrimination Index
The ‘Discrimination Index’ is a basic measure which shows the extent to which a question
discriminates or differentiates between students in the ‘High Marks’ group and ‘Low Marks’
group. This index can be interpreted as an indication of the extent to which overall knowledge of
the content area or mastery of the skills is related to the response on an item. Most crucial for a
test item is that whether a student got a question correct or not is due to their level of knowledge
or ability and not due to something else such as chance or test bias.
Note in our example earlier, 11 students in the high group and 2 students in the low group
selected the correct answer. This indicates positive discrimination, since he item differentiates
between students in the same way that the total test score does. That is, students with high scores
on the test (high group) got the item right more frequently than students with low scores on the
test (low group). Although analysis by inspection may be all that is necessary for most purposes,
an index of discrimination can be easily computed using the following formula :
Discrimination Index =
Number of Students in ‘High Marks’ group (RH
) with the Correct Answer u) Minus (—)
Number of Students in ‘Low Marks’ group (RL
) with the Correct Answer divided by (÷)
Half the Total Number of Students who Attempted the Question (½T)
Example : A test was given to a group of 43 students and 10 out of the 13 ‘High Marks’ group got
the correct answer compared to 5 out of 13 ‘Low Marks’ group who got the correct answer. The
discrimination index is computer as follows :
=
H L
R R
½T
−
=
( )
10 5
½ 26
−
=
10 5
13
−
= 0.38
What does a Discrimination Index of 0.38 mean ? The discrimination index is a coefficient that
shows the extent to which the question discriminates or differentiates between ‘High Marks”
22.
Educational Measurement andEvaluation
140
Notes
LOVELY PROFESSIONAL UNIVERSITY
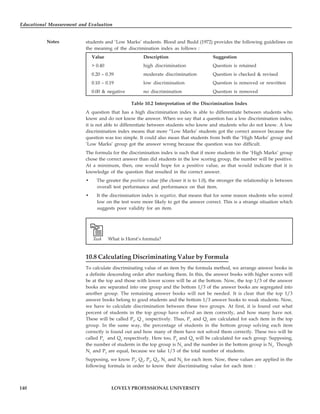
students and ‘Low Marks’ students. Blood and Budd (1972) provides the following guidelines on
the meaning of the discrimination index as follows :
Value Description Suggestion
> 0.40 high discrimination Question is retained
0.20 – 0.39 moderate discrimination Question is checked & revised
0.10 – 0.19 low discrimination Question is removed or rewritten
0.00 & negative no discrimination Question is removed
Table 10.2 Interpretation of the Discrimination Index
A question that has a high discrimination index is able to differentiate between students who
know and do not know the answer. When we say that a question has a low discrimination index,
it is not able to differentiate between students who know and students who do not know. A low
discrimination index means that more “Low Marks’ students got the correct answer because the
question was too simple. It could also mean that students from both the ‘High Marks’ group and
‘Low Marks’ group got the answer wrong because the question was too difficult.
The formula for the discrimination index is such that if more students in the ‘High Marks’ group
chose the correct answer than did students in the low scoring group, the number will be positive.
At a minimum, then, one would hope for a positive value, as that would indicate that it is
knowledge of the question that resulted in the correct answer.
• The greater the positive value (the closer it is to 1.0), the stronger the relationship is between
overall test performance and performance on that item.
• It the discrimination index is negative, that means that for some reason students who scored
low on the test were more likely to get the answer correct. This is a strange situation which
suggests poor validity for an item.
What is Horst’s formula?
10.8 Calculating Discriminating Value by Formula
To calculate discriminating value of an item by the formula method, we arrange answer books in
a definite descending order after marking them. In this, the answer books with higher scores will
be at the top and those with lower scores will be at the bottom. Now, the top 1/3 of the answer
books are separated into one group and the bottom 1/3 of the answer books are segregated into
another group. The remaining answer books will not be needed. It is clear that the top 1/3
answer books belong to good students and the bottom 1/3 answer books to weak students. Now,
we have to calculate discrimination between these two groups. At first, it is found out what
percent of students in the top group have solved an item correctly, and how many have not.
These will be called P1
, Q 1
respectively. Thus, P1
and Q1
are calculated for each item in the top
group. In the same way, the percentage of students in the bottom group solving each item
correctly is found out and how many of them have not solved them correctly. These two will be
called P1
and Q2
respectively. Here too, P2
and Q2
will be calculated for each group. Supposing,
the number of students in the top group is N1
and the number in the bottom group is N1
. Though
N1
and P2
are equal, because we take 1/3 of the total number of students.
Supposing, we know P1
, Q1
, P2
, Q2
, N1
and N2
for each item. Now, these values are applied in the
following formula in order to know their discriminating value for each item :
23.
Unit 10 :Item Analysis : Item Difficulty, Discrimination index, Effectiveness of Distractors
141
LOVELY PROFESSIONAL UNIVERSITY
Notes
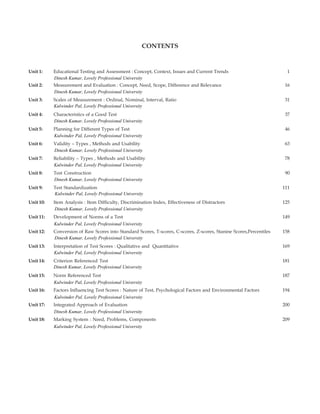
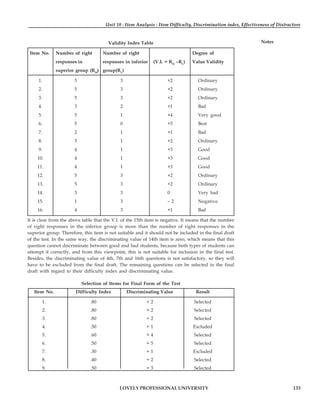
D =
−
+
1 2
1 1 2 2
1 2
P P
P Q P Q
N N
In this formula, D means discriminating value. If this value is more than 1.96, then we can say
that our items are discriminating, that is, they are good enough to discriminate between good
and weak students. Thus, we calculate the discriminating value for each item. The items having
D higher than 1.96 or 2.00 will be considered as good.
The following formula is used to estimate the discriminating value of the test :
D.P. = PQ
Where, D.P. = Discriminating value
P = Number of students solving items correctly (in percent)
Q = The number of students solving items incorrectly (in percent)
Example : In a test, 50 students have solved an item correctly and the remaining incorrectly.
Estimate discriminating value of the item when the test was administered on 80 students.
Formula, D.P. = PQ
Here, P =
R
100
N
×
=
50
100
80
×
= 62.5%
And, Q = 100 – P [or Q =
W
100
N
× ]
= 100 – 62.5
= 37.5 percent
Thus, D.P. = 37.5 × 62.5
= 2343.5 (about)
[Note : An item with 2500 discriminating value is considered suitable.]
4.27% Top and 27% Bottom Right Response Method : This is a very popular method and it was
mentioned by Garrett in this way.
Under this method, the answer books are arranged in the descending order, that is, the answer
book obtaining the highest marks is placed at the top and the one obtaining the lowest marks is
placed at the bottom. Then the top 27% and bottom 27% are allowed to be the while the remaining
answer books are taken out. Supposing, we had a total of 300 answer books, then the top 81 and
bottom 81 answer books are taken while other 138 answer books are not considered. Now the
top and bottom groups are analyzed for the right responses for each item and their percentage is
found out. Then the difficulty index and bi-serial correlation, that is, discriminating value is
calculated using the table given on the previous page.
The use of table can be explained by the following example :
Example : In an examination, the number of candidates in the top 27% and bottom 27% solving
the first three of the eighty questions is as follows :
24.
Educational Measurement andEvaluation
142
Notes
LOVELY PROFESSIONAL UNIVERSITY
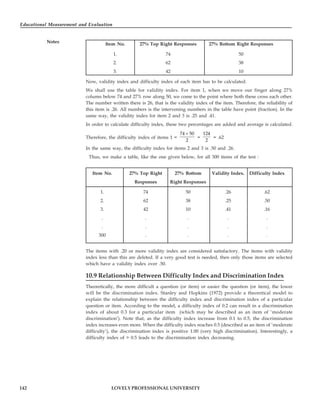
Item No. 27% Top Right Responses 27% Bottom Right Responses
1. 74 50
2. 62 38
3. 42 10
Now, validity index and difficulty index of each item has to be calculated.
We shall use the table for validity index. For item 1, when we move our finger along 27%
column below 74 and 27% row along 50, we come to the point where both these cross each other.
The number written there is 26, that is the validity index of the item. Therefore, the reliability of
this item is .26. All numbers is the intervening numbers in the table have point (fraction). In the
same way, the validity index for item 2 and 3 is .25 and .41.
In order to calculate difficulty index, these two percentages are added and average is calculated.
Therefore, the difficulty index of items 1 =
74 50
2
+
=
124
2
= .62
In the same way, the difficulty index for items 2 and 3 is .50 and .26.
Thus, we make a table, like the one given below, for all 300 items of the test :
Item No. 27% Top Right 27% Bottom Validity Index. Difficulty Index
Responses Right Responses
1. 74 50 .26 .62
2. 62 38 .25 .50
3. 42 10 .41 .16
. . . . .
. . . . .
300 . . . .
The items with .20 or more validity index are considered satisfactory. The items with validity
index less than this are deleted. If a very good test is needed, then only those items are selected
which have a validity index over .50.
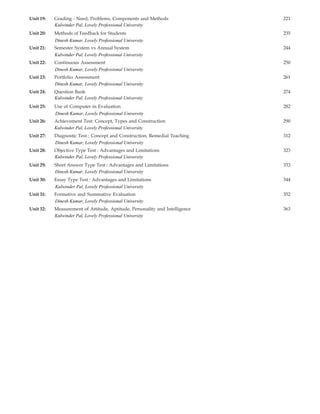
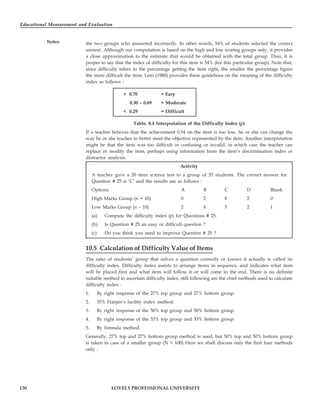
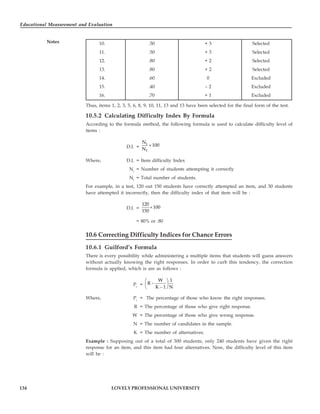
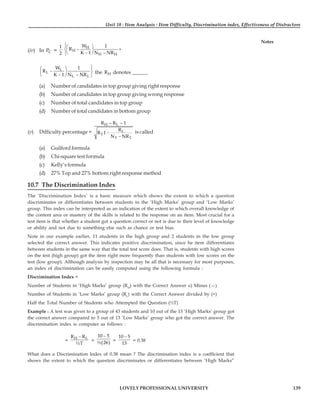
10.9 Relationship Between Difficulty Index and Discrimination Index
Theoretically, the more difficult a question (or item) or easier the question (or item), the lower
will be the discrimination index. Stanley and Hopkins (1972) provide a theoretical model to
explain the relationship between the difficulty index and discrimination index of a particular
question or item. According to the model, a difficulty index of 0.2 can result in a discrimination
index of about 0.3 for a particular item (which may be described as an item of ‘moderate
discrimination’). Note that, as the difficulty index increase from 0.1 to 0.5, the discrimination
index increases even more. When the difficulty index reaches 0.5 (described as an item of ‘moderate
difficulty’), the discrimination index is positive 1.00 (very high discrimination). Interestingly, a
difficulty index of > 0.5 leads to the discrimination index decreasing.
25.
Unit 10 :Item Analysis : Item Difficulty, Discrimination index, Effectiveness of Distractors
143
LOVELY PROFESSIONAL UNIVERSITY
Notes
Question
too difficult
Question
too easy
0.1 0.5
0.2 0.6
0.3 0.7 0.9
0.4 0.8 1.0
0.00
0.50
0.10
0.60
0.20
0.70
0.30
0.80
0.40
0.90
1.00
Discrimi
-nation
Index
Difficulty Index
Difficulty Index
Theoretical Relationship between Index of Difficulty and Discrimination Index
[source : G. Stanley and D. Hopkins, 1972. Introduction to Educational Measurement and Testing.
Boston : Macmillan.p.270]
• For example, a difficulty index of 0.9 results in a discrimination index of about 0.2 which is
described as an item of low to moderate discrimination. What does this mean ? The more
difficult a question, the harder is for that question or item to discriminate between those
students who know and do not know the answer to the question.
• Similarly, when the difficulty index is about 0.1, the discrimination index drops to about 0.2.
What does this mean ? The easier a question, the harder is for that question or item to
discriminate between those students who know and do not know the answer to the question.
10.10 Effectiveness of Distractors
In addition to examining the performance of an entire test item, teachers are also interested in
examining the performance of individual distractors (incorrect answer options) on multiple-
choice items. By calculating the proportion of students who chose each answer option, teachers
can identify which distractors are “working” and appear attractive to students who do not know
the correct answer, and which distractors are simply taking up space and not being chosen by
many students. To eliminate blind guessing which results in a correct answer purely by chance
(which hurts the validity of a test item), teachers want as many plausible distractors as is feasible.
Analyses of response options allow teachers to fine tune and improve items they may wish to
use again with future classes. Let us examine performance on an item or question.
Which European power invaded Melaka in 1511 ?
Portuguese Dutch Spanish English
Options A B C D No Response
High Marks Group (n = 12) 5 5 0 2 0
Low Marks Group (n = 12) 3 4 0 5 0
Table : Effectiveness of Distractors
26.
Educational Measurement andEvaluation
144
Notes
LOVELY PROFESSIONAL UNIVERSITY
Generally, a good distractor is able to attract more ‘Low Marks’ students to select that particular
response or distract ‘Low Marks’ students towards selecting that particular response. What
determines the effectiveness of distractors ? See Figure which shows how 24 students selected the
options A, B, C and D for a particular question. Option B is a less effective distractor because
many ‘High Marks’ students (n = 5) selected option B. Option D is relatively a good distractor
because 2 students from the ‘High Marks’ group and 5 students from the ‘Low Marks’ group
selected this option. The analysis of response options shows that those who missed the item were
about equally likely to choose answer B and answer D. No students chose answer C. Answer C
does not act as a distractor. Students are not choosing between four answer options on this item,
they are really choosing between only three options, as they are not even considering answer C.
This makes guessing correctly more likely, which hurts the validity of the item. The discrimination
index can be improved by modifying and improving options B and C.
Activity
Which British resident was killed by Maharajalela in Pasir Salak ?
H. Low Birch Brooke Gurney
Options A B C D No Response
High Marks (n = 15) 4 7 0 4 0
Low Marks (n = 15) 6 3 2 4 0
The answer is B.
Analyse the effectiveness of the distractors.
10.11 A Practical Approach in Item Analysis
Some teachers may find the techniques discussed earlier as time consuming which cannot be
denied (especially when you have a test consisting of 40 items). However, there is a more
practical approach which may take less time. Imagine that you have administered a 40 item test
to a class of 30 students. Surely, it will take a lot of time to analyse the effectiveness of each item
which may discourage teachers from analysing each item in a test. Diederich (1971) proposed a
method of item analysis which can be conducted by the teacher and the students in his or her
class. The following are the steps :
Step 1 : Arrange the 30 answer sheets from the highest score obtained until the lowest score
obtained.
Step 2 : Select the answer sheet that obtained a middle score. Group all answer sheets above
this score as ‘High Marks’ (mark a ‘H’ on these answer sheets). Group all answer sheets
below this score as ‘Low Marks’ group (mark a ‘L’ on these answer sheets).
Step 3 : Divide the class into two groups (High and Low) and distribute the ‘High’ answer
sheets to the High groups and the Low answer sheet to the Low group. Assign one
student in each group to be the counter.
Step 4 : The teacher than asks the class.
Teacher : “The answer for Question # 1 is ‘C’ and those who got it correct, raise your
hand’.
Counter from ‘H’ group : “Fourteen for group H”
Counter from ‘L’ group : “Eight from group L”
27.
Unit 10 :Item Analysis : Item Difficulty, Discrimination index, Effectiveness of Distractors
145
LOVELY PROFESSIONAL UNIVERSITY
Notes
Step 5 : The teacher records the responses on the whiteboard as follows :
High Low Total of Correct Answers
Question # 1 14 8 22
Question # 2 12 6 18
Question # 3 16 7 23
|
|
Question # n n n n
Step 6 : Compute the Difficulty Index for Question # 1 as follows :
Difficulty Index =
H L
R +R
30
=
14 8
30
+
= 0.73
Step 7 : Compute the Discrimination Index for Question # 1 as follows :
Discrimination Index =
H L
R R
½30
−
=
14 8
15
−
=
6
15
= 0.40
Note that earlier, we took 27% of answer sheets in the ‘High Marks’ group and 27% of answer
sheets in the ‘Low Marks’ group from the total answer sheets. However, in this approach we
divided the total answer sheets into two groups. There is no middle group. The important thing
is to use a large enough fraction of the group to provide useful information. Selecting the top and
bottom 27 per cent of the group is recommended for more refined analysis. This method may be
less accurate but it is a ‘quick and dirty’ method.
Self Assessment
2. Fill in the blanks :
(i) ______ is a basic measure which shows the extent to which a question discriminates
between students in the High marks groups and Low marks group.
(ii) For calculating discriminating value of an item by the formula method, the answer books
are arranged in a definite ______ order.
(iii) 27% Top and 27% bottom right response method was mentioned by ______.
(iv) ______ provide a theoretical model to explain the relationship between difficulty index
and discrimination index.
10.12 Summary
• According to Lamark, “The procedure used to judge the quality of an item is called item-
analysis.”
• The chief objective of item-analysis of a test is to select those items which are suitable,
reliable and valid for that class of students or individuals for whom the test has been
constructed. A good test requires.
• In brief, item-analysis is needed for the following purposes :
(i) Rejecting the items which are weak and have double meaning.
(ii) Each selected item should represent the whole test.
(iii) Determining the number of items to be included in the test.
28.
Educational Measurement andEvaluation
146
Notes
LOVELY PROFESSIONAL UNIVERSITY
• Criteria for Item-analysis : The purpose of item-analysis is to select suitable and good test
items from the many items the test-maker has made.
• This decision is taken on two bases :
(i) Difficulty index, and
(ii) Discrimination index or validity index.
• Process of Item-analysis
• To undertake item-analysis, at first the test is administered to a sample of those individuals
or students for whom it has been constructed. After that, all test papers are marked and the
following processes are sequentially followed :
(i) Test-papers or answer-sheets are arranged in the ascending order of scores.
(ii) To prepare item-analysis chart. In this chart, at first, the serial number of items is written
in the columns.
(iii) After this, the answer-sheet of each student is taken and it is seen whether he has solved
it correctly or not, and a right tick mark is given for the right response and a cross mark
is given for the wrong response.
(iv) In each column of the chart from top to bottom, the right tick marks are counted and are
changed into percentage in order to write them in the form of difficulty index.
(v) To calculate discrimination index, we divide the analysis chart into almost three equal
parts from top to bottom.
(vi) Now, each item of the test in the chart is studied to see whether its difficulty index is
between 20-80 or 10-50 as per the objective of the test and whether its discrimination
index is above .3 or not.
• Using the information provided in you can compute the ‘Difficulty Index’ which is a
quantitative indicator with regards to the difficulty level of an individual item or question.
It can be calculated using the following formula :
• Difficulty Index
=
( )
( )
Number of Students with the Correct Answer R
Total number of Students who Attempted the Question T
=
R
T
=
13
24
= 0.54
• The ratio of students’ group that solves a question correctly or knows it actually is called its
difficulty index. Difficulty index assists to arrange items in sequence, and indicates what
item will be placed first and what item will follow it or will come in the end.
• 50% Top and 50% Bottom Group Right Response Method
• For example, a subject teacher wants to prepare a weekly objective test containing 10 items.
He has Calculating Difficulty Index By Formula
• According to the formula method, the following formula is used to calculate difficulty level
of items :
• The ‘Discrimination Index’ is a basic measure which shows the extent to which a question
discriminates or differentiates between students in the ‘High Marks’ group and ‘Low Marks’
group. This index can be interpreted as an indication of the extent to which overall knowledge
of the content area or mastery of the skills is related to the response on an item.
29.
Unit 10 :Item Analysis : Item Difficulty, Discrimination index, Effectiveness of Distractors
147
LOVELY PROFESSIONAL UNIVERSITY
Notes
• Correcting Difficulty Indices for Chance Errors
• Guilford’s Formula : There is every possibility while administering a multiple items that
students will guess answers without actually knowing the right responses. In order to curb
this tendency, the correction formula is applied, which is are as follows :
• When the number of students is very large, in such a situation, Kelley’s top 27% and
bottom 27% formula proves convenient, which is as follows :
• Pc
=
H L
H L
H H L L
1 W 1 W 1
R R
2 K 1 N NR K 1 N NR
⎧ ⎫
⎛ ⎞ ⎛ ⎞
− + −
⎨ ⎬
⎜ ⎟ ⎜ ⎟
− − − −
⎝ ⎠ ⎝ ⎠
⎩ ⎭
• Calculation of D.P. Using Chi-square Test Formula : When the values calculated by the
above formulae are different, it presents difficulty in their comparative study; therefore,
another formula is applied which is called Chi-square test formula. this formula has two
forms. The first form is applied in the situation when the value of RH
is more than RL
, and
the second form is applied when the value of RL
is more than RH
.
• Supposing the students’ responses in a multiple choice item has been noted down as below:
• Item Analysis :
(a) Determining the number of actual items 12
(b) Excluding weak and ambiguous items 8
(c) Ensuring that selected items represent the entire test 20
(d) All of the above 10
• Here, the alternative (c) is the greatest obstacle because it has attracted most of the students.
This is stronger than even alternative (d). So, Horst has determined some basic assumptions
for his formula S = Dp
, which are as follows :
(a) All obstacles do not attract all students equally, though there is an arrangement in their
attraction.
(b) Here importance is given to the most potent obstacle, which is very important from the
viewpoint of multiple choice items.
(c) The most potent obstacle should not be more attractive than the right alternative. If it is
so, then another obstacle should replace it.
• Calculating Discriminating Value of Validity Index by Formula
• To calculate discriminating value of an item by the formula method, we arrange answer
books in a definite descending order after marking them. In this, the answer books with
higher scores will be at the top and those with lower scores will be at the bottom.
• 4.27% Top and 27% Bottom Right Response Method : This is a very popular method and it
was mentioned by Garrett in this way.
• Under this method, the answer books are arranged in the descending order, that is, the
answer book obtaining the highest marks is placed at the top and the one obtaining the
lowest marks is placed at the bottom. Then the top 27% and bottom 27% are allowed to be
the while the remaining answer books are taken out.
• The more difficult a question (or item) or easier the question (or item), the lower will be the
discrimination index. Stanley and Hopkins (1972) provide a theoretical model to explain the
relationship between the difficulty index and discrimination index of a particular question
or item. According to the model, a difficulty index of 0.2 can result in a discrimination index
of about 0.3 for a particular item (which may be described as an item of 'moderate
discrimination').
30.
Educational Measurement andEvaluation
148
Notes
LOVELY PROFESSIONAL UNIVERSITY
• In addition to examining the performance of an entire test item, teachers are also interested
in examining the performance of individual distractors (incorrect answer options) on
multiple-choice items. By calculating the proportion of students who chose each answer
option, teachers can identify which distractors are “working” and appear attractive to
students who do not know the correct answer, and which distractors are simply taking up
space and not being chosen by many students.
10.13 Keywords
Item : A single article or object
analysis : A detailed study or examination of something in order to understand more
about it.
discrimination : The practice of treating somebody or a particular group in society less
fairly particular group in society less fairly than others.
10.14 Review Questions
1. What is item analysis ? Why is the need of item analysis ?
2. Explain the stepwise process of item analysis
3. How can of Calculate the difficulty value of items ? Explain different methods with examples
4. Explain the Kelly’s formula.
5. Describe the relationship between Difficulty index and discrimination index
6. What is effectiveness of distractors ?
Answer : Self Assessment
1. (i) a (ii) c (iii) b (iv) a (v) b
2. (i) Discrimination index (ii) decending
(iii) Garret (iv) Stanley and Hopkins
10.15 Further Readings
1. Education Measurement and Evaluation : J.Swarupa Rani, Discovery Publishing
house.
2. Measurement and Evaluation in Teaching : Norman Edward Gronlund Macmillian
3. Measurement and Assessment in Teaching : Robert L. Linn Pearson Education
India.
4. Program Evaluation and performance measurement : James C. Me. David, Laura
R.L. Hawthorn, Sage Publications.

![Educational Measurement and Evaluation
126
Notes
LOVELY PROFESSIONAL UNIVERSITY
is done. What is item analysis ? Item analysis is a process which examines the responses to
individual test items or question in order to assess the quality of those items and the test as a
whole. Item analysis is especially valuable in improving items or questions that will be used
again in later tests, but it can also be used to eliminate ambigous or misleading items in a single
test administration. Specifically, item analysis is the process of finding out the difficulty index,
discrimination index and the effectiveness of distractors. [We will discuss each of these components of item
analysis in detail later].
The quality of a test is determined by the quality of each item or question in the test. The teacher
who constructs a test can only roughly estimate the quality of a test. This estimate is based on the
fact that the teacher has followed all the rules and conditions of test construction. However, it is
possible that this estimation may not be accurate and certain important aspects have been ignored.
Hence, it is suggested that to obtain a more comprehensive understanding of the test, item
analysis should be conducted on the responses of students. Item analysis is conducted to obtain
information about individual items or questions in a test and how the test can be improved. It
also facilitates the development of an item or question bank which can be used in the construction
of a test (Anastasi, 2001).
10.1 Meaning of Item Analysis
The success of a test depends on two factors. First, how successfully a test measures our prescribed
objectives, and second, can each item in the test discriminate between bright and dull students or
not. If a test is not capable of measuring the given objectives meaningfully and discriminating
students, then it cannot be called a successful test.
When a test is constructed, it is begun by noting down the desirable behavioural or personality
trait, and the statements or problems relating to them. As a common rule, the number of these
statements or test items is far larger than the desirable number in the test. It is done so that the
tests found not fit for final inclusion can be deleted. Therefore, an important task of a test-maker
is to verify the test items and select only those which are good enough, reliable, valid and which
fulfil the objectives. This whole process is called item-analysis.
As far as item-analysis is concerned, Freeman has opined that two aspects should be chiefly
considered while undertaking item-analysis : first, the difficulty level of items and second,
discriminating value of test items. According to Guilford, before the final form of the test is
constructed, the method of item-analysis must be applied. The different attributes of the whole
test are dependent on the items included in a test, such as mean variance, form of score distribution,
reliability and validity.
According to Lamark, “The procedure used to judge the quality of an item is called item-analysis.”
10.2 Need of Item-Analysis
The chief objective of item-analysis of a test is to select those items which are suitable, reliable
and valid for that class of students or individuals for whom the test has been constructed. A good
test requires good test items. If the test items of a test are objective-oriented, and are also reliable
and valid, then the test becomes useful. Selecting such items is the purpose of item-analysis.
In brief, item-analysis is needed for the following purposes :
1. Rejecting the items which are weak and have double meaning.
2. Each selected item should represent the whole test.
3. Determining the number of items to be included in the test.
4. Expressing the defects in the responses of the students.](https://image.slidesharecdn.com/itemanalysis-251024113314-818363b4/85/Item-Analysis-for-measurement-and-evaluation-8-320.jpg)

![Unit 10 : Item Analysis : Item Difficulty, Discrimination index, Effectiveness of Distractors
135
LOVELY PROFESSIONAL UNIVERSITY
Notes
Pc
=
60
240
4 1 300
1
⎛ ⎞
−
⎜ ⎟
−
⎝ ⎠
[W = N – R]
=
60
240
3 300
1
⎛ ⎞
−
⎜ ⎟
⎝ ⎠
= ( )
240 20
300
1
−
=
220
300
= .733
= .733 × 100 = 73.3% (Difficulty Index in Percent)
Sometimes it is seen in multiple choice items that a student is not able to attempt some items of
the test. It could be due to lack of time or the items being very difficult, or some other cause. Such
items are called unattempted or unreached items. For explanation, supposing in a 50-item test, a
candidate has attempted all questions from 1 to 25, he has not attempted items 26 and 27, and
then he has solved all items from 28 to 40, and has not solved any item after that. In such a
situation, items 41 to 50 will be called unattempted or unreached items, but not items 26 and 27.
besides, there will be three groups of candidates : who have given right responses, who have
given wrong responses and who have not responded.
In solving this type of questions, the formula is amended to the following form :
Pc
=
W 1
R
K 1 N NR
⎛ ⎞
−
⎜ ⎟
− −
⎝ ⎠
Here, NR is the number of candidates who have not been able to solve an item or have not
attempted it. The remaining all symbols have been used as in the previous formula.
Example : Supposing, a 100-item test was administered to 300 candidates. Each item contained 4
alternatives. This is also assumed that 150 were right responses, 120 were wrong responses and
30 were unattempted. In such a situation, the difficulty index of that particular item will be as
follows:
Pc
=
120 1
150
4 1 300 30
⎛ ⎞
−
⎜ ⎟
− −
⎝ ⎠
=
120 1
150
3 270
⎛ ⎞
−
⎜ ⎟
⎝ ⎠
= ( )
1
150 40
270
−
=
1
110
270
×
=
11
27
= 0.4 ×100
= 40%](https://image.slidesharecdn.com/itemanalysis-251024113314-818363b4/85/Item-Analysis-for-measurement-and-evaluation-17-320.jpg)
![Unit 10 : Item Analysis : Item Difficulty, Discrimination index, Effectiveness of Distractors
141
LOVELY PROFESSIONAL UNIVERSITY
Notes
D =
−
+
1 2
1 1 2 2
1 2
P P
P Q P Q
N N
In this formula, D means discriminating value. If this value is more than 1.96, then we can say
that our items are discriminating, that is, they are good enough to discriminate between good
and weak students. Thus, we calculate the discriminating value for each item. The items having
D higher than 1.96 or 2.00 will be considered as good.
The following formula is used to estimate the discriminating value of the test :
D.P. = PQ
Where, D.P. = Discriminating value
P = Number of students solving items correctly (in percent)
Q = The number of students solving items incorrectly (in percent)
Example : In a test, 50 students have solved an item correctly and the remaining incorrectly.
Estimate discriminating value of the item when the test was administered on 80 students.
Formula, D.P. = PQ
Here, P =
R
100
N
×
=
50
100
80
×
= 62.5%
And, Q = 100 – P [or Q =
W
100
N
× ]
= 100 – 62.5
= 37.5 percent
Thus, D.P. = 37.5 × 62.5
= 2343.5 (about)
[Note : An item with 2500 discriminating value is considered suitable.]
4.27% Top and 27% Bottom Right Response Method : This is a very popular method and it was
mentioned by Garrett in this way.
Under this method, the answer books are arranged in the descending order, that is, the answer
book obtaining the highest marks is placed at the top and the one obtaining the lowest marks is
placed at the bottom. Then the top 27% and bottom 27% are allowed to be the while the remaining
answer books are taken out. Supposing, we had a total of 300 answer books, then the top 81 and
bottom 81 answer books are taken while other 138 answer books are not considered. Now the
top and bottom groups are analyzed for the right responses for each item and their percentage is
found out. Then the difficulty index and bi-serial correlation, that is, discriminating value is
calculated using the table given on the previous page.
The use of table can be explained by the following example :
Example : In an examination, the number of candidates in the top 27% and bottom 27% solving
the first three of the eighty questions is as follows :](https://image.slidesharecdn.com/itemanalysis-251024113314-818363b4/85/Item-Analysis-for-measurement-and-evaluation-23-320.jpg)
![Unit 10 : Item Analysis : Item Difficulty, Discrimination index, Effectiveness of Distractors
143
LOVELY PROFESSIONAL UNIVERSITY
Notes
Question
too difficult
Question
too easy
0.1 0.5
0.2 0.6
0.3 0.7 0.9
0.4 0.8 1.0
0.00
0.50
0.10
0.60
0.20
0.70
0.30
0.80
0.40
0.90
1.00
Discrimi
-nation
Index
Difficulty Index
Difficulty Index
Theoretical Relationship between Index of Difficulty and Discrimination Index
[source : G. Stanley and D. Hopkins, 1972. Introduction to Educational Measurement and Testing.
Boston : Macmillan.p.270]
• For example, a difficulty index of 0.9 results in a discrimination index of about 0.2 which is
described as an item of low to moderate discrimination. What does this mean ? The more
difficult a question, the harder is for that question or item to discriminate between those
students who know and do not know the answer to the question.
• Similarly, when the difficulty index is about 0.1, the discrimination index drops to about 0.2.
What does this mean ? The easier a question, the harder is for that question or item to
discriminate between those students who know and do not know the answer to the question.
10.10 Effectiveness of Distractors
In addition to examining the performance of an entire test item, teachers are also interested in
examining the performance of individual distractors (incorrect answer options) on multiple-
choice items. By calculating the proportion of students who chose each answer option, teachers
can identify which distractors are “working” and appear attractive to students who do not know
the correct answer, and which distractors are simply taking up space and not being chosen by
many students. To eliminate blind guessing which results in a correct answer purely by chance
(which hurts the validity of a test item), teachers want as many plausible distractors as is feasible.
Analyses of response options allow teachers to fine tune and improve items they may wish to
use again with future classes. Let us examine performance on an item or question.
Which European power invaded Melaka in 1511 ?
Portuguese Dutch Spanish English
Options A B C D No Response
High Marks Group (n = 12) 5 5 0 2 0
Low Marks Group (n = 12) 3 4 0 5 0
Table : Effectiveness of Distractors](https://image.slidesharecdn.com/itemanalysis-251024113314-818363b4/85/Item-Analysis-for-measurement-and-evaluation-25-320.jpg)